META - IWB: Mega-Cap Tech Powers US Large Caps Higher Buy Into Year-End
2023-11-11 22:40:39 ET
Summary
- Mega-cap tech stocks continue to drive the S&P 500 higher in 2023.
- Active managers are underweighting these stocks and are forced to buy them to improve their portfolios.
- The iShares Russell 1000 ETF (IWB) is a good investment option with strong seasonality and a reasonable valuation.
It’s the same old song. Mega-cap tech stocks continue to power the S&P 500 and broad US stock market higher in 2023. The latest narrative catching on across Wall Street trading desks is the notion that active managers are simply underweight the Mag Seven stocks, and are then forced to buy this year’s big winners to window-dress their portfolios by year-end.
But earnings growth among those handful of glamour names is strong, making the fundamental case compelling. No matter the reason, momentum has turned in favor of the bulls.
I have a buy rating on the iShares Russell 1000 ETF ( IWB ). This diversified large-cap fund features a reasonable valuation and strong seasonality right now.
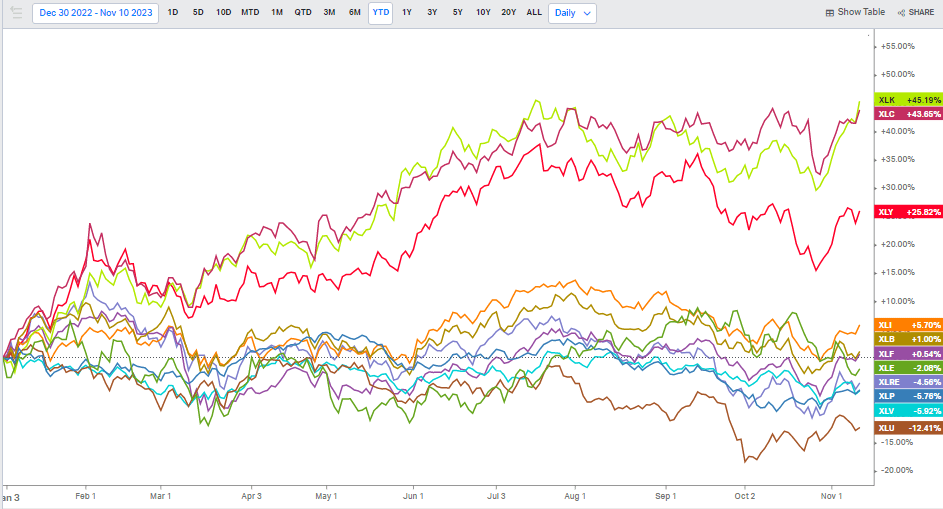
Tech & Communication Services Are 2023 Sector Winners
According to the issuer, IWB seeks to track the investment results of an index composed of large- and mid-capitalization U.S. equities. The ETF offers investors exposure to 1000 domestic stocks in a single fund and can be used as a strategic long-term holding for retail investors.
IWB is a large ETF with more than $30 billion in assets under management. Its annual expense ratio is low at 0.15%, though you can buy cheaper total market index funds that perform similarly to IWB. Still, its liquidity is robust with average trading volume of more than 800k shares daily and a 30-day median bid/ask spread of just two basis points. Moreover, share-price momentum is rated with an A by Seeking Alpha’s ETF Grades and IWB’s trailing 12-month dividend yield is slightly under that of the S&P 500 at 1.4% as of November 10, 2023. The Russell 1000 is not a highly risky slice of the global stock market either.
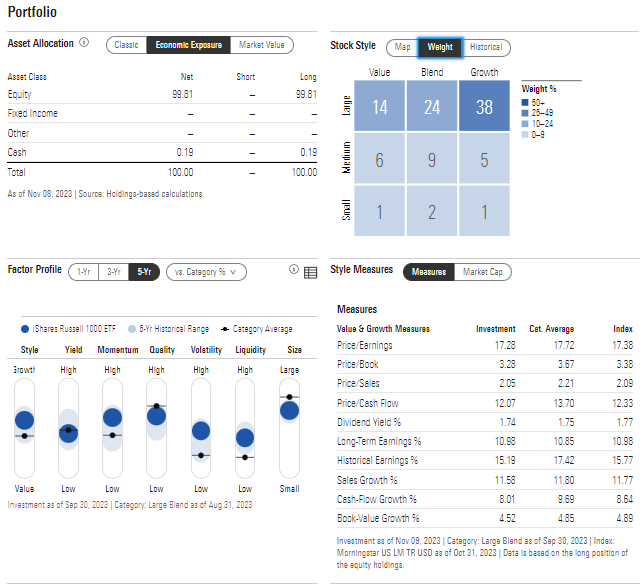
Digging into the portfolio, the 4-star, silver-rated ETF by Morningstar has style diversification considering that less than half of the allocation is considered growth with more than 20% being considered value. On the other hand, IWB is more than three-quarters allocated to large caps, so it has outperformed the weak small and mid-cap areas of the stock market over the last year.
The fund’s forward operating price-to-earnings ratio is reasonable at just above 17 times, though critics might say that today’s loftier interest rates should imply a lower P/E. I contend, however, that the sector composition of IWB is heavily weighted to growth areas that should command a higher valuation.
IWB: Portfolio & Factor Profiles
Speaking of sectors, IWB is somewhat concentrated considering its nearly 30% allocation to the Information Technology sector. Health Care and Financials are next on the sector-weight list with Energy, Real Estate, Utilities, and Materials being very low positions in the ETF.
IWB: Sector Breakdown & Dividend Information
Seeking Alpha
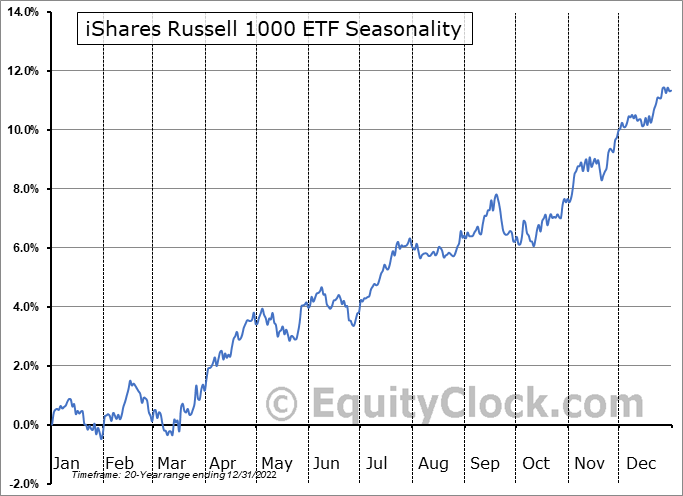
Seasonally, IWB tends to rally into year-end, but then trade sideways through mid-March of the new year, according to data from Equity Clock . This is the emerging seasonal trend – it used to be that January was a solid month, but volatility to begin a year has been the theme more recently. So, while there is a bullish bias over the next month and a half, caution is warranted starting in January.
IWB: Bullish Seasonal Trends Into Year-End
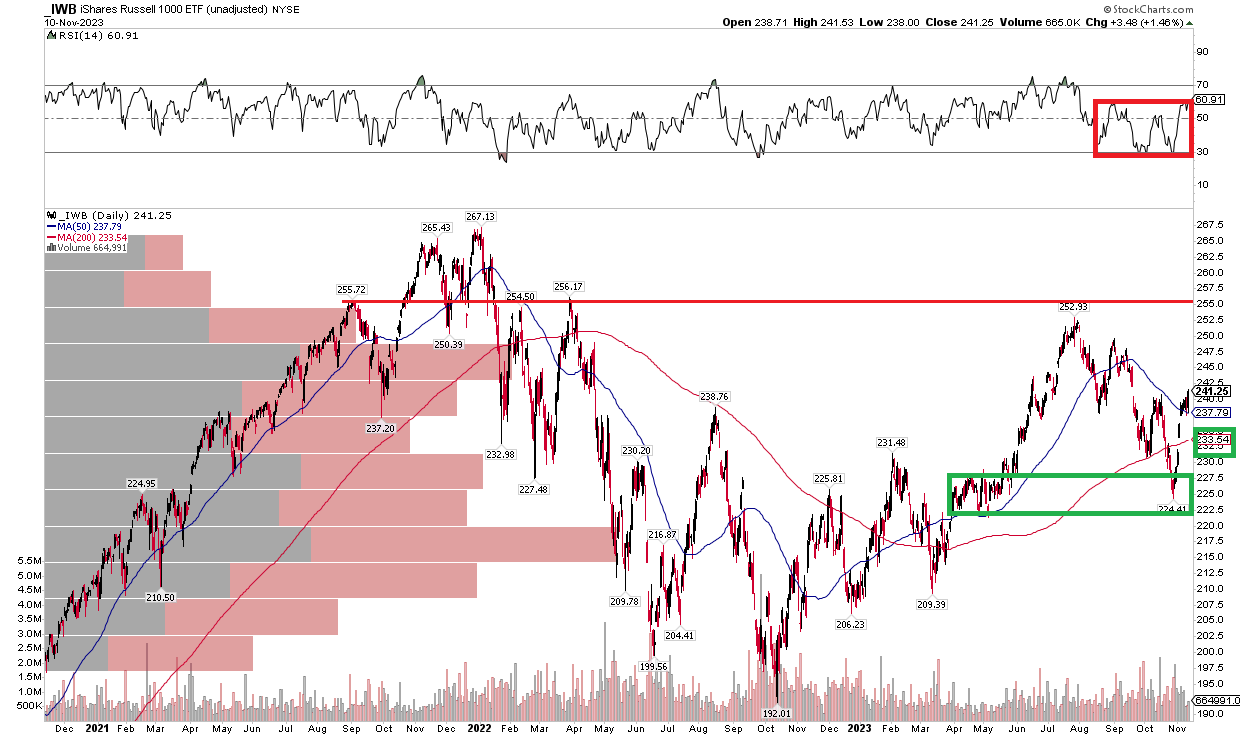
The Technical Take
IWB’s chart is not all that exciting, so I don’t consider it a screaming buy today. Notice in the graph below that shares held support from April and May. That previous congestion zone brought about dip-buyers during the August through October correction. A 10% drop may have been all the bears could have mustered, despite IWB breaking under its long-term 200-day moving average for a time.
Today, the ETF is back above not only the 200dma but also its falling 50-day moving average. With a bullish seasonal situation setting up, I assert that IWB could have legs to approach the 2023 peak near $253. I would like to see, however, an RSI breakout from this current 30 to 60 zone to help confirm the upward price thrust.
Overall, the technical situation is slightly bullish, but more work is needed to suggest a long-term uptrend is in place.
IWB: Eyeing A Test of the 2023 High
The Bottom Line
I have a buy rating on IWB. I see higher prices for the US large-cap index ETF into year-end while caution and a re-assessment are prudent once 2023 gets underway.
For further details see:
IWB: Mega-Cap Tech Powers US Large Caps Higher, Buy Into Year-End