CA - JRI: Real Assets At An Attractive Discount
Summary
- JRI has performed well since our last update, but the discount remains attractive.
- This fund is split between real assets, and that includes real estate and energy infrastructure exposure.
- REITs had a tough time in 2022, but that side of the sleeve is starting to show some strength.
Written by Nick Ackerman, co-produced by Stanford Chemist. This article was originally published to members of the CEF/ETF Income Laboratory on January 14th, 2023.
Nuveen Real Asset Income and Growth Fund ( JRI ) had a tough 2022, but so did most other investments, so it wasn't unique to the fund. One thing that is unique to JRI being a closed-end fund is the discounts and premiums they can trade at. While JRI exhibits a discount through most periods, the discount widened out through 2022. That amplified the downside moves shareholders would have seen on a share price basis, despite its NAV holding up relatively better. The NAV reflects the performance of the underlying portfolio.
One of the biggest drags of performance on the fund was the poor performance from real estate or REITs in 2022. It was one of the bottom-performing sectors as interest rates cut into their attractiveness and competitiveness.
The fund also holds infrastructure exposure through utilities and midstream operations. Those sectors did much better. However, JRI's approach to investing in a hybrid way through fixed-income and preferred holdings meant that their infrastructure exposure is quite interest rate sensitive.
Then you combine this performance with leverage, and the results are once again amplified to the downside. Although, when things are going right, the performance can also be amplified to the upside. With discount contraction, the performance can get another boost through that too.
Since our last update , JRI's discount has narrowed a touch, but even better, the portfolio started doing better as yields started to back off. That allowed JRI to put up a strong performance relative to the S&P 500. While the S&P 500 isn't an appropriate benchmark, it can give us some context of the fund's latest moves.
JRI Returns Since Previous Update (Seeking Alpha)
Today, the discount remains attractive, and at least at this point, REITs seem to be clawing back some of their declines. With the Fed closer to ending interest rate hikes for a pause, we could see things stabilize further from here. Of course, the next worry will be what damage could be done by a recession. That isn't something to ignore, but with the discount and some of the declines already priced in, I think there is a good chance of strong performance going forward. I think that REITs are one of the places investors could put capital to work due to many attractive valuations in the space.
The Basics
- 1-Year Z-score: -0.52
- Discount: -12.59%
- Distribution Yield: 9.26%
- Expense Ratio: 1.87%
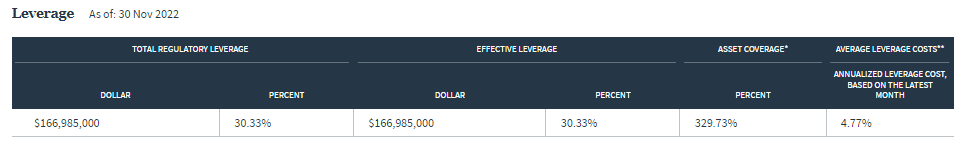
- Leverage: 30.33%
- Managed Assets: $550.6 million
- Structure: Perpetual
JRI seeks "to deliver a high level of current income and long-term capital appreciation by investing in real asset-related companies across the world and the capital structure, including common stocks, preferred securities, and debt." They define real asset-related companies as "those engaged in owning, operating, or developing infrastructure projects, facilities, and services, as well as REITs."
Further, they invest "up to 40% of its assets may be debt securities, all of which may be rated below investment grade, though no more than 10% of its assets may be invested in securities rated CCC+/Caa1 or lower at any time. Non-U.S. exposure represents 25% to 75% of the Fund's managed assets."
Leverage And Hedging Discussion
One of the points I always bring up for JRI is their high utilization of leverage. It often leads to deleveraging over time and generally permanent damage to the fund. That doesn't mean that there can't be positive results, or I wouldn't be interested in this fund in the first place. However, it does continue to be a theme with this fund. 2022 was no different. The fund went from around $198 million in borrowings at the beginning of 2022 to now $167 million.
With increasing interest rates, JRI's leverage costs are rising. Some of this is offset by the reduction in overall leverage, but that means their net investment income is getting hit from both ends. Reducing assets that are invested means less total investment income coming in; rising costs on leverage that is left mean more expenses being taken out of that reduced total investment income. The end result is declining net investment income for shareholders. That's the income that is utilized for the payout of the distributions to investors. That's why we've seen the total expense ratio jump up to 2.91% from 2.10% at the end of June 30th, 2022.
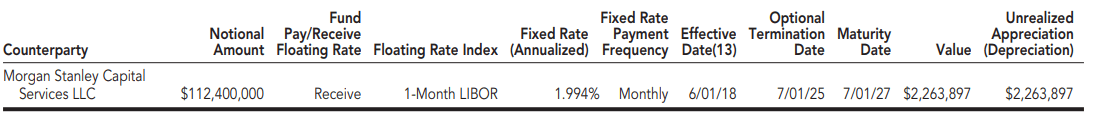
However, the good news here is that JRI hedged against this partially with interest rate swaps. That means what they've paid extra for in leverage costs was recouped through capital gains.
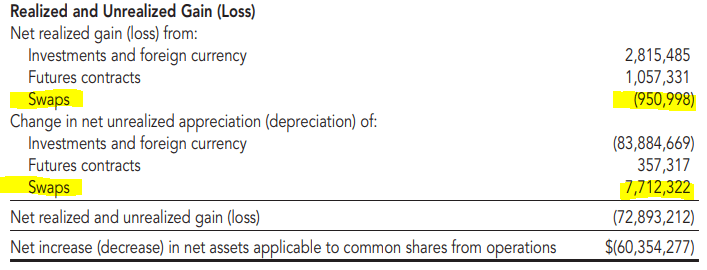
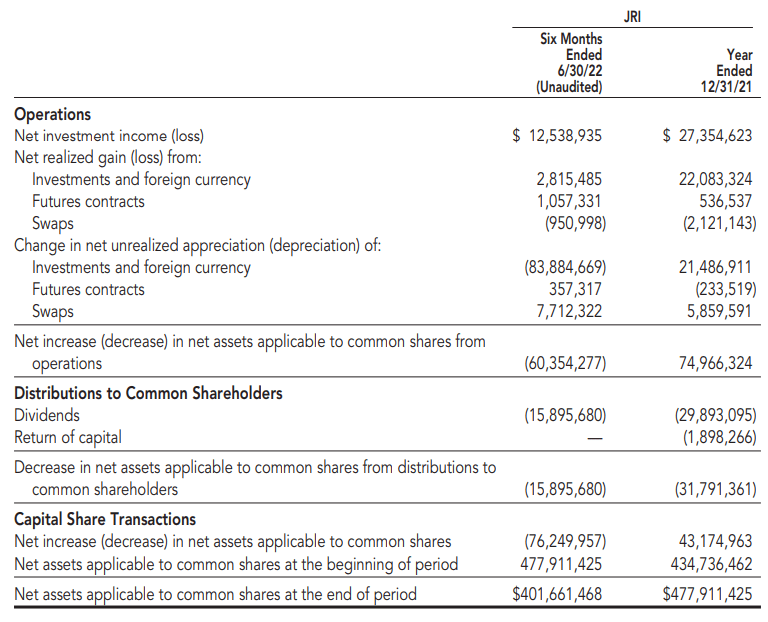
They've also incorporated futures contracts also to hedge against higher interest rates. That is done by going short on U.S. Treasury debt. As interest rates rise, these futures will appreciate. At the end of their last semi-annual report, we see that most of the swaps sat in unrealized appreciation and were not realized. On the other hand, we see that they took in some realized gains and unrealized gains from their futures contracts. We will get their next annual report in a couple of months, which will tell us how they did overall through the entire year.
JRI Realized/Unrealized Gains/Losses (Nuveen (highlights from author))
RA Investors Could Consider A Swap
There were plenty of funds that didn't hedge their leverage, which ended up making them perform relatively weaker. So at the very least, JRI's management team should get some credit for that. That still didn't mean we saw positive results from the fund for 2022, as the fund struggled along with most assets.
Due to their unique approach of investing in a basket of real assets split between utilities, energy infrastructure and real estate - as well as fixed-income and equity weightings, there aren't many peers to compare to. One of the closest comes from Brookfield Real Assets Income Fund ( RA ). They, too, invest in the infrastructure and real estate spaces, with exposure across asset classes.
For 2022 specifically, RA did edge out JRI on both a total share price and a total NAV performance basis.
Ycharts
Over the longer term, it has been a bit of a different story. RA had handily outperformed on a total share price basis. However, these two funds haven't strayed too far away on a total NAV return basis. There are periods where JRI has outperformed and vice versa. The performance ends up being quite close, but RA has a slight edge against JRI, where performance diverged slightly in the last couple of months.
Ycharts
Where JRI becomes clearly a better buy relative to RA is in valuation. As RA's total share price return has outperformed to such a large degree, it has only come through a significant divergence in the funds' discounts and premiums. RA has jumped to a premium, while JRI remains highly discounted.
That isn't to say that RA isn't or can't be a good investment, but if valuation drives your investing, there is a clear choice to be made here. And that would be to sell RA and buy JRI. If you were looking at putting new capital to work in this space and thought RA was a good place, you should at least seriously consider JRI instead.
Ycharts
Is JRI's Distribution Sustainable?
Investing in a CEF means you are naturally looking for income. There are only a select few funds that don't offer regular distributions to investors. Suffice it to say the question of is the distribution sustainable is a big factor worth exploring.
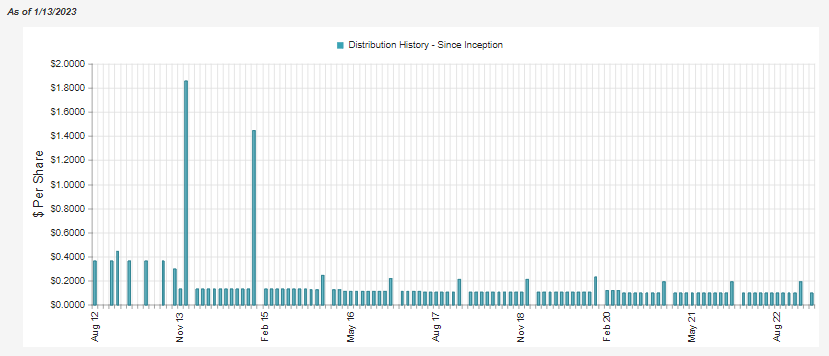
On the surface, we can see that the distribution rate comes to 9.26%; the NAV distribution yield comes to 8.10%. Around an 8% NAV rate isn't generally a concern. However, over time the fund has a history of trimming slowly. It's so slow that it's a bit hard to visualize. They also initiated a quarterly distribution before going monthly.
This once again goes back to their slow deleveraging over time, though. As assets get whittled away, the income generation and capital gains potential are also slowly whittled away. As we highlighted in the above discussion, that doesn't mean performance can't be positive - we have seen a positive performance from the fund nonetheless.
So while the fund's NAV rate isn't too high, they certainly don't show the best long-term track record for consistency. Unfortunately, with more of the same in 2022 of deleveraging and now rising interest rates (although being hedged for now,) the ultimate trajectory of slowly declining distributions is likely to remain.
The latest report showed NII declined if we annualized out the last six-month figure by 8.32%.
JRI's leverage cos is 1-month LIBOR plus 0.70%. That puts the latest interest rate cost at 4.43% plus 0.70% or 5.13% total. Against $167 million in borrowings, as of the latest data, we are looking at interest rate costs escalating to $8.567 million.
Annualizing out the leverage costs from the last report would give us a $2.366 run rate. Ultimately meaning we would see an additional increase of $6.201 million, which would directly reduce NII and the ability of the fund to pay its distributions.
Rates are only set to go even higher as the Fed has a couple more raises left in them. This is why it is so important for their hedges to work out, as that would be a large hit to the fund. As we saw above, the fund had significant unrealized depreciation reported setting the total decline in net assets down to $60.354 million overall.
In the future, they will rely on capital gains further to cover their distribution. It is certainly a possibility that we will get some recovery in the overall market and, more specifically, if real estate can perform better.
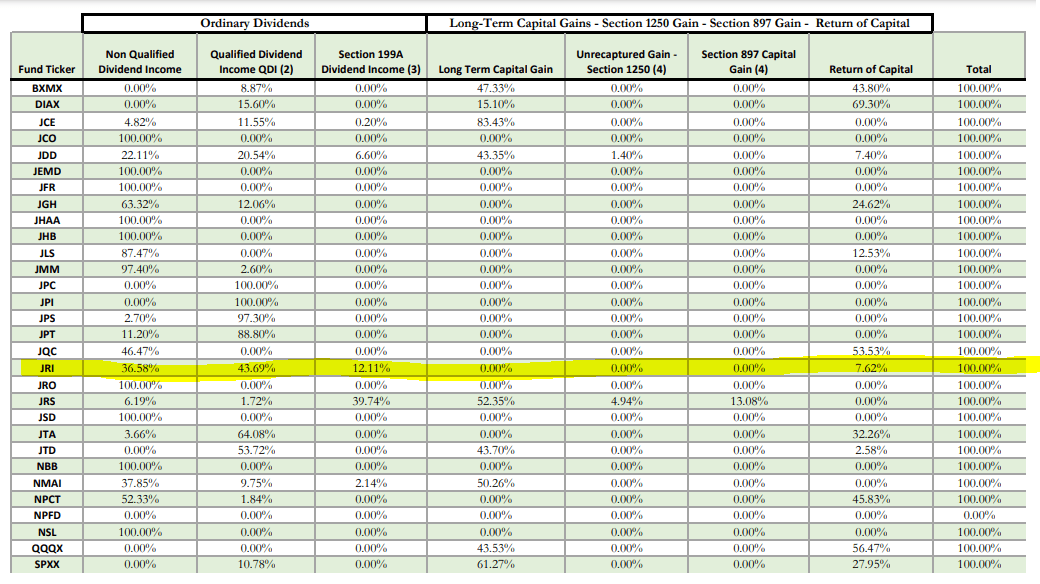
In February, we should get a breakdown of the tax character of their distribution for 2022. However, for the 2021 tax classifications, we can see that the majority of the distribution was considered qualified dividends. There was then a sizeable allocation to non-qualified dividend income and section 199A dividend income. There was a smaller portion identified as return of capital. For 2021, that ROC was not considered destructive as income and capital gains together were enough to cover the distributions paid to shareholders.
JRI's Portfolio
The turnover in this fund is quite elevated, meaning there can be a lot of changes going on under the surface. The semi-annual report put the turnover rate at 35%. In the prior fiscal year, it came in at 73%. So we could essentially see just about the same for 2022 if they carried on at the same pace through the remaining six months. However, in prior years turnover was much higher - pushing to 100% in other years.
While that is the case, on the other hand, the portfolio's overall allocation doesn't seem to change drastically between our updates. Here's for the end of November, but when we looked at the portfolio at the end of August 2022, real estate was at 25.2%, infrastructure common was at 23%, infrastructure preferred was at 19.9%, and infrastructure debt was 13.3%. Since then, we see only mild gyrations that divergences could have been influenced by the market performance of the underlying assets even without management intervention.
JRI Asset Allocation (Nuveen)
Breaking the portfolio down to a more granular level of sector allocation underneath the asset allocation and we start to see some shifting. For one, pipeline exposure is now the largest of the portfolio when it had been in second place at 16.5%. Electric utilities might have fallen to a second-place weighting for the fund, but it actually still increased its exposure from the 16.5% listed previously.
In this case, industrial was one of the decliners, but also office exposure has been completely removed from the top exposure list. Instead of an office, we now see cash and equivalents making their way toward the top allocation of the portfolio. However, cash is generally a temporary place that could have already been put to work. Seeing the office industry removed as a larger fund allocation certainly doesn't break my heart.
JRI Sector Allocation (Nuveen)
One thing about JRI's approach to investing in a diverse portfolio is the fund's relatively large number of holdings. In total, they listed that they carried 481 names. That diversification is also reflected in the fund's top holdings, with the top ten making up around 17% of the portfolio.
JRI Top Ten Holdings (Nuveen)
Enbridge ( ENB ) is a significant position for the fund; this was the case previously as well. The next spot belongs to another energy infrastructure peer: The Williams Cos. ( WMB ).
Among these, we have utility plays NextEra Energy ( NEE ) and The Southern Co. ( SO ). NEE is almost a staple in any infrastructure or utility fund; it consistently makes its way to a top allocation. However, SO is a relatively new position, at least in terms of being in the top ten for the fund. Previously, the fund had held DTE Energy ( DTE ) in a top spot.
The REIT names we show up as top positions are Kimco Realty ( KIM ) and Public Storage ( PSA ); these were also previously top holdings. KIM operates in the shopping center space and appears to be attractively priced. They've also recently converted to an UPREIT structure . They also promote that they are anchored by grocery stores, which means they should see relatively stronger traffic.
Conclusion
JRI is an attractively priced fund. There are certainly headwinds to consider, but a good portion of this should be priced in due to the fund's sizeable discount and beaten-down REIT exposure. That could see the fund performing better going forward than what we saw in the last year. More recent signs show that it could be showing some life with stronger relative results compared to the broader market.
For further details see:
JRI: Real Assets At An Attractive Discount