NEX - July MDA Breakout Stocks Week 27 - 2023: High-Frequency Gainers To Give You An Edge
2023-07-03 12:23:19 ET
Summary
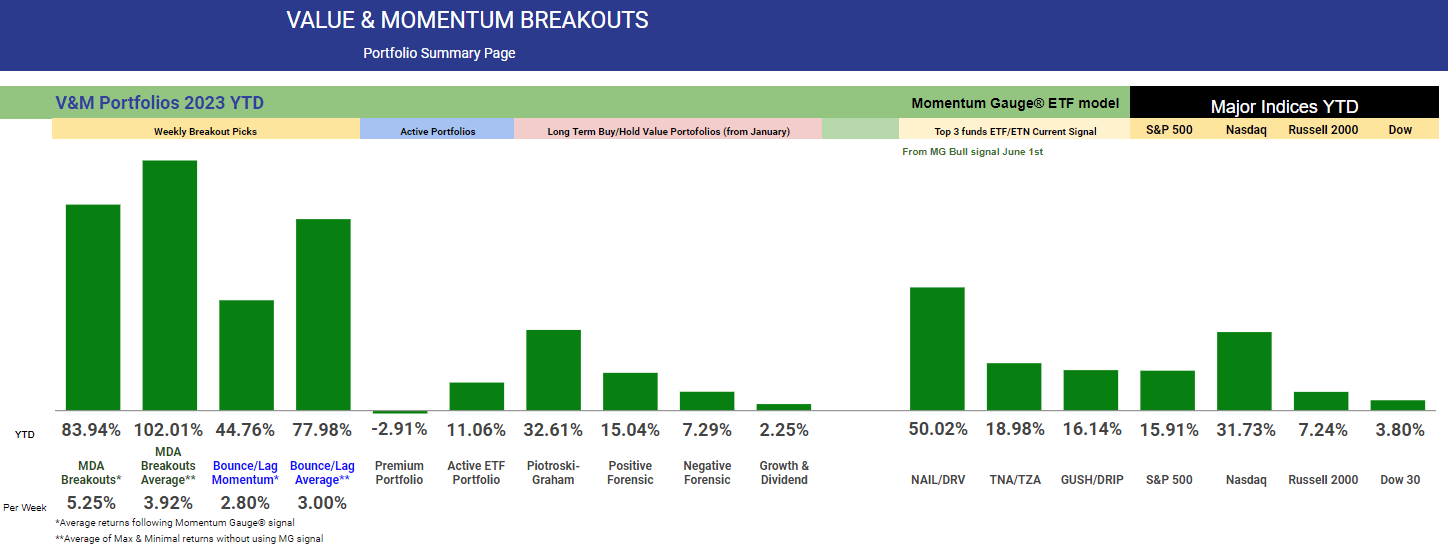
- Two new sample Breakout Stocks for Week 27 with better than 10% short-term upside and a Dow 30 Picks. Average cumulative returns for 2023 are up to +102.0% YTD.
- Last week, neither the MDA nor Bounce/Lag models had any 10% peak gainers. The strong start to RIG +7.8% on Friday for members may end the drought.
- The streak of weekly picks gaining over 10% in less than a week has reached 252 out of 318 trading weeks (79.2%) not considering multiple gainers or negative signals.
- Annual returns are simulated by adding 52 weekly selections, though they could be compounded weekly. Since inception, over 450 stock picks have gained over 10% in less than a week.
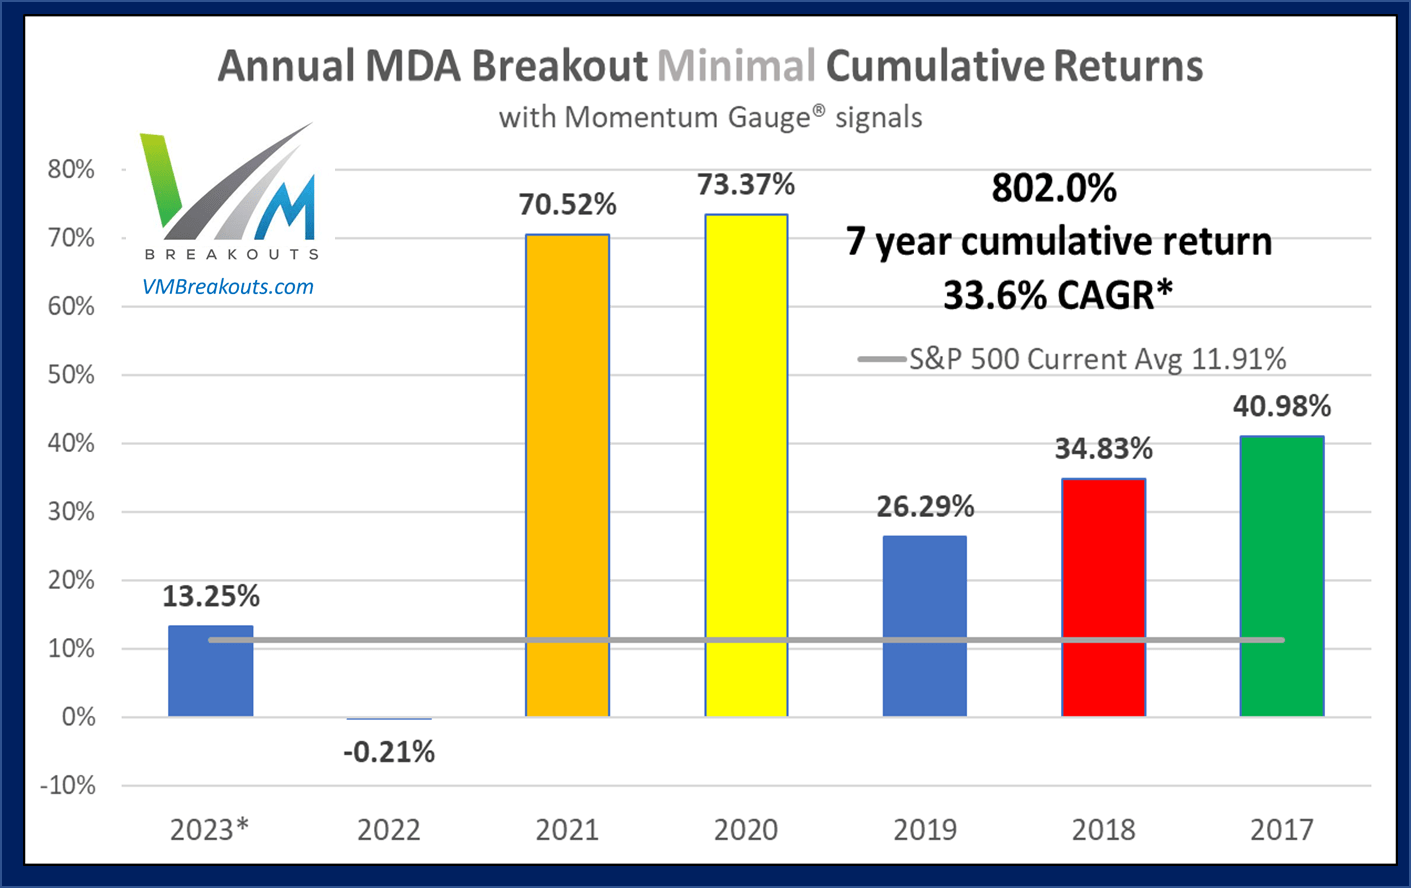
- The MDA breakout picks continue to beat the S&P 500 into 7 consecutive years now delivering +802.0% compound returns through 2023 and a CAGR +33.6%.
Introduction
For readers who want to skip the details, avoid market updates, bypass the Momentum Gauge charts, and ignore additional stock and exchange-traded fund ("ETF") ideas along with the MDA strategies spanning more than a decade of research, here are the sample MDA Breakout picks for next week:
Dow picks :
- Cisco Systems ( CSCO ).
For the rest of you this article addresses more than seven years of questions, links to trading strategies, years of measurement results, and gives additional investing opportunities to consider this year. If you would like immediate notification as to when my new articles are published, please hit the button at the bottom of the page to "Follow" me.
Warning: All of the published results are only possible for members. The entire portfolio of stocks are measured from actual release on Friday morning to Friday close. Only sample stocks are released publicly and with significant delay.
Overview
The Weekly Breakout Forecast continues my doctoral research analysis on MDA breakout selections since 2013. This high frequency breakout subset of the different portfolios I regularly analyze has now exceeded 300 weeks of public selections as part of this ongoing live forward-testing research. The frequency of 10%+ returns in a week is averaging over 4x the broad market averages in the past 6+ years.
In 2017, the sample size began with 12 stocks, then 8 stocks in 2018, and at members' request since 2020, I now generate only 4 selections each week. In addition 2 Dow 30 picks are provided using the MDA methodology, but I highly recommend the monthly Growth & Dividend mega cap breakout portfolios if you are looking for larger cap selections beyond only 30 Dow stocks.
As long term investors know , you can compound $10,000 into $1 million with 10% annual returns in less than 50 years. This model serves to increase the rate of 10% breakouts into 52 weekly intervals instead of years. In 2022, the worst market since 2008: 113 MDA picks gained over 5%, 52 picks over 10%, 22 picks over 15%, and 13 picks over 20% in less than week.
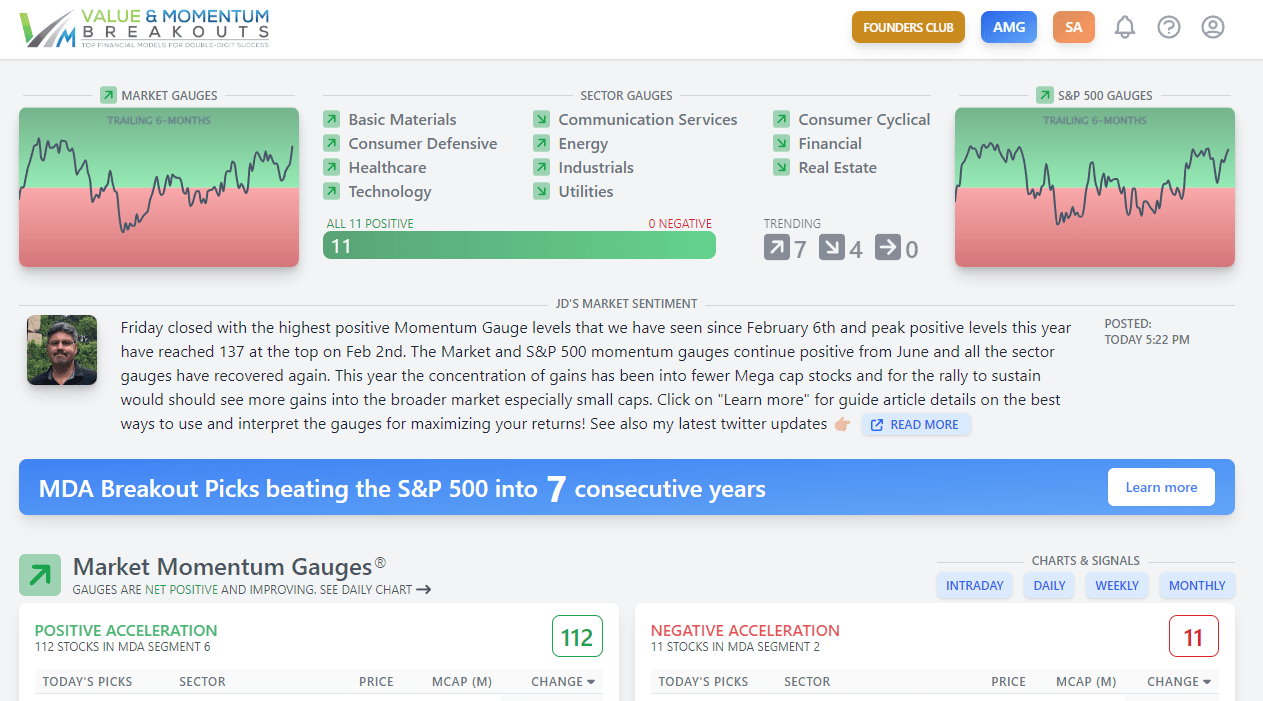
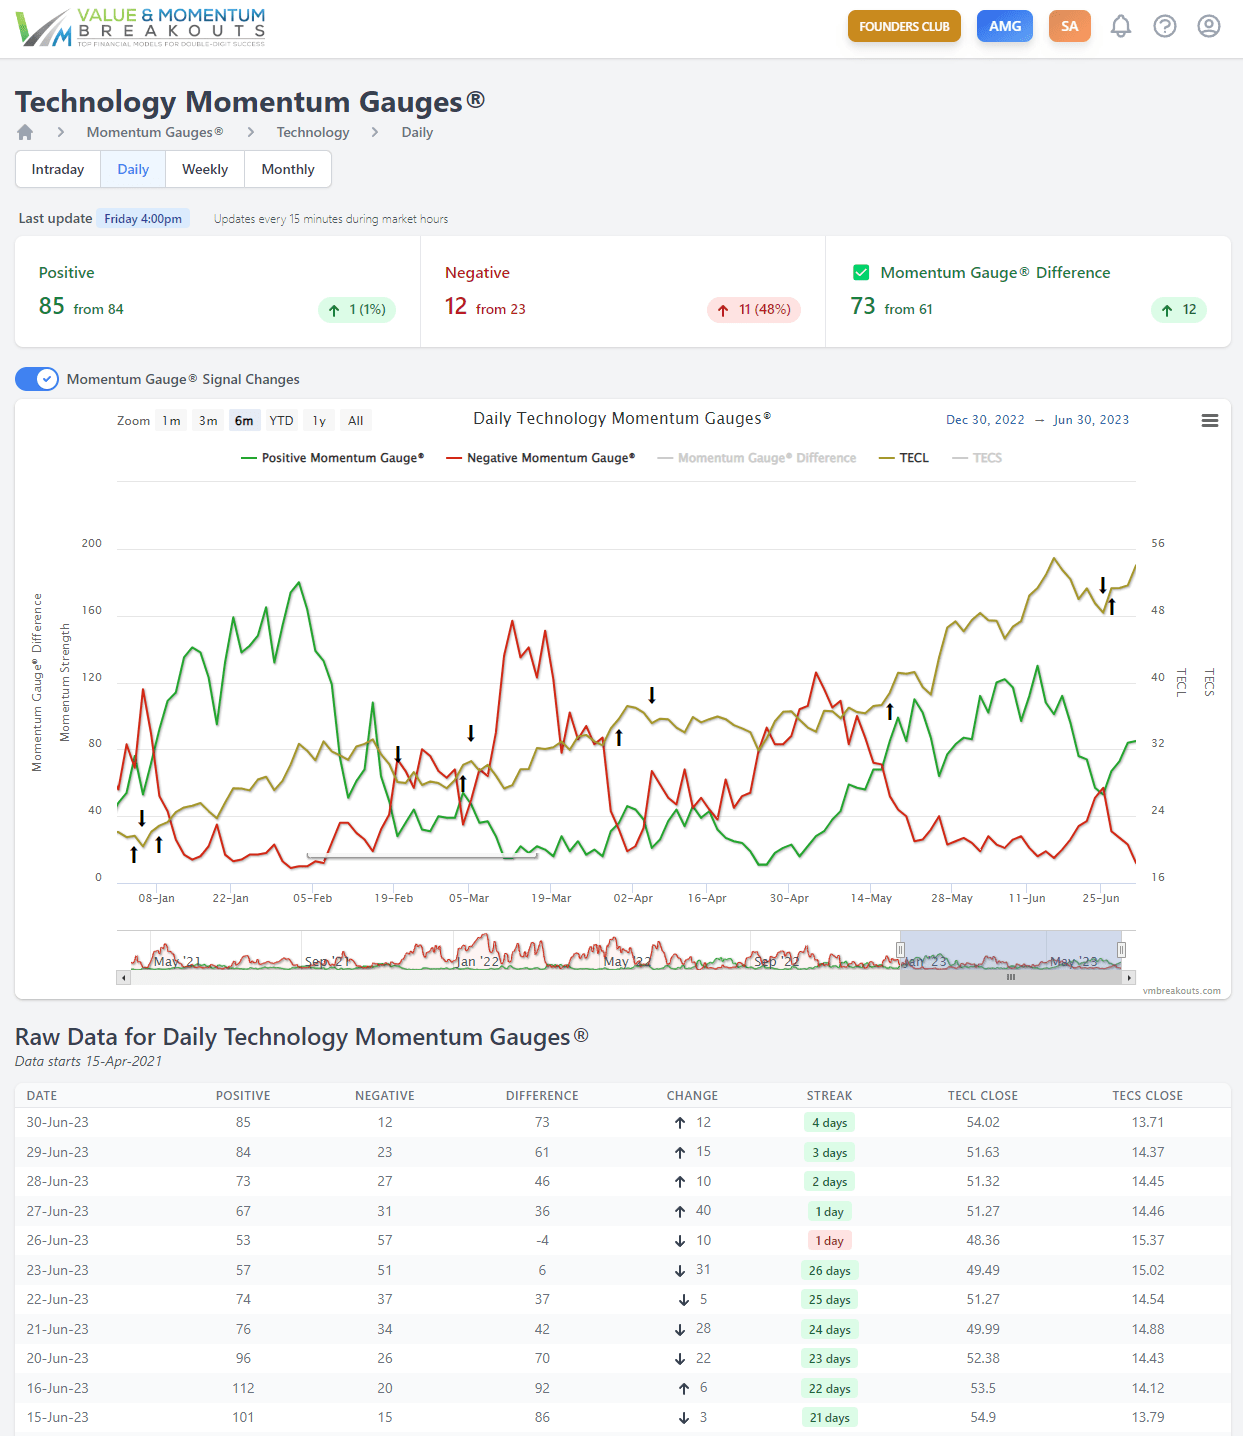
Momentum Gauges Dashboard for Week 27
All the sectors have turned positive again and the positive signal from June 1st continues despite an early negative test signal on June 21st that had more than a week of declines. Historically, July is the 2nd best month of the year on average for the S&P 500 since 1927.
- Guide: Maximizing Market Returns With The Automated Momentum Gauges
- Strategies: How to Trade for Maximum Returns .
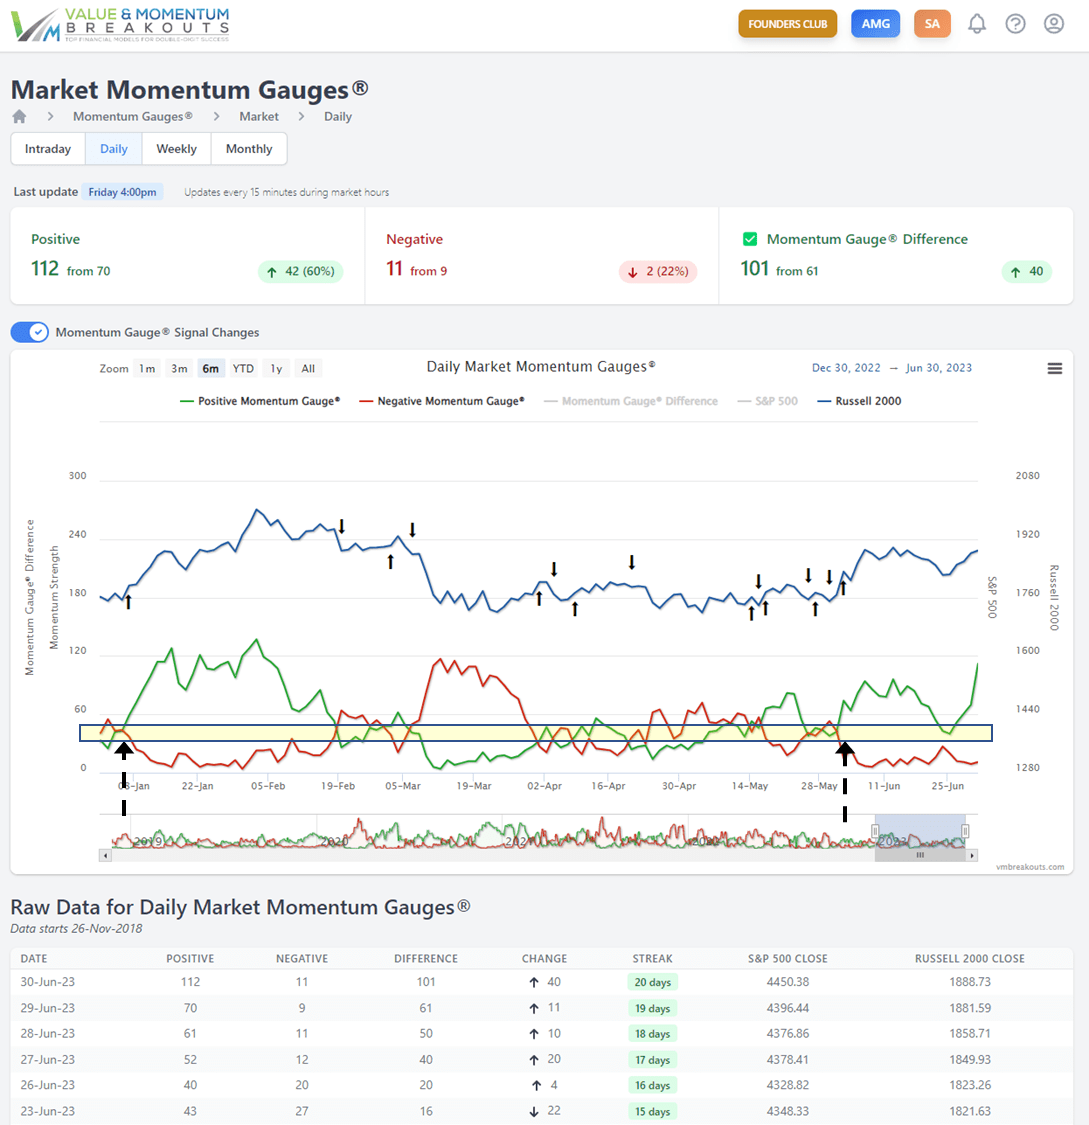
Until this past Friday, the June rally shown below was the strongest positive Momentum Gauge signal we have had since the January breakout. Currently the gauges exploded higher with broad small cap participation to the highest levels since the start of the year at 112 positive. This could be part of the large inflows to the Russell small cap index following the annual reconstitution of the index on June 23rd.
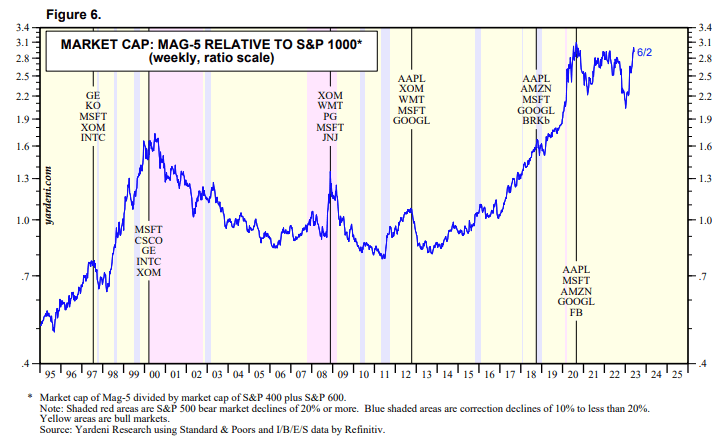
Watch the Mega caps closely! If they breakdown again the market will breakdown sharply. The largest 5 mega cap stocks are testing the peak levels back to 2020 and for 2022 highs relative to the rest of the S&P 1000 stocks. You can see exactly how these 5 mega cap stocks have contributed to the largest VIX volatility swings in alternating years:
To borrow a chart from one of our members:
MoneySauce
Mega caps are in wide divergence from the rest of the market in the most unusual year I have ever seen with enormous gains extremely concentrated in a few mega cap stocks.
Why do finance companies admit that "timing is everything," but when it comes to investing your money the majority tell their clients to "just buy/hold and try to ignore the downturns?" I submit most investors would rely on timing signals, but without a model like the gauges they are forced to try to keep their clients in buy/hold positions for 24 months with no gains, or worse.
If timing helps you gain just 1% a week, you will significantly outperform all the long term market averages.
Long time members know, we can consistently beat the markets by avoiding the most negative weeks and loading up during the most positive signals. Only the financial industry has incentives to make you to stay in the markets year round.
2023 Market Outlook
The Fed has finally paused after delivering 10 consecutive rate hike in the fastest series of increases since 1977. Historically such high rates have led to a market correction after every rate hiking cycle in U.S. history. Also we still have the largest QT program in history ongoing to reduce the Fed's balance sheet at the fastest rate ever conducted with target levels of -$95 billion per month. My latest outlook articles are here:
- Momentum Mojo: Alternating Segment Breakouts Favor Oversold Value And Small Caps
- Momentum Memo: Biggest Shift Into Lagging Value Sectors In Friday Breakout .
My strategy for 2023 is to stay generally bearish while adjusting for large bear bounces in anticipation of strong similarities to the August 2022 topping pattern. Economic data, inflation, inverted yield curves, manufacturing declines, home sale declines, and the latest banking crisis in March continue to show recessionary weakness into rising interest rate hikes at the highest levels since Sep 2007.
Some of my forecast articles for 2023 are here for your benefit.
- Forecasting The S&P 500 For 2023: Year Of The Fed-Pivot And More Record Volatility ( SP500 )
- My Response To The SA Roundtable: 2023 Technical Analysis / Quantitative Look Ahead .
Weekly Breakout Returns
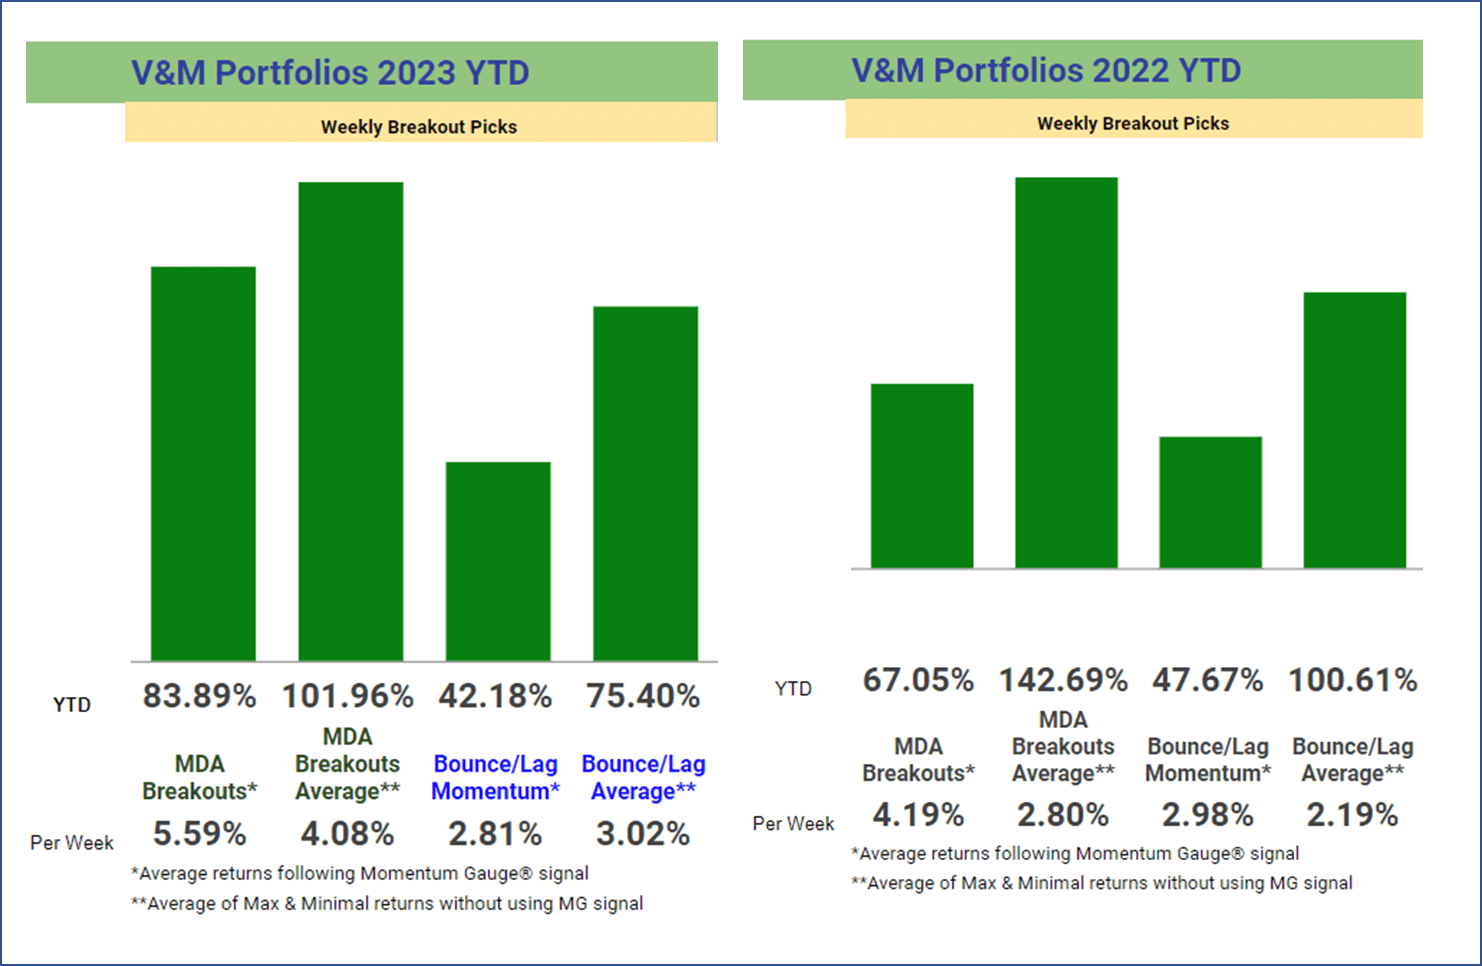
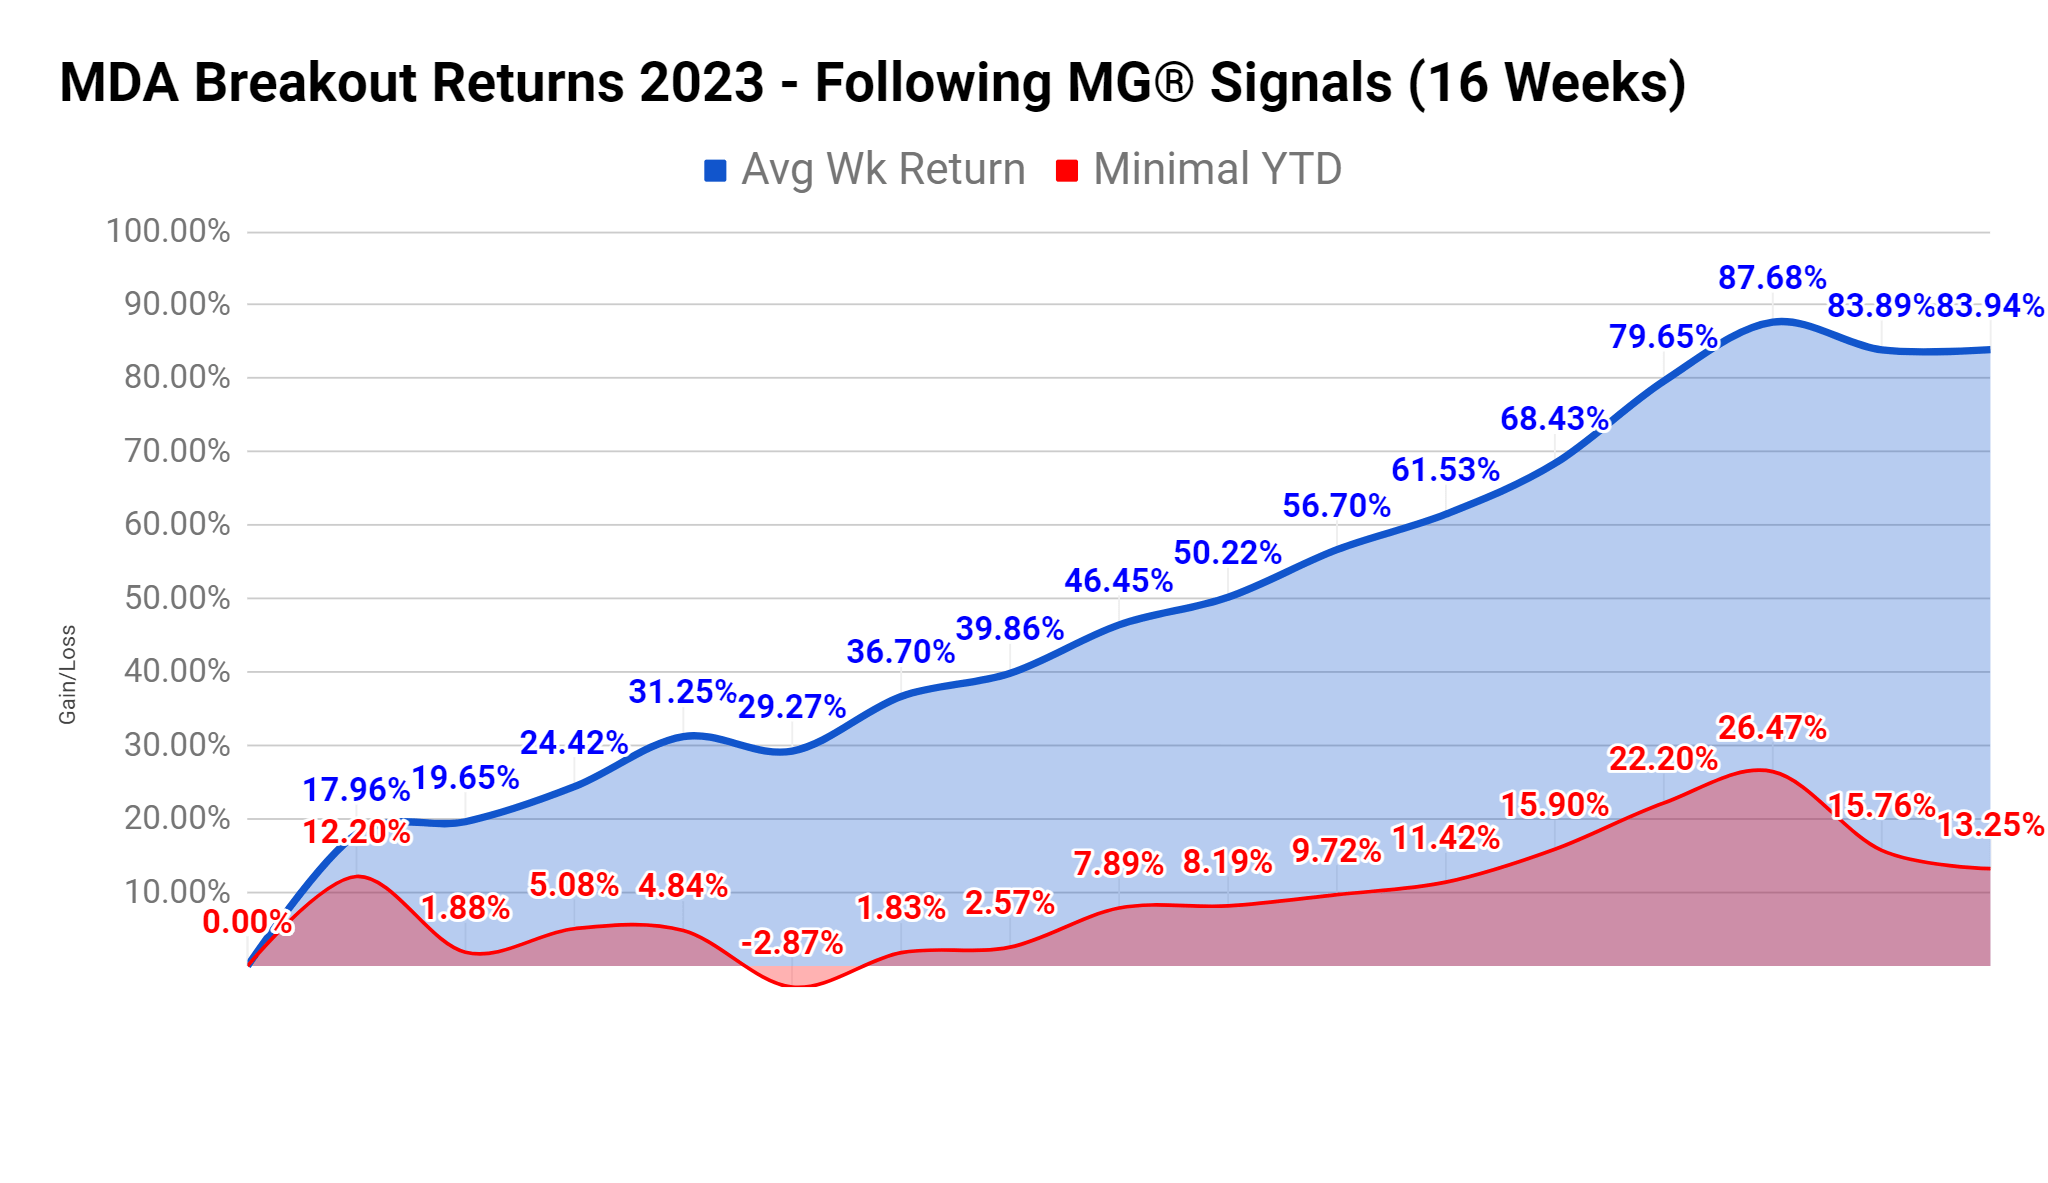
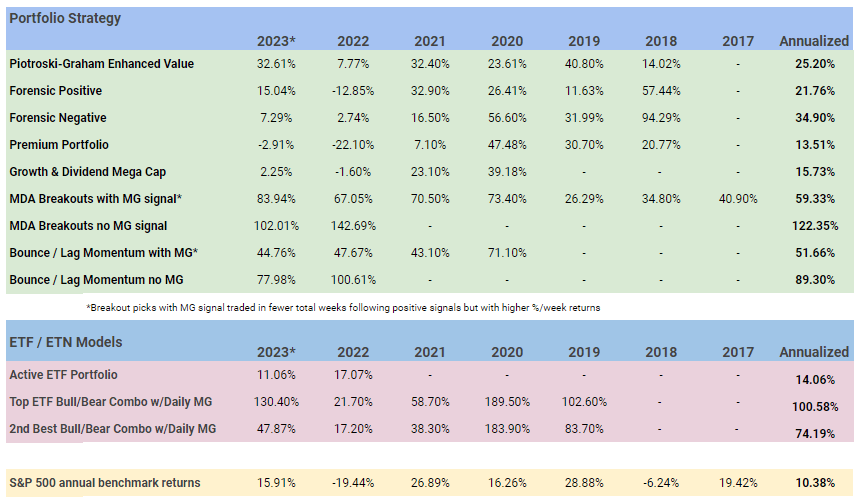
The ongoing competition between the Bounce/Lag Momentum model (from Prof Grant Henning, PhD Statistics) and MDA Breakout picks (from JD Henning, PhD Finance) are shown below with / without using the Momentum Gauge trading signal. The per-week returns equalize the comparison where there were only 16 positive trading weeks last year using the MDA trading signal (negative values below 40). Both models are outperforming last year's weekly returns.
For 2022, the worst market since 2008: 113 MDA picks gained over 5%, 52 picks over 10%, 22 picks over 15%, and 13 picks over 20% in less than week . These are statistically significant high frequency breakout results despite many shortened holiday weeks.
Following only positive Momentum Gauge signals for 2023, the MDA Breakout picks are up +83.9% average cumulative return with a worst case minimal return +13.25% in 16 weeks.
V&M Multi-bagger List
While not the purpose of my model, longer term (using the trading video in FAQ #20) many of these selections may join the V&M Multibagger list now at 144 weekly picks with over 100%+ gains, 64 picks over 200%+, 20 picks over 500%+ and 6 weekly picks with over 1000%+ gains since January 2019 such as:
- Celsius Holdings ( CELH ) +3,074.2%
- Alexco Resources AXU +1,311.7%
- Enphase Energy ( ENPH ) +1,110.9%
- Trillium Therapeutics TRIL +1,008.7%.
More than 450 stocks have gained over 10% in less than a week since this MDA testing began in 2017. Frequency comparison charts are at the end of this article. Readers are cautioned that these are highly volatile stocks that may not be appropriate for achieving your long term investment goals: How to Achieve Optimal Asset Allocation .
Historical Performance Measurements
Historical MDA Breakout minimal buy/hold (worst case) returns have a compound average growth rate of 33.6% and cumulative minimum returns of +802.0% from 2017. 2023 still represents a partial year. Last year the minimal cumulative returns for 2022 were -0.21%, average cumulative returns were +67.05%, and the best case cumulative returns were +360.25%. The chart reflects the most conservative measurements adding each 52 weekly return in an annual portfolio simulation, though each weekly result could be compounded weekly as separate portfolios.
The Week 27 - 2023 Breakout Stocks for next week are:
The picks for next week consist of 1 Healthcare and 3 Energy sector stocks. These selections are released in advance to members every Friday with current gains shown. It is not possible to duplicate published returns without member access to their exclusive Friday morning release. Prior selections may be doing well, but for research purposes I deliberately do not duplicate selections from the prior week. These selections are based on MDA characteristics from my research, including strong money flows, positive sentiment, and strong fundamentals -- readers are cautioned to follow the Momentum Gauges for the best results.
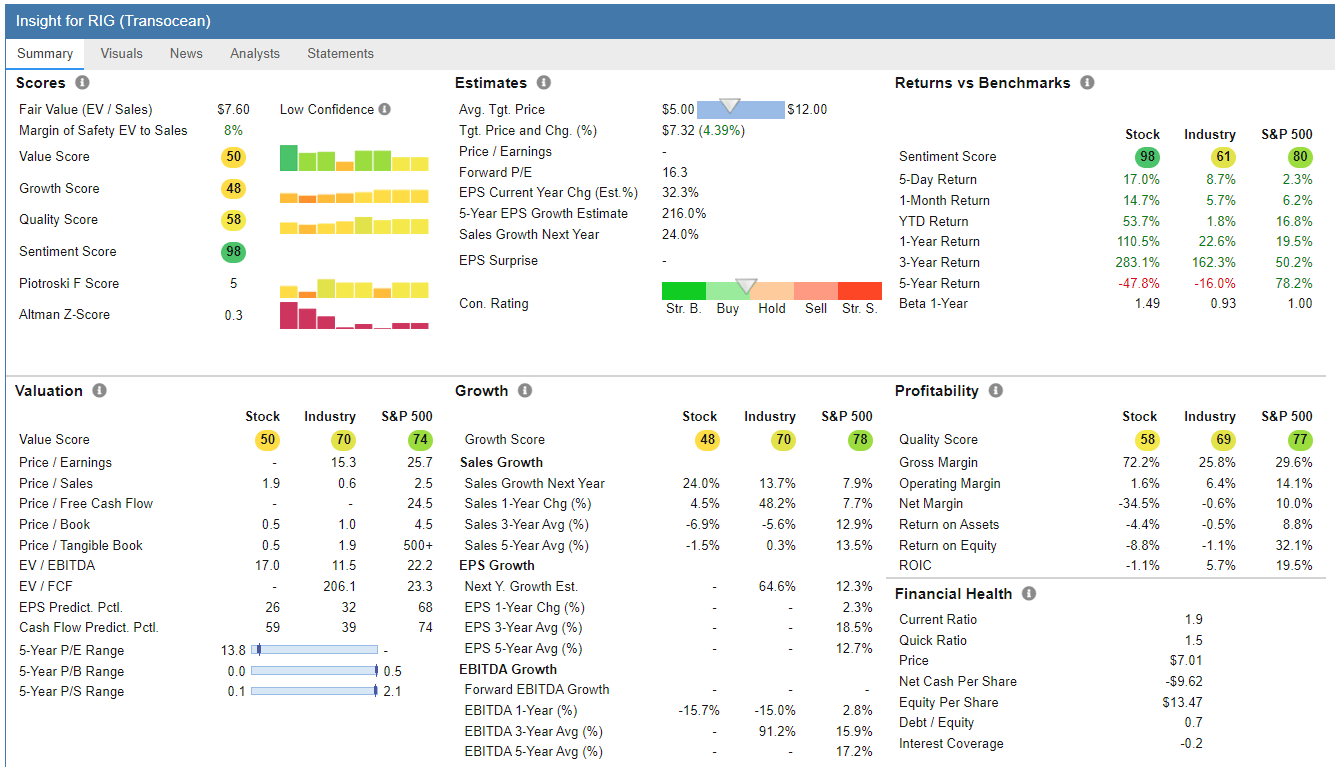
- Transocean LTD (RIG) - Energy / Oil & Gas Drilling
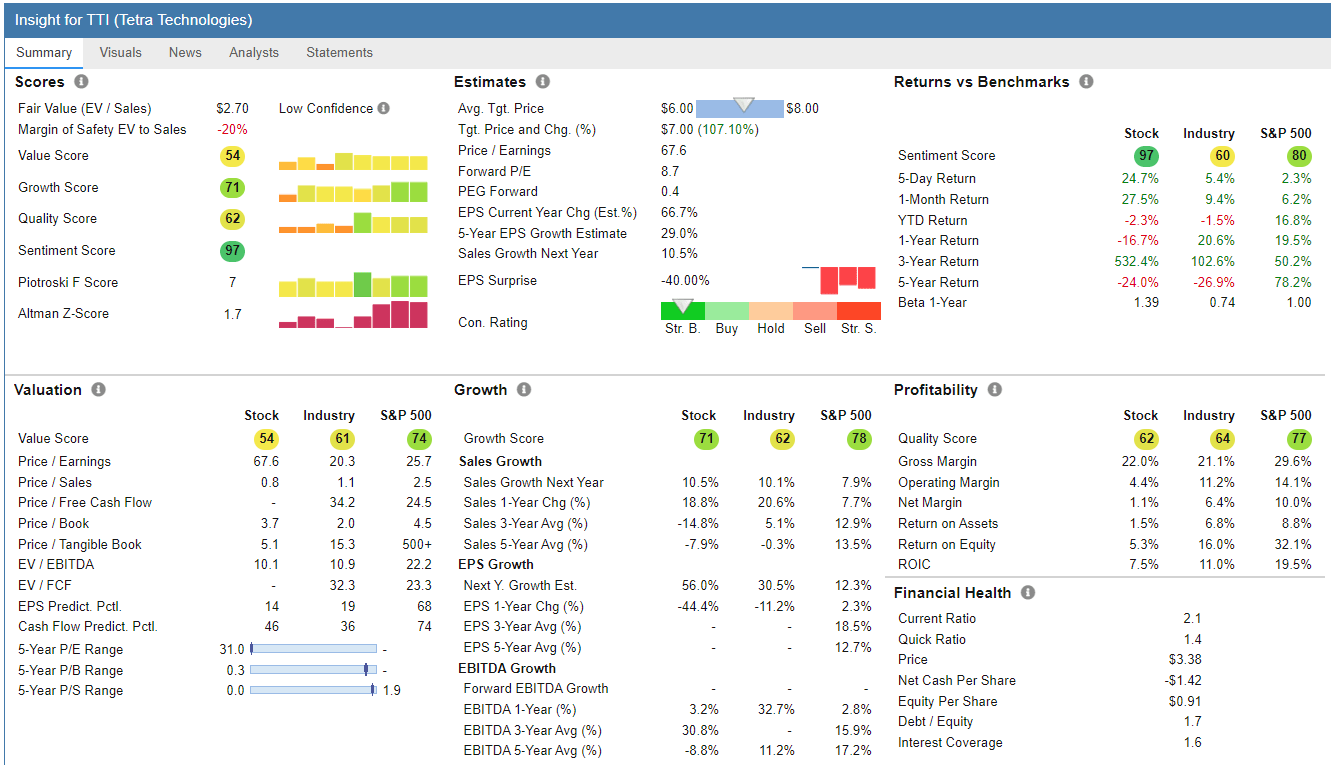
- TETRA Technologies (TTI) - Energy / Oil & Gas Equipment & Services.
Transocean LTD (RIG) - Energy / Oil & Gas Drilling
FinViz.com
Price Target: $8/share (Analyst Consensus + Technical See my FAQ #20)
| Jun-29-23 08:43AM |
| Transocean ( RIG ) Announces $184 Million Addition to Backlog Zacks +5.77% |
| Jun-28-23 05:22PM |
| Transocean Ltd. Announces $184 Million Award for Harsh Environment Semisubmersible GlobeNewswire |
| Jun-27-23 09:00AM |
| How to Boost Your Portfolio with Top Oils-Energy Stocks Set to Beat Earnings Zacks |
| Jun-26-23 09:26AM |
| These Drilling Stocks Could Be Gushers as the Oil Industry Rebounds Barrons.com |
| Jun-25-23 01:32PM |
| 7 Oil Stocks to Sell as Demand Peaks and Interest in EVs Grows InvestorPlace |
(Source: Company Resources.)
Transocean Ltd., together with its subsidiaries, provides offshore contract drilling services for oil and gas wells worldwide. It contracts its mobile offshore drilling rigs, related equipment, and work crews to drill oil and gas wells. It serves integrated energy companies, government-owned or government-controlled energy companies, and other independent energy companies.
TETRA Technologies (TTI) - Energy / Oil & Gas Equipment & Services.
FinViz.com
Price Target: $4/share (Analyst Consensus + Technical See my FAQ #20)
| Jun-28-23 07:23PM |
| Exxon Mobil expands lithium bet with Tetra Technologies deal Reuters |
| 09:32AM |
| Investing in TETRA Technologies ( TTI ) three years ago would have delivered you a 480% gain Simply Wall St. |
| Jun-26-23 07:00AM |
| TETRA TECHNOLOGIES, INC. AND SALTWERX, LLC ENTER INTO A MEMORANDUM OF UNDERSTANDING REGARDING A PROPOSED BRINE PRODUCTION UNIT IN THE SMACKOVER FORMATION PR Newswire +6.64% |
| Jun-16-23 07:31AM |
| NexTier Oilfield Solutions ( NEX ) Moves 6.7% Higher: Will This Strength Last? Zacks |
| Jun-14-23 09:02AM |
| TETRA Technologies, Inc. ( TTI ) is favoured by institutional owners who hold 64% of the company Simply Wall St. |
(Source: Company Resources.)
TETRA Technologies, Inc., together with its subsidiaries, operates as an energy services and solutions company. It operates through two segments, Completion Fluids & Products Division and Water & Flowback Services. The Completion Fluids & Products segment manufactures and markets clear brine fluids, additives, and associated products and services to the oil and gas industry for use in well drilling, completion, and workover operations in the United States, as well as in Latin America, Europe, Asia, the Middle East, and Africa.
Top Dow 30 Stocks to Watch for Week 27
First, be sure to follow the Momentum Gauges® when applying the same MDA breakout model parameters to only 30 stocks on the Dow Index. Second, these selections are made without regard to market cap or the below-average volatility typical of mega-cap stocks that may produce good results relative to other Dow 30 stocks. Third, the 30 Dow stocks are up only +3.80% YTD and continue among the worst performing index YTD as crowding into Tech / Nasdaq continues. The most recent picks of weekly Dow selections in pairs for the last 5 weeks:
| Symbol |
| Company |
| Current % Return from Selection |
| ( PG ) |
| Procter & Gamble |
| +1.03% |
| KO |
| Coca Cola Company |
| -2.67% |
| ( NKE ) |
| Nike Inc |
| -2.38% |
| ( KO ) |
| Coca-Cola Company |
| -2.16% |
| ( AAPL ) |
| Apple Inc. |
| +6.81% |
| ( INTC ) |
| Intel Corp. |
| +5.09% |
| AXP |
| American Express |
| +5.46% |
| ( DOW ) |
| Dow Inc. |
| +6.33% |
| ( AXP ) |
| American Express |
| +12.52% |
| ( IBM ) |
| Intl Business Machines |
| +4.79% |
If you are looking for a much broader selection of large cap breakout stocks, I recommend these long term portfolios with consecutive years of beating the S&P 500 and already achieving double-digit returns. As regular readers know, we broke out of the terrible market chop for June and are moving in the strongest positive signal since January.
Current Long-Term Portfolio returns
The long term buy/hold portfolios Piotroski-Graham, Positive Forensic, and Negative Forensic have all new mid-year portfolios released the end of June and tracked for the next 2-years.
New mid-year 2023 Piotroski-Graham enhanced value -
- January portfolio +32.61% YTD
- 2022 January portfolio beat the S&P 500 by +32.54%.
New mid-year 2023 Positive Forensic -
- January portfolio +15.04% YTD
- January 2022 Positive Forensic beat S&P 500 by +6.59%.
New mid-year 2023 Negative Forensic -
- January portfolio +7.29% YTD
- January 2022 Negative Forensic beat S&P 500 by +22.18%.
New July Growth & Dividend Mega cap breakouts -
- New July mega cap long term portfolio was just released
- January 2022 portfolio beat S&P 500 by +13.91%.
These long term portfolio selections have significantly outperformed many major hedge funds and all the hedge fund averages since inception.
The Dow Pick for Next Week is:
Cisco Systems (CSCO)
Cisco is strong early breakout conditions, testing 52/share resistance with large net MFI inflows. Valuations are high but strong earnings and sales beat May 17th is pushing for a breakout to new 52/week highs along with continuing corporate buybacks.
FinViz.com VMBreakouts.com
Breakout ETF Portfolios
Technology Momentum Gauges show the condition of the technology sector as the highest weighted and largest sector on the major market indices. The rapid profit taking pull back in June has recovered quickly and positive momentum is building again over the last 4 days. Watch for momentum to reach prior June and January highs as July averages the second best month of the year on average since 1927. However the Fed is threatening an 11th rate hike in July.
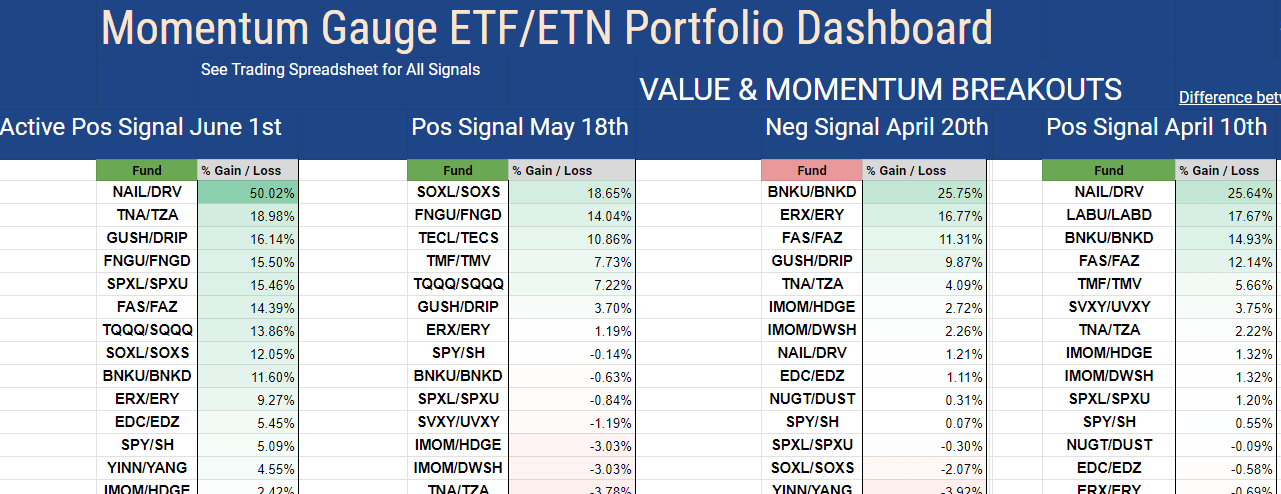
The Active ETF portfolio is up +11.06% and continuing in bull funds after the sharp pull back in June with technology and several sectors. So far I have been overly bearish about the herding into Mega cap Tech stocks and will reluctantly join the crowding effect until the signals turn negative.
The Momentum Gauge ETF Bull/Bear model signal changes are shown below. These are member selected test funds and returns can be improved by following individual sector gauges (not just the broad gauge signal shown below) and gauges specific to each of the different types of funds. Be sure to read the Momentum Gauge guide for best results.
Returns shown here are for signals lasting longer than 3 days.
Background on Momentum Breakout Stocks
As I have documented before from my research over the years, these MDA breakout picks were designed as high frequency gainers.
These documented high frequency gains in less than a week continue into 2020 at rates more than four times higher than the average stock market returns against comparable stocks with a minimum $2/share and $100 million market cap. The enhanced gains from further MDA research in 2020 are both larger and more frequent than in previous years in every category. ~ The 2020 MDA Breakout Report Card .
The frequency percentages remain very similar to returns documented here on Seeking Alpha since 2017 and at rates that greatly exceed the gains of market returns by 2x and as much as 5x in the case of 5% gains.
VMBreakouts.com
The 2021 and 2020 breakout percentages with 4 stocks selected each week.
MDA selections are restricted to stocks above $2/share, $100M market cap, and greater than 100k avg daily volume. Penny stocks well below these minimum levels have been shown to benefit greatly from the model but introduce much more risk and may be distorted by inflows from readers selecting the same micro-cap stocks.
Conclusion
If you would like notifications as to when my new articles are published, please hit the button at the bottom of the page to "Follow" me. These stocks continue the live forward-testing of the breakout selection algorithms from my doctoral research with continuous enhancements over prior years. These Weekly Breakout picks consist of the shortest duration picks of seven quantitative models I publish from top financial research that also include one-year buy/hold value stocks.
All the V&M portfolio models beat the market indices again last year with consistent outperformance of the major indices since 2017. All new portfolios are in a strong start to 2023 with many portfolios already in double-digit returns. Remember to follow the Momentum Gauges® in your investing decisions for the best results. YTD returns do not show the peak gains following the signals.
All the very best to you, stay safe and healthy and have a great week of trading!
JD Henning, PhD, MBA, CFE, CAMS.
For further details see:
July MDA Breakout Stocks Week 27 - 2023: High-Frequency Gainers To Give You An Edge