TRIN - KBWD: 10% Yield With 4 Red Flags
Summary
- KBWD is a high-yield ETF in financials.
- Mortgage REITs weigh 44% of asset value.
- Since inception, it has lost about 30% in share price.
- In 10 years, distributions have shrunk by 20%.
- Bonus: How to manage capital decay in high yield securities.
This dividend ETF article series aims at evaluating products regarding the relative past performance of their strategies and quality of their current portfolios. As holdings and their weights change over time, reviews may be updated when necessary.
KBWD strategy and portfolio
The Invesco KBW High Dividend Yield Financial ETF ( KBWD ) tracks the KBW Nasdaq Financial Sector Dividend Yield Index. It started investing operations on 12/02/2010, has 42 holdings and a 12-month distribution yield of 10 %. Distributions are paid monthly. Management fees are 0.35%, but the total expense ratio including holding expenses is 3.84%. This is a first red flag.
As described in the prospectus by Invesco , the underlying index “ is a modified-dividend yield-weighted index of companies principally engaged in the business of providing financial services and products (…) which may include business development companies and real estate investment trusts ”.
The fund is mostly in small cap companies (over 90% of asset value). As of writing, the heaviest industry in the portfolio is mortgage REITs (44%). The next table lists the top ten holdings with their weights and dividend yields. The portfolio is quite concentrated: their aggregate weight is about 38%. However, risks related to individual stocks is moderate: maximum exposure to a single constituent is 5%.
| Ticker |
| Name |
| Weight% |
| Yield% |
| ARMOUR Residential REIT, Inc. |
| 5.00 |
| 19.74 |
| Orchid Island Capital, Inc. |
| 4.49 |
| 16.48 |
| Two Harbors Investment Corp. |
| 4.06 |
| 14.17 |
| AGNC Investment Corp. |
| 3.88 |
| 12.69 |
| Annaly Capital Management, Inc. |
| 3.85 |
| 16.25 |
| MFA Financial, Inc. |
| 3.71 |
| 12.58 |
| NewtekOne, Inc. |
| 3.43 |
| 14.41 |
| TPG RE Finance Trust, Inc. |
| 3.39 |
| 11.74 |
| Trinity Capital, Inc. |
| 3.36 |
| 13.94 |
| Chimera Investment Corp. |
| 3.21 |
| 13.31 |
Performance
Since inception in December 2010, KBWD has lagged the sector benchmark Financial Select Sector SPDR Fund ( XLF ) by about 5 percentage points in annualized return. Moreover, it shows a higher risk in maximum drawdown and volatility (standard deviation of monthly returns).
| Total Return |
| Annual Return |
| Drawdown |
| Sharpe ratio |
| Volatility |
| KBWD |
| 107.39% |
| 6.17% |
| -58.63% |
| 0.37 |
| 22.12% |
| XLF |
| 262.29% |
| 11.15% |
| -42.86% |
| 0.61 |
| 19.09% |
Data calculated with Portfolio123
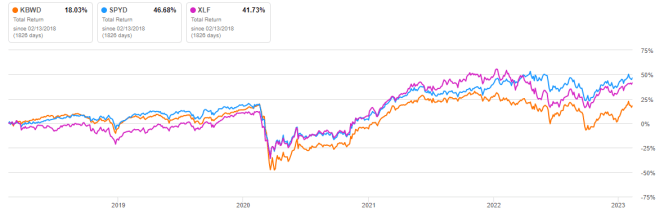
In the last 5 years, it has lagged both XLF and a high yield equity benchmark: the SPDR Portfolio S&P 500 High Dividend ETF ( SPYD ).
KBWD vs XLF, SCHD, last 5 years, total return (Seeking Alpha)
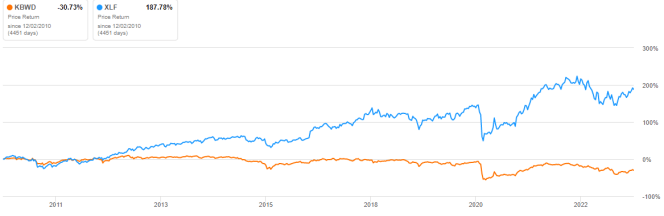
The share price return without dividends, plotted below, shows that KBWD has suffered a total capital decay close to -31% since inception, whereas XLF is over +180%.
KBWD vs. XLF since inception, price return (Seeking Alpha)
The annual sum of monthly distributions went down from $2.09 in 2012 to $1.68 in 2022. This is a loss of 20% in annual income in 10 years.
Capital and distribution decay is not specific to KBWD: securities with yields above 6% suffer from capital decay on average (there are rare exceptions).
My dividend ETF reviews usually report calculations of aggregate value and quality metrics. It is possible to obtain quantitative factors for KBWD, but it makes no sense to compare them to other equity ETFs. Usual ratios are unreliable in the financial sector. Anyway, mortgage REITs and BDCs package debts and use leverage. That’s definitely not good from a qualitative point of view.
Takeaway
KBWD holds about 40 stocks of high yield financial companies. Distributions and aggregate valuation ratios look attractive, but it has 4 red flags: expense ratio, concentration in mortgage REITs, capital decay, distribution decay. KBWD may be used as an instrument for swing trading or tactical allocation, but I definitely can’t imagine it in a sustainable income plan. The same is true for a number of high-yield instruments, not only this one.
Bonus: How to manage capital decay in high yield securities
Capital and income decay is also an issue in closed-end funds, but it is possible to mitigate it thanks to specific anomalies and rotational strategies. I designed a 5-factor ranking system in 2016, and monitored its performance during several years. I started publishing the eight best ranked CEFs in Quantitative Risk & Value (QRV) after the March 2020 meltdown. The list is updated every week. Its average dividend yield varies around 7%. It's not a model portfolio: trading the list every week is too costly in spreads and slippage. Its purpose is helping investors find funds with a good entry point. In the table and chart below, I give the hypothetical example of starting a portfolio on 3/25/2020 with my initial “Best 8 Ranked CEFs” list and updating it every 3 months since then, ignoring intermediate updates. Return is calculated using closing prices, with holdings in equal weights and reinvesting dividends at the beginning of every 3-month period.
| since 3/25/2020 |
| Total Return |
| Annual Return |
| Drawdown |
| Sharpe ratio |
| Volatility |
| Best 8 CEFs quarterly |
| 139.30% |
| 35.27% |
| -20.60% |
| 1.51 |
| 20.26% |
| KBWD |
| 101.57% |
| 27.47% |
| -30.74% |
| 1.03 |
| 27.51% |
The “Best 8” model had a positive total return in 2022, about 8%. Of course, past performance (real or simulated) is not representative of future return. It is unlikely to perform as well in the near future as since March 2020. The 2020 meltdown and 2022 volatility resulted in price dislocations and exceptional opportunities in the CEF universe. However, I think a time-tested rotational strategy in CEFs has a much better chance to protect both capital and income stream against erosion and inflation than a high-yield ETF.
For further details see:
KBWD: 10% Yield With 4 Red Flags