IBM - Kyndryl: Path To Profits Is Still Unclear
Summary
- Kyndryl's separation from IBM is now complete and the company has had nine months of independent operation.
- The first nine months of operation are reviewed to see if the required growth in revenues and margins necessary to achieve profits is being achieved.
- Margins have increased slightly while revenues have fallen and the path to profits remains unclear.
Kyndryl: Investment Thesis
Back in February 2022, with the Kyndryl ( KD ) share price at $15.82 I published article, "Kyndryl: Path To Profits Unclear", with a Sell rating. That assessment was made on the basis of proforma financial data through September 30, 2021 contained in SEC filings and a presentation by Kyndryl CFO in November 2021. Since that time, the Kyndryl share price has fallen by 19.09% to $12.80, compared to a fall of 8.39% for the S&P 500, per Figure 1 below.
Figure 1
SA Premium
Some water has passed under the bridge since my previous article, some actual results are in for Kyndryl post-spinoff from IBM ( IBM ), and I decided to take another look.
After unscrambling a very complex presentation of data contained in Kyndryl SEC filings, I still find the path to profits is unclear and maintain a Sell rating. Below I walk the reader through the process that leads me to that conclusion.
Kyndryl: Actual Performance Versus Proforma Historical Performance
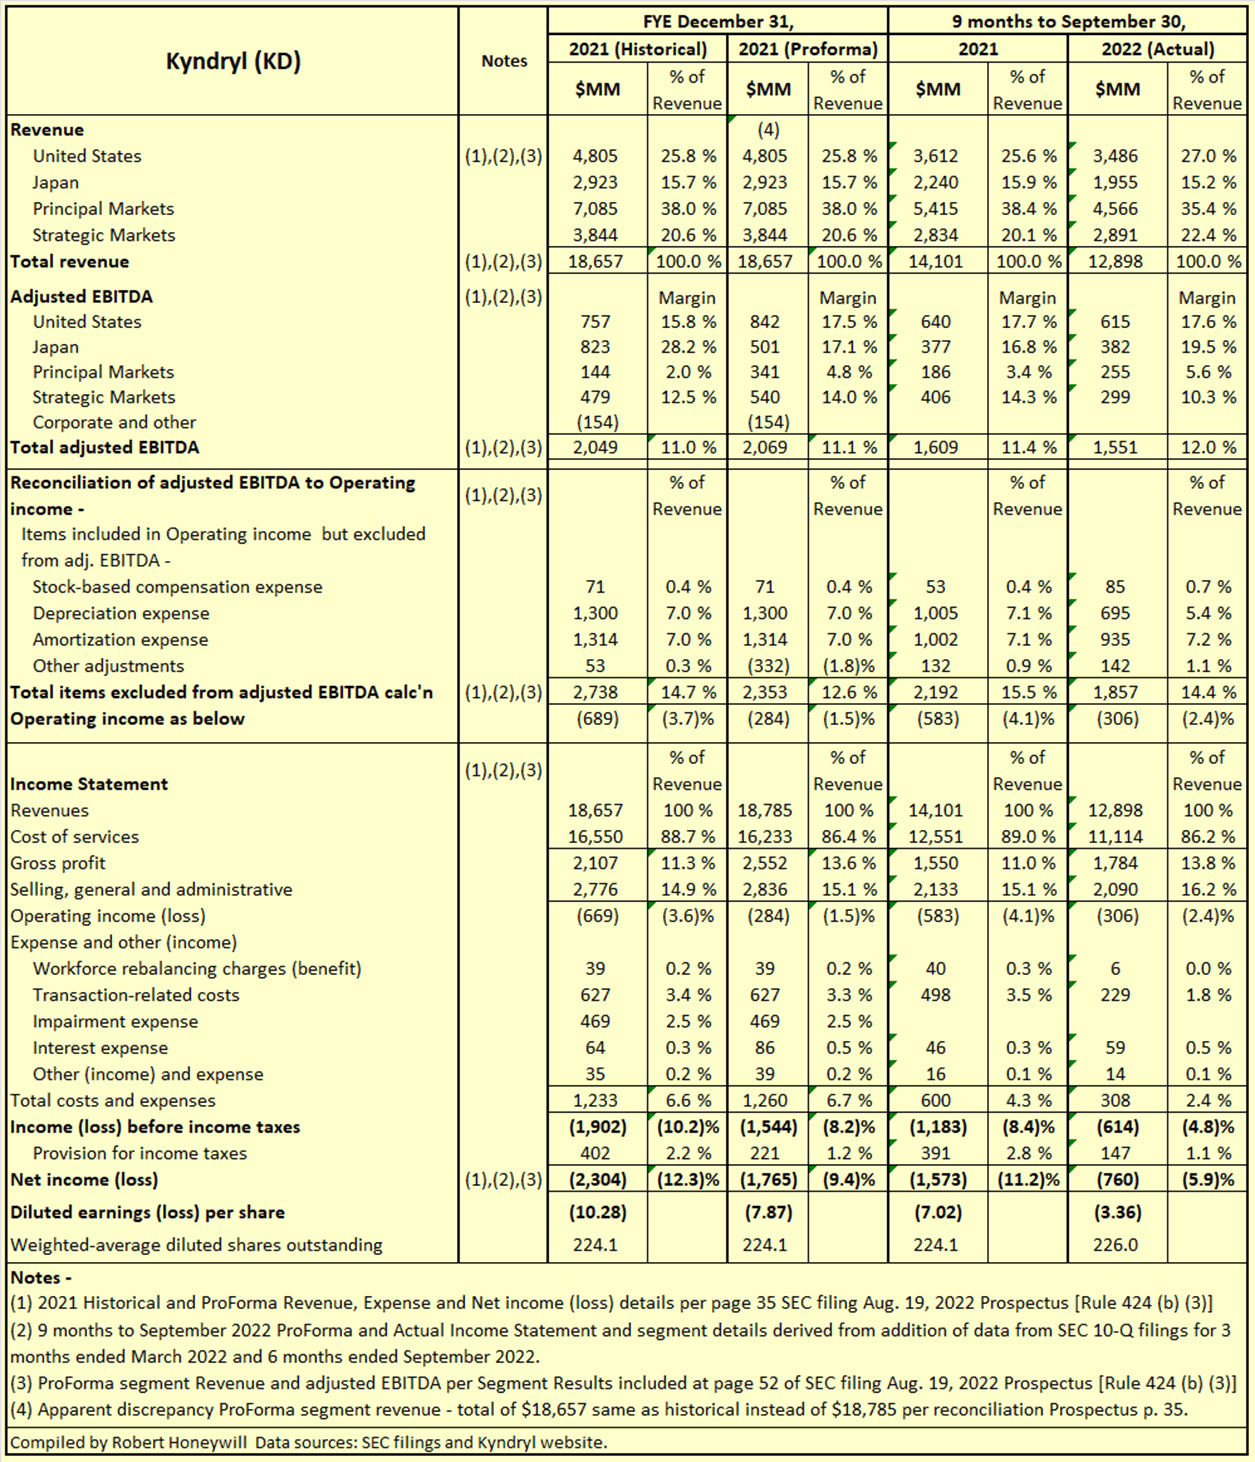
For my previous assessment of Kyndryl's prospects I relied on historical and proforma data from the Kyndryl Draft Registration Statement (the "DRS"), filed with SEC on June 22, 2021, and the Kyndryl Q3 2021 10-Q, filed Nov. 22, 2021. Since that time, Kyndryl has lodged a final Prospectus with SEC on Aug. 19, 2022 and 10-Q's providing quarterly results for three months ended March 2022 and for six months ended September 2022. From these reports I have been able to prepare summary financials for nine months actual results to end of September 2022 with comparisons to ProForma results for the corresponding previous period. I have also included a summary of year end December 2021 historical and proforma financials including details of adjusted EBITDA. I have to say that Kyndryl have not made this task easy by a confusing set of reconciliations in the Prospectus lacking clarity on whether figures included are historical or proforma, and also by throwing in a change in financial year end to March 31, which means they will never have to report directly against Prospectus proforma figures prepared on a December fiscal year end basis. Table 1 below reflects the results of my efforts to bring some greater clarity to the Kyndryl reporting.
Table 1
SA Premium, SEC filings and Kyndryl website.
In my previous article, linked above, I was able to discern the following in relation to segment earnings,
- The Americas segment is the largest contributor to gross profit - 2018 59.2%, 2019 53.2%, 2020 54.5%, and nine months ended Sept. 30, 2021, 59.9%.
- Europe/Middle East/Africa segment is the worst performing and that performance is worsening over time.
- In all periods, selling, general and administrative (SG&A) expense exceeds total gross profit by a considerable amount. As a separate entity without parent support, this is unsustainable.
Well, management have effectively put a stop to that sort of analysis by re-jigging the segments and ceasing to report segment earnings at the Gross profit level. Companies (including Kyndryl peers listed by SA Premium) generally report segment earnings at the Operating income level , which takes account of both Cost of sales and Selling, distribution and administrative expenses ("SD&A"). Kyndryl was previously providing segment analysis at the gross profit level, thus reporting better results than would be the case if SD&A were included. The changes in reporting are disclosed in the September 2022 10-Q filing,
Our reportable segments correspond to how the chief operating decision maker (“CODM”) reviews performance and allocates resources....The measure of segment operating performance used by Kyndryl’s CODM is adjusted EBITDA..... The use of revenue and adjusted EBITDA aligns with how the CODM assesses performance and allocates resources for the Company’s segments. The Company has recast the prior-period results to reflect the change in segment structure that became effective in the fourth quarter of 2021.
Table 1 above shows details of adjustments to Operating income to arrive at adjusted EBITDA (Earnings Before Interest, Depreciation, and Amortisation). For the nine months ended September 30, 2022 a total of $1.857 billion has been adjusted out of the Operating loss of $306 million to arrive at an adjusted EBITDA of $1.551 billion profit. There are two issues I have with this,
- If the major items of Depreciation expense ($695 million), and Amortization expense ($935 million), adjusted out of Operating income were analysed by segment elsewhere in the report, that would be more acceptable disclosure.
- The major inclusions in Amortization expense of $935 million are costs of Prepaid software, Capitalized costs to obtain contracts, and Capitalized costs to fulfil contracts. It is difficult to understand how a CODM could be adequately reviewing performance and allocating resources if major expenditures on software and contract acquisition and fulfilment are excluded from the primary performance measure.
Table 1 above shows Kyndryl needs stellar revenue growth and margin expansion to turn losses into profit. In fact, revenue declined for the nine months to September 30, 2022 compared to the same period for 2021. Adjusted EBITDA and Operating income margins did improve. That is a welcome sign but far greater improvement is needed.
Kyndryl: Outlook
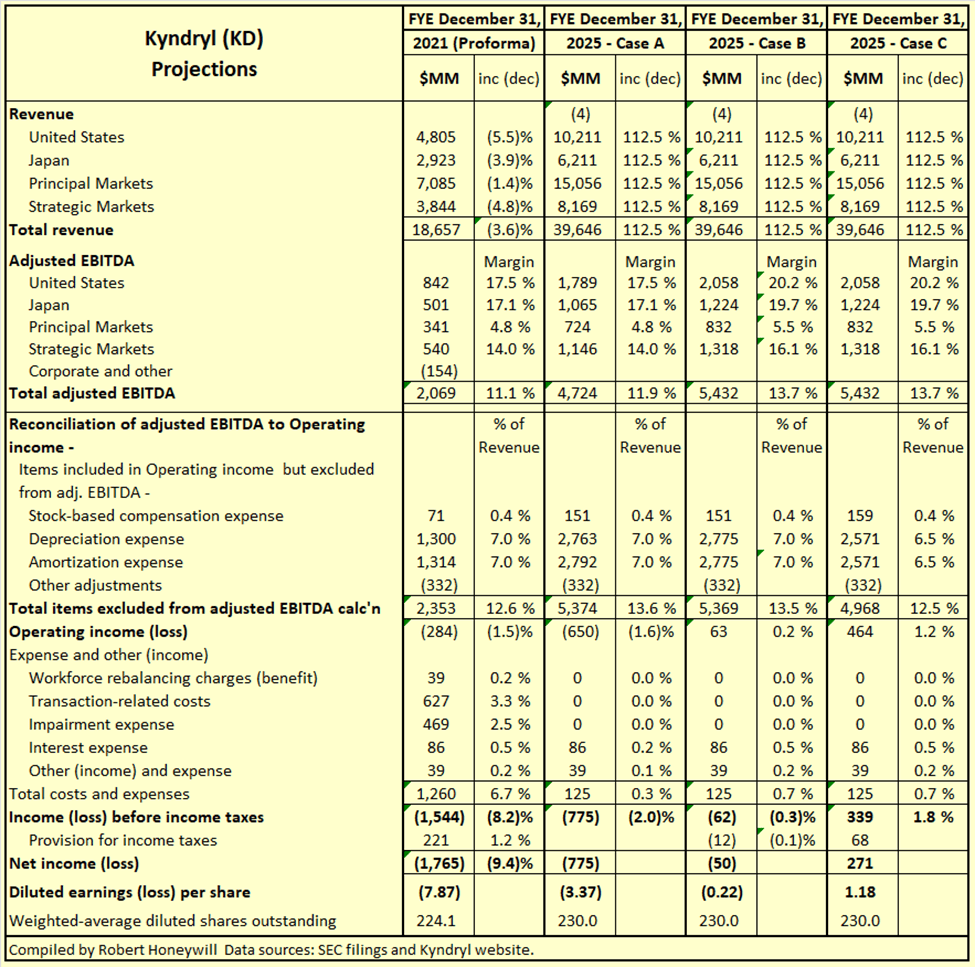
In Table 2 below, I take the FYE 2021 proforma results and use as a base to project a range of "what if?" results for Kyndryl for FYE Dec. 31, 2025, to see what it might take to justify the current share price.
Table 2
SEC filings and Kyndryl website
Comments on Table 2 -
Revenue -
The underlying business of Kyndryl is a mature operation, yet Table 1 indicates the business is presently unprofitable. This raises the question how Kyndryl might increase revenues to overcome this lack of profitability. Per Kyndryl's CFO, David Wyshner, in a Nov. 4, 2021, presentation :
Our separation will more than double our addressable market from $240 billion pre-spin to $510 billion by 2024, with market growth driven by numerous interrelated tailwinds. That's more than twice our potential when we were a unit of IBM. It's a growing market that is being driven by businesses' massive push to automate processes, the explosive growth of data and the need for greater cybersecurity across all industries. A key part of enlarging our market is the freedom of action that comes with being a standalone entity. We are a true services company, propelled by the needs of our customers, rather than the services arm supporting a company that sells technology products. We are free to expand our ecosystem of partners and services with a technology-agnostic approach that benefits our customers.
Case A -
Achieving proportionate growth in Kyndryl's revenues to match the growth in its addressable market by 2024 requires a 112.5% growth in revenues over 2019 levels by 2024. Seeing revenue has declined from 2019 through 2021, I have assumed a 112.5% increase over 2021 revenues by 2025. In Case A it's assumed adjusted EBITDA margin and Depreciation and Amortization expense as a percentage of revenues remain constant at 2021 percentage levels. As can be seen, volume alone will not result in achieving profitability. In fact, the improvement over 2021 is due to assuming nil Transaction-related and Impairment expense in 2025.
Case B -
Case B is similar to Case A, except it is assumed gross profit margins in 2025 have increased by 15% over 2021 levels. It should be noted previous attempts to increase margin in 2019 resulted in revenue decline of 7%, and did not lead to improvement in the ongoing loss situation. Excerpted from the DRS:
In 2019, we reported $20.3 billion in revenue, a decline of 7.0 percent when compared to the prior year, which was driven by declines in the Americas and EMEA segments, and a currency headwind. Like our clients, we prioritized higher value opportunities in 2019. Discrete account and portfolio actions were taken to improve our profitability in the long term even though they had an impact on our 2019 results. Gross profit margin of 12.8 percent improved by 1.1 points, reflecting the benefit from structural actions taken to improve contract profitability. Total expense and other income of $3.2 billion was flat when compared to the prior year. Losses from operations were $0.9 billion, consistent with the prior year.
Table 1 shows the percentage margin gains in 2019 have been given up in subsequent periods. Case B shows even a 112.5% increase in Revenues and a 15% increase in adjusted EBITDA margin is not sufficient to achieve profit.
Case C -
Case C is similar to Case B, except it is assumed Kyndryl, as it grows revenues, is able to leverage its operations in relation to use of Prepaid software, and Contract acquisition and Contract fulfilment. In Cases A and B it is assumed costs for these items remain at the same percentage of revenue as for 2021. In Case C it is assumed these costs do not increase proportionately to increases in revenue. Just a 0.5 percentage point (7% reduction) in these costs as a percentage of revenue turns the loss in Case B to a profit in Case C. Applied Industrial Technologies ( AIT ) is an excellent example of this leveraging of operating capabilities as discussed in detail in my recent article, " Applied Industrial Technologies: Still A Buy ".
Justifying The Current Share Price
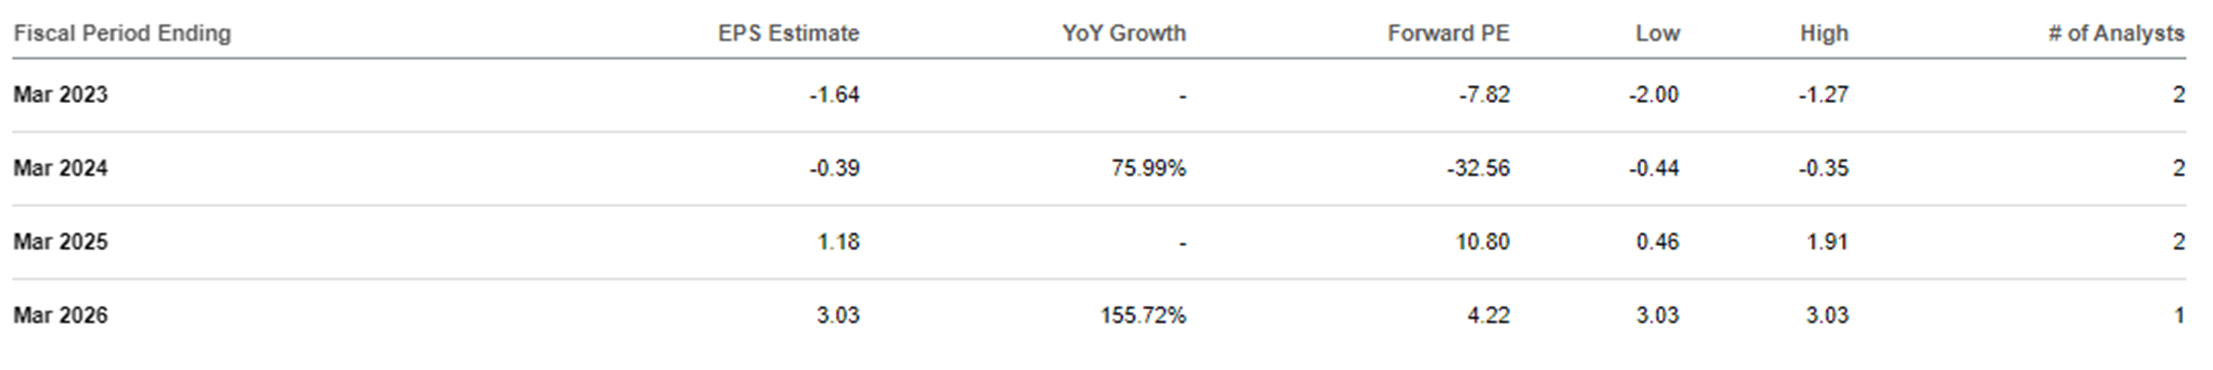
Figure 2 below shows current analysts' EPS estimates per Seeking Alpha Premium.
Figure 2
Based on SA Premium analysts' consensus estimates, Kyndryl will first achieve positive EPS of $1.18 in 2025, which, not entirely by accident, accords with Case C in Table 2 above. If we apply a multiple of 16.5 to $1.18 we get a share price at end of 2025 of $19.47. Buying Kyndryl stock at Jan. 24 closing price of $12.80 and selling at end of 2025 at $19.47 would result in average yearly return of 15%. Given the uncertainties related to achieving sufficient revenue and margin growth to achieve profits, I would consider 15% per year return a minimum target for an investment in Kyndryl stock.
Summary and Conclusions
Kyndryl requires very significant growth in revenues and margins to become profitable. In the nine months of fully independent operation, revenues have declined compared to the prior corresponding period. Margins have improved slightly but not nearly sufficient to achieve positive net income. Given the task ahead and the rate of progress to date I have to conclude I still do not see a clear path to profits for Kyndryl. This could change in the future as this now independent (from IBM) company hopefully finds its feet and establishes a growth path. In the meantime, a Sell rating is maintained.
For further details see:
Kyndryl: Path To Profits Is Still Unclear