LHX - L3Harris: Financial Data Needs Strong Trend Reversal
2023-10-19 12:30:55 ET
Summary
- L3Harris Technologies, a relatively young aerospace defense company, is experiencing a worrying trend of declining profitability and increasing debt.
- While revenue is growing, key financial indicators such as EBIT, EPS, FCF, and ROCE have been declining for three years.
- The sustainability of the company's growing dividend and the adequacy of its capex for future growth are also concerns.
L3Harris Technologies ( LHX ) is a young company just 4 years old, born from the merger of two solid companies in the aerospace defense sector. The data from the last Quarter show a growth trend in terms of revenue while the major profitability parameters analyzed in this article (EBIT, EPS, FCF, ROCE), although positive in absolute value, show a decidedly worrying trend that has been underway for 3 years. The contrasting dividend shows a growing trend and this may not be sustainable in the long term. The capex analysis raises some doubts about possible future growth and ultimately the share price value could be too high. My rate is Sell
General Overview
L3Harris Technologies is a leading American technology and defense company. Founded in 2019 through the merger of two previously independent companies, L3 Technologies and Harris Corporation, L3Harris operates across a broad range of industries and offers integrated solutions to address complex challenges in defense, homeland security, and advanced communications. The company is headquartered in Melbourne, Florida but has a significant global presence.
L3Harris' core activities include:
• Communications and Defense Systems including tactical radio, satellite, and network devices.
• Sensors and Surveillance: radar, identification, and tracking systems.
• Space and Defense: satellites and space communications systems.
• Cyber Technologies: solutions to protect networks from cyber threats and attacks.
• Aviation and Aerospace Technologies
• Advanced Electronics is used in a variety of applications, including medical equipment, industrial automation, and communications networks.
The company serves a diverse customer base, including government clients, militaries, security agencies, corporations, and other organizations around the world.
Financials and Highlights
Revenue and Ebit
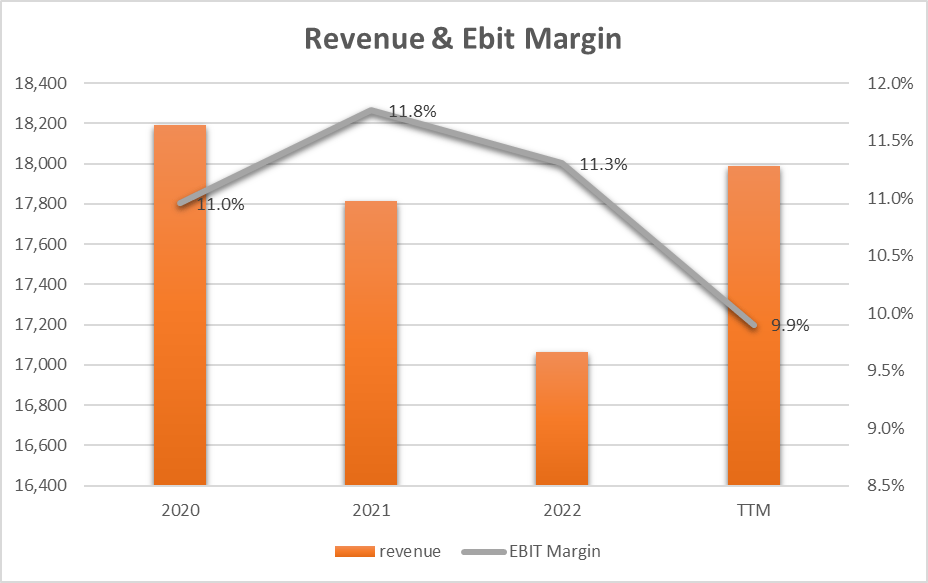
2023 sees a reversal of the trend, i.e. it is the first year (after 3 years and after the merger) that revenue starts to grow again. It could be an excellent sign of recovery were it not for the inverse trend in EBIT. We note how the EBIT margin has fallen [TTM] dangerously below 10%, a decline that has been consolidated for 3 years. Analyzing the balance sheet data we notice how the loss of margins is mainly attributable to the gross margin level and this identifies a possible short/medium-term structural problem.
Return on Capital Employed
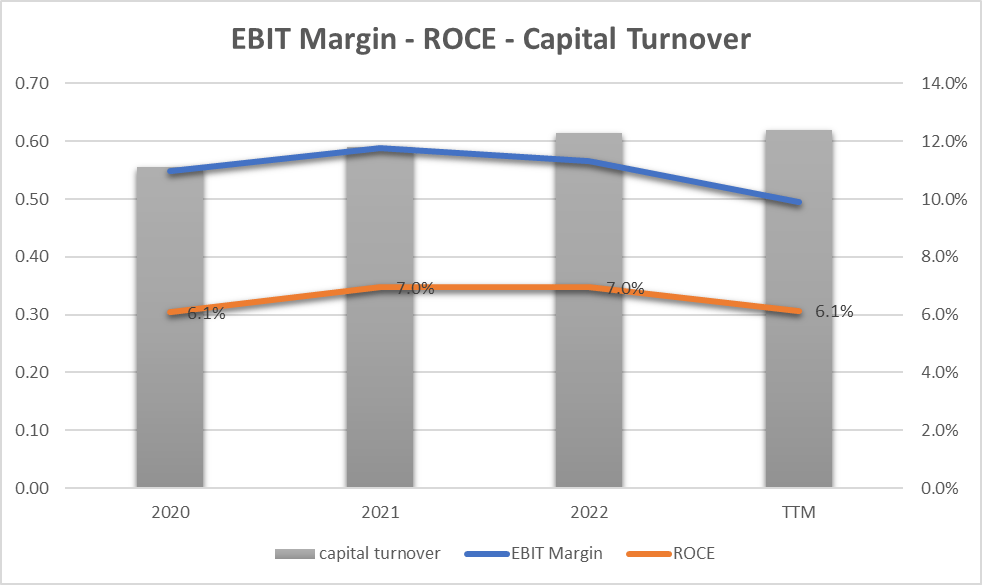
The capital turnover in 4 years remained within a very limited range between 0.5 and 0.6 (2023 in line with 2022) with slight growth. The parameter is consistently lower than unity and this identifies the use of the capital employed which for every $1 invested is not capable of returning $1 in sales. In this case, the company returns $0.6. The ROCE follows the trend of the EBIT and therefore this parameter also sees a heavy downtrend in 2023.
From the point of view of the use of capital, the company still has great improvements to implement and at the moment the ROCE with a profitability of 6.1% does not represent a virtuous element.
EPS, FCF, Dividend, and Capex
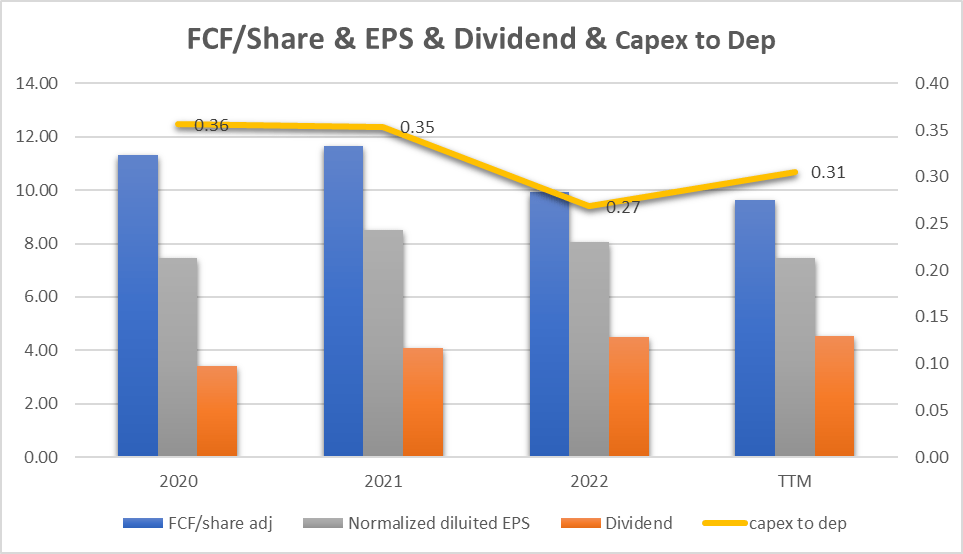
The graph shows the trend of EPS (gray bars) on an annual basis and we can see that the trend follows that of EBIT. There was a slight increase in 2021 and then a decline until 2023.
The company can transform EPS into Free Cash Flow (blue bars) continuously and we can see that the FCF also has a decreasing trend from 2021. All this is in line with the general profitability [EBIT] discussed in the paragraph previous.
Another important aspect concerns the dividend coupon which is stable and sustainable over the years but records a growing trend in contrast to the trend of EPS and FCF. This aspect, in my opinion very important, and highlights a possible lack of sustainability in the growth of the dividend in the next quarters as the long-term trend must necessarily follow that of company profitability.
The last data in the graph represents the relationship between Capex and depreciation (yellow line). We can see how the data stands at 0.31 and this could indicate a Capex expense that is too low or not capable of supporting company assets in the long term. It should also be noted that compared to 2020 (0.36) the trend is decreasing and this aspect also further exacerbates any critical issues in investments for company growth.
Going into the details of the EPS and following the analysis done by the company at the Quarter level we notice that there is a large negative impact of $(0.14) due to the pension fund and above all an even more negative gap due to the interest on the debt $(0.19). Operationally the company created very little value $0.01 while from a shareholder value perspective, it repurchased shares for a positive impact of $0.06. This last data underlines how at an operational level the company is burning value.
Debt
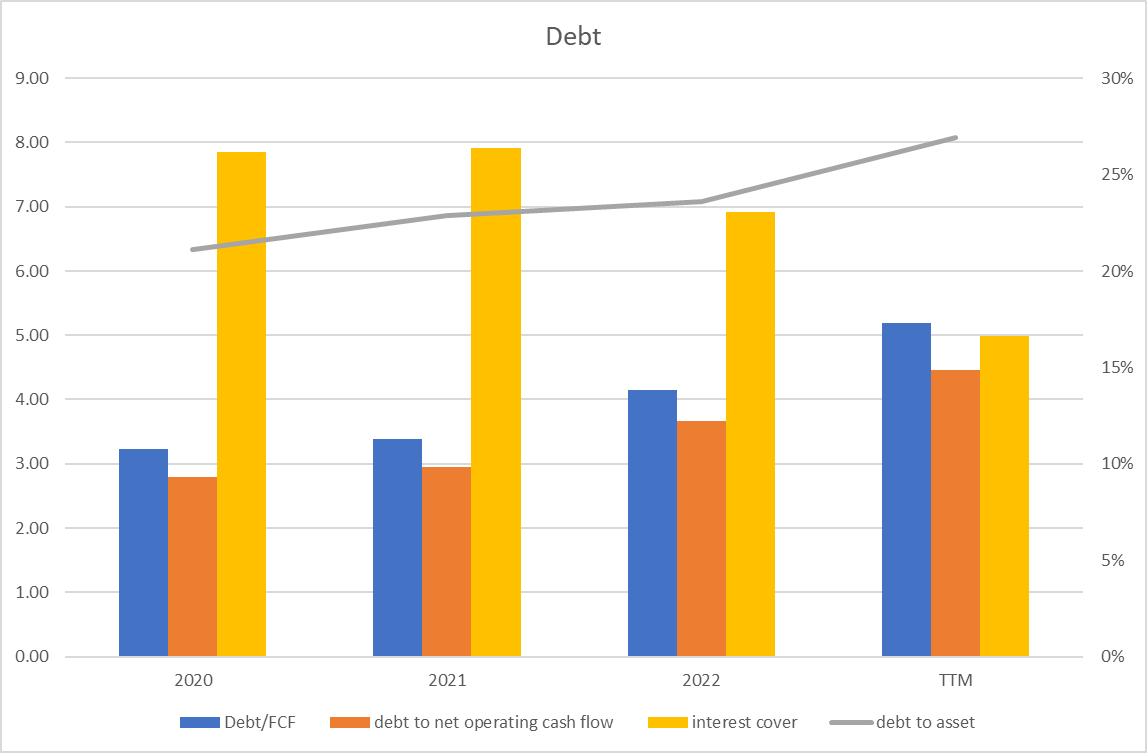
Even at the corporate debt level, we can see how all the main economic indicators identify a negative trend at a trend level. Debt to assets rises to 27% [TTM] from 21% in 2020. The debt to FCF ratio, after an improvement in 2020 (3.22), also grows to 5.19. And ultimately, the interest to cover that should grow is drastically reduced by half in 4 years. Although the [TTM] data is not terrible, the trend that has now persisted for 4 years highlights behavior that could lead to a loss of value for the company.
Acquisition of Aerojet Rocketdyne
LHX on July 2023 completed the acquisition of Aerojet Rocketdyne Holdings , Inc.. Commonly known as Aerojet Rocketdyne it is an American company specializing in the design, development, and manufacturing of advanced propulsion systems for a wide range of applications, including rockets, jets engines, missiles, satellites, and systems of defense. Founded in 2013 as a subsidiary of GenCorp Inc., Aerojet Rocketdyne is a leading aerospace and defense company.
The company [TTM] with over 5,000 employees shows $2.29B in Revenue, an EBIT of $207.1M (9%), and administrative costs of $57M. In the absence of heavy structural interventions (which will require a very long period), the EBIT of Aerojet (9%) does not add value to LHX's EBIT (9.9%).
Listening to the last earnings call :
"We bought this company to sell engines and motors and that's what we're going to do. We'll be ready to hit the ground running on day one. We did have integration office with representatives from both teams.
And the business case that we laid out back in December with accretion of EPS and free cash flow in the first full year and first full second year continue to remain in place or maybe slightly better."
We could hypothesize a possible operational efficiency improvement of the order of magnitude of Aerojet's administrative costs and creation of value that we will be able to see no sooner than one or two years.
LHX and Earnings Power Value
Even though the FCF is going down I try assuming that the cash profit remains constant over the long term, I use the EPV (earnings power value) method to calculate the intrinsic share price value.
The method starts with EBIT. The second step is to add depreciation and amortization and then subtract stay-in-business CAPEX.
The result is the Cash Trading Profit
I then subtract the taxes by calculating the amount using the actual tax rate that the company pays.
The result is the After-Tax Cash Trading Profit
At least to calculate the total company enterprise value I divide the After-Tax Cash Profit by the interest Rate I define as fine for this kind of Company (according to a study made by NYU , the cost of capital for Aerospace/Defence is 10.59%)
The result is the Total Company Earnings Power Value. Dividing the result by the total number of shares we find the value per single share.
The table below shows the calculation for LHX
| EBIT |
| 1,781.00 |
| Dep & amort |
| 979.00 |
| CAPEX |
| -299.00 |
| Cash Trading Profit |
| 2,461.00 |
| TAX |
| 15.80% |
| TAX |
| -388.838 |
| After TAX cash profit |
| 2,072.16 |
| Interest Rate |
| 11% |
| EPV |
| 19567.16 |
| Share in issue |
| 189.10 |
| EPV per share |
| 103.5 |
$103.5 represents the share price valuation using the EPV method. If we compare the data with the current market price ($179) we see that the current price could be seen as expensive.
Peer Comparison and Competition
L3Harris Technologies' publicly traded competitors vary depending on the company's specific businesses and areas of expertise. L3Harris is active in a wide range of sectors, including defense, national security, communications, and advanced technology. Below are some of the publicly traded companies that can be considered direct competitors or that operate in similar industries:
• Northrop Grumman Corporation ( NOC ): one of the world's leading defense and security companies, providing a broad range of services and systems, including unmanned aerial systems, space systems, and cyber.
• Lockheed Martin Corporation ( LMT ): an aerospace and defense giant, known for producing fighter aircraft, space systems, and advanced defense solutions.
• Raytheon Technologies Corporation ( RTX ): specializes in airport and defense technologies, producing radar systems, missiles, and aeronautical equipment.
• Boeing ( BA ): one of the world's leading aircraft manufacturers, offering a broad range of services and products in the aerospace and defense industry.
• General Dynamics Corporation ( GD ): active in aerospace, land defense, and information technologies.
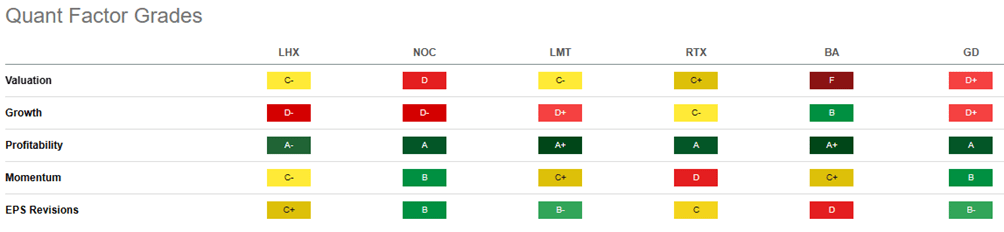
Using SA's Quant Rating we can see a solid yellow line in the table below. This indicates that the aerospace defense sector is not going through a good time. At a general comparative level, there are no companies that may be preferable to LHX at an investment level
Going into the detail of the Factor Grades we can see how in terms of Valuation LHX has one of the best grades while in Growth and Profitability, it has the worst Grade compared to its peers. In terms of Momentum and EPS Revision, it is at the bottom of the ranking.
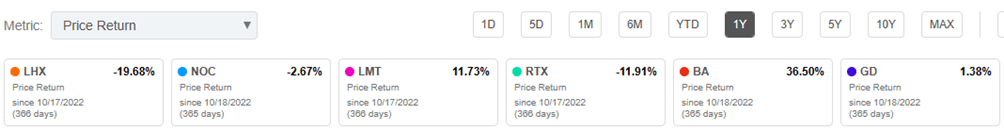
The market has also punished LHX in an exemplary manner in the last year where the share price lost 19.68% which is the worst figure when compared with competitors.
It is important to note that competition in these industries is often based on specialized skills and specific areas of expertise. L3Harris Technologies competes with many of these companies in various market segments, but at the same time collaborates with some of them on joint projects. The competitive landscape in these industries is dynamic and can vary based on specific activities and market developments.
Strong Possible Risks
Although the balance sheet data in absolute terms portray a healthy company, the negative trend represents an element of strong risk. First of all, EBIT has had a decreasing trend for 3 years accompanied by EPS and also by FCF. The ROCE analysis integrates a suboptimal return on capital and ultimately even the Capex may not be sufficient to guarantee sustainable growth in the future. All these elements mark a high risk in the possible investment in LHX
Bottom Line
L3Harris Technologies born 4 years ago from the merger of two solid companies is going through a turbulent period due to the profitability trend of the main financial indicators. Although revenue is growing, profitability has entered a negative loop for 3 years, debt is growing, dividend growth may soon no longer be sustainable and capex may not be adequate to support business growth. The recent acquisition of Aerojet Rocketdyne represents a possible unknown as it will take at least a couple of years to see any value creation in terms of EPS and FCF. The evaluation of the share price with the Earnings power Value method also determines a high price. My rating is a sell.
For further details see:
L3Harris: Financial Data Needs Strong Trend Reversal