WBD - Longleaf Partners Global Fund Q4 2023 Commentary
2024-01-20 09:00:00 ET
Summary
- Longleaf Partners Funds is a suite of mutual funds and UCITS funds that Southeastern Asset Management, the investment advisor to the Longleaf Partners Funds, created in 1987 as a way for Southeastern employees to invest alongside their clients.
- Longleaf Partners Global Fund had a good year. We nearly doubled the FTSE Developed Value Index, while almost equalling the tech-led FTSE Developed Index, and approximately doubled our absolute return goal of inflation plus 10%.
- Our future absolute returns will be driven by what we own - we believe our differentiated portfolio will lead to significant alpha via a differentiated return stream.
Fund Characteristics
| P/V Ratio |
| Mid-60s% |
| Cash |
| 8% |
| # of Holdings |
| 25 |
| Annualized Total Return |
| 4Q (%) |
| 1 Year (%) |
| 3 Year (%) |
| 5 Year (%) |
| 10 Year (%) |
| Since Inception (%) |
| Global Fund |
| 7.03 |
| 22.48 |
| 0.18 |
| 4.62 |
| 2.63 |
| 4.73 |
| FTSE Developed |
| 11.43 |
| 23.61 |
| 6.93 |
| 12.55 |
| 8.47 |
| 9.97 |
| FTSE Developed Value |
| 9.20 |
| 13.54 |
| 6.68 |
| 8.24 |
| 5.79 |
| 7.46 |
| All data as of December 31, 2023 *Inception date 12/27/2012. FTSE Developed Value 10 Year and Since Inception returns are gross returns, as net returns for those periods are not available. All other performance figures above are net returns. Returns reflect reinvested capital gains and dividends but not the deduction of taxes an investor would pay on distributions or share redemptions. Performance data quoted represents past performance. Past performance does not guarantee future results. The investment return and principal value of an investment will fluctuate so that an investor’s shares, when redeemed, may be worth more or less than their original cost. Current performance of the Fund may be lower or higher than the performance quoted. Performance data current to the most recent month end may be obtained by visiting Value Investors Since 1975 | Southeastern Asset Management . The prospectus expense ratio before waivers is 1.33%. The Global Fund’s expense ratio is subject to a contractual fee waiver to the extent the Fund’s normal operating expenses (excluding interest, taxes, brokerage commissions and extraordinary expenses) exceed 1.05% of average net assets per year. This agreement is in effect through at least April 30, 2025 and may not be terminated before that date without Board approval. |
Longleaf Partners Global Fund had a good year. We nearly doubled the FTSE Developed Value Index, while almost equalling the tech-led FTSE Developed Index, and approximately doubled our absolute return goal of inflation plus 10%. We were pleased with the progress made at our portfolio companies. Our management partners took steps to realize value per share via discounted share buybacks and other intelligent actions. Strong stock performance across most of our portfolio holdings drove solid double-digit returns in a year when value investing faced headwinds relative to growth strategies, and our lack of exposure to Info Tech created a 6%+ drag on relative results.
2023 Market Review
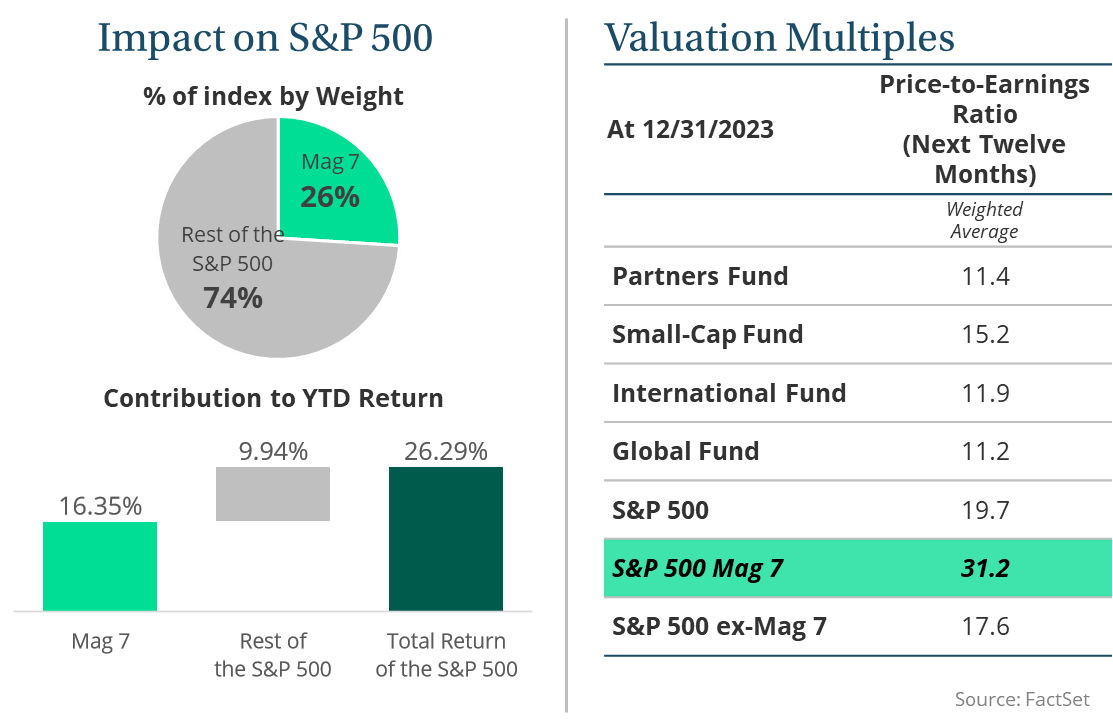
It has been widely publicized that seven stocks drove global markets, accounting for 26% of the weight and 62% of the performance of the S&P 500 Index ( SP500 , SPX ) in 2023. By contrast, 72% of stocks underperformed the S&P 500, an all-time high in the last two+ decades. Returns for the S&P 500 Equal-Weighted Index reflected this discrepancy, returning “only” 13.8% for the year. These same 7 stocks that dominated the U.S. Index also dominated Global, accounting for 42% of the FTSE Developed Index 2023 performance. U.S. large cap continued to outperform World-ex U.S. markets in 2023 given the narrow set of global drivers.
Our research team was busy in 2023. At the start of the year when everyone was still predicting an imminent recession, we saw opportunity as contrarians and improved our portfolio with weighting changes and compelling new investments, many of which have already contributed to the portfolio. In the fourth quarter, we have seen a growing consensus about a soft landing. This consensus view concerns us for the same reasons we were excited to be buying earlier in the year when everyone was fearful. However, we are confident in our ability to keep delivering double-digit returns with our portfolio of competitively advantaged, financially strong businesses with management teams that can take self-help measures in any environment. 2023 showed us that our investment approach can add meaningful value, even in a challenging period for bottom-up active equity managers.
In previous letters, we talked about the return of normal nominal interest rates making this a stock pickers’ market again. [1] When discounted cash flows (DCFs) matter more, bottom-up research matters more. Southeastern has thrived in environments like this before and believe the 2020s will be another great decade for us like most of the ‘70s, ‘80s and ‘00s.
The Future of Public Equity Value Investing
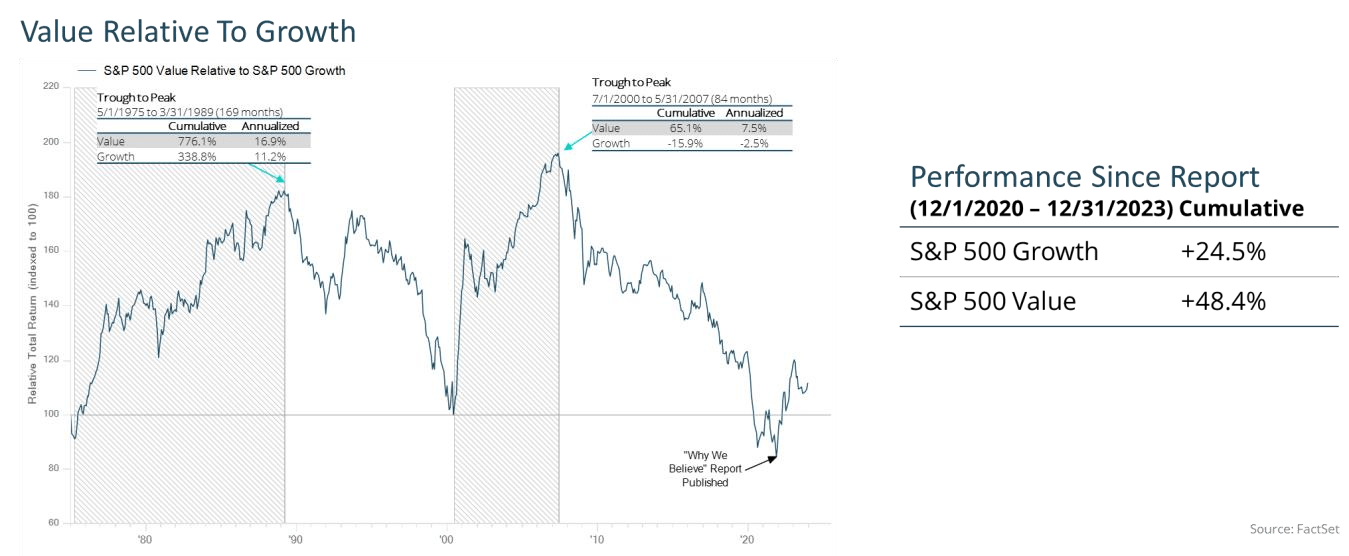
Three years ago, we wrote a paper on why we believe value was primed to work again, and we believe we are still well positioned for the return of value. Since we published the paper , Value has outperformed Growth over the subsequent three years, though it has been a rocky path.
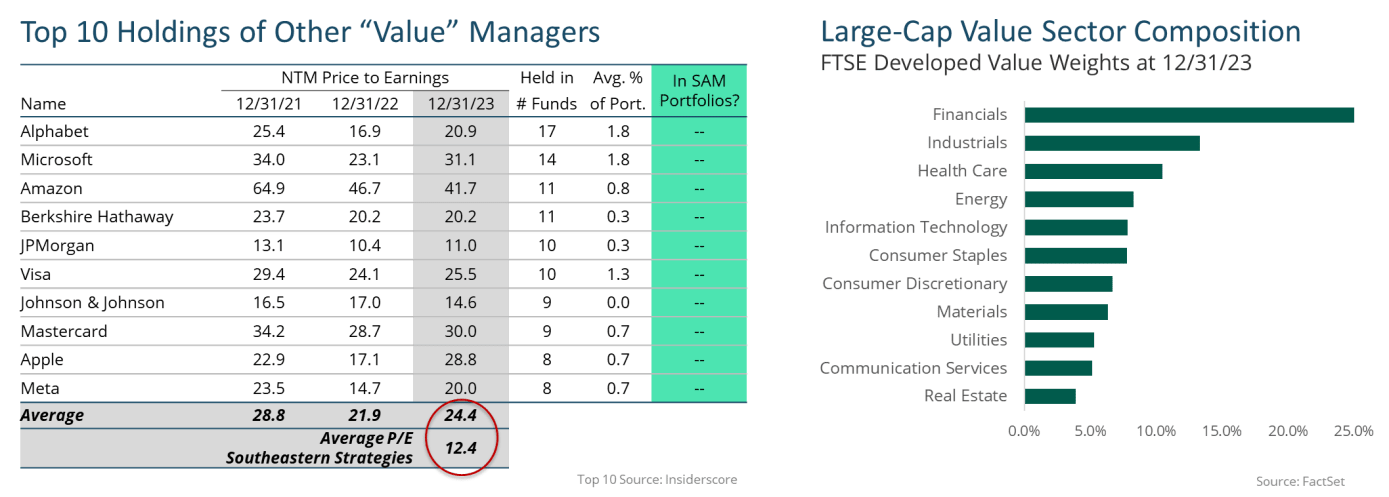
However, we have continued to see the “Value” universe split into extremes of what we would call “Quality at a Higher Price” vs. “Value ETF” (or Low Quality at Low Multiples). This is best illustrated by an analysis of the average top ten holdings of “Value” managers, which shows a mix of five of the “Magnificent 7” and Financials, as shown in the chart below:
We do not belong to either of these extremes. Our continued focus is on “Business, People, Price.” We demand high-quality businesses, defined as competitively advantaged companies that will produce more free cash flow ('FCF') in the near future and earn above average returns – i.e., not “cigar butts.” However, we will not pay the high prices commanded by the traditionally defined “Quality” that can be overvalued as it is easy to see. We look for hidden quality with management teams that will take steps to get that quality recognized by the market over the medium to long term. After a brief period of “Value ETF” outperforming in 2022, the “Quality at a Higher Price” (QHP) strategy outperformed again in 2023. However, we saw a lot of positive signs in 2023 that our approach is well positioned for 2024 and beyond.
It is easier for us to feel better positioned relative to QHP when the index is at 16.8 earnings and many of its larger constituents owned by “value” managers are 25-30x+ peak earnings. Paying a multiple like this has not historically worked long term, and this is compounded by today’s higher interest rates vs. those of the previous 10-15 years. It might seem harder to argue that we have more upside than Value ETFs trading at a multiple of 12.7 as measured by the FTSE Developed Value Index. However, when we dig into what the value index owns, we feel much better about our portfolio, which trades at a multiple of 11.2.
There are three primary buckets that comprise 49% of the value index and have lurking dangers within their lower-than-market headline multiples:
- Financials (25%) – While we are happy to own Financials (the Fund is currently overweight relative to the Index), we have historically had difficulty qualifying banks using our Business, People, Price discipline. However, in the wake of the crisis that rocked the bank industry in the first quarter, we have spent more time on banks over the last one year than we have in the previous 10 years. Even with steep headline price declines, we have had trouble qualifying these generally opaque, highly levered businesses. While the stated next twelve months (NTM) price to earnings ('PE') multiple of the average bank is certainly lower than the market’s, we question the growth and stability of that earnings per share ('EPS') – let alone FCF for an industry like this. We suspect there are still potential bombs lurking in many loan books. American Banker recently summarized a study detailing how 40%+ of office real estate loans are underwater, and there are problems in other places as well. Our values for high quality, small-cap real estate companies that are the best proxies for some of these loans are more conservative than the numbers many loans need to avoid write downs. Many market prices for publicly traded real estate equities are below our values, even after a strong end to the year. Many loans on real estate are attached to lower quality assets than are owned by these public real estate companies. That’s not a good chain of facts for many publicly traded banks. At times over the last year, the valid fear over this dynamic was much more priced in than it is now.
- Information Technology (13%) – We have typically had limited exposure to IT in our portfolios, which has been a notable relative drag on performance over the last decade+. We are extra wary of low multiples in this part of the market today for two main reasons: 1) cyclical peaks in volatile industries are dangerous (e.g. it’s generally been better to pay a “high” NTM multiple for a semiconductor company than a low one); 2) multiples can be low for good reasons if the dreaded “disruption” is real, which it is for a higher percentage of companies in this industry than in others.
- Resources (11%) - We have proven we are open to this industry and remain willing to own companies in it that qualify on a bottom-up basis if we have competitively advantaged assets and great management partners. Another factor that determines returns is the starting spot commodity price and futures strip. We no longer have the free shot at upside we did before inflation and the Ukraine war, but we also are down from the highs post-Ukraine. That suggests to us an industry that is neither dear nor cheap in total. If you buy the market cap weighted index, you will likely get more capital allocation pain from larger companies overpaying for smaller ones, which we saw happening more as the year went on and expect to continue if animal spirits run wilder.
Our future absolute returns will be driven by what we own. We believe our differentiated portfolio will lead to significant alpha via a differentiated return stream.
The Future of Our Portfolios
This time last year, we wrote about three portfolio management process improvements we made in the second half of 2022. After an extended period of relative underperformance, capped off by a particularly challenging absolute and relative year in 2022, we undertook extensive analysis that helped inform tweaks to our long-term discipline. We believe this evolution of our process has helped us be a better version of ourselves for the present and future. The analysis showed that we have demonstrated long-term skill as bottom-up stock pickers, with a historic batting average of wins to losses of 60%+. However, the data led us to conclude we could improve in three primary areas by 1) limiting large overweight positions in the portfolio, 2) building in additional conservatism into our appraisals for holding companies (and therefore demanding a higher discount) and 3) focusing on price-to-enterprise value (P/EV) rather than pure price-to-value (P/V) in leveraged businesses where net debt to EBITDA exceeds 3x (again, resulting in a higher discount for such businesses).
The rules have improved how we analyze existing holdings and influenced the price at which we will buy a new holding and/or trim or add to an existing one. This has resulted in a higher level of resizing positions in the portfolio and exiting some long-term holdings this year. A good example in the portfolio today is Warner Bros Discovery ( WBD ), a company that we bought too early but that remains a holding in the portfolio. Our average price for the initial WBD investment in 2021 was $26.48, or a P/V ratio in the mid-60s%. However, P/EV on the initial report was 79%. Under the new rules, we would not pay that price for the company today. We most likely would have waited for a mid-60s% P/EV, which would have equated to a -teens entry price. In this case, we would have missed a too-large initial downturn in the stock price. The overweight rule dictated that we trimmed the position after the price ran up in the first half of 2023, which benefitted overall performance as the stock price subsequently fell again. However, even with the new rule lens, we remain confident in our case for the business and management’s ability to deliver going forward.
These three filters also help us make better decisions about what NOT to own, leading to fewer mistakes. In 2023, 22% of the investments delivered negative returns from the start of the year to the end of the year or from our average cost during the year if they were new investments in 2023. Of course, this was an up-market year, but our 22% down compares to the index, where 30% were negative this year. Performance across all strategies meaningfully improved since we implemented the new rules, and we believe these process improvements will help drive a higher batting average and strong future performance.
Contribution To Return
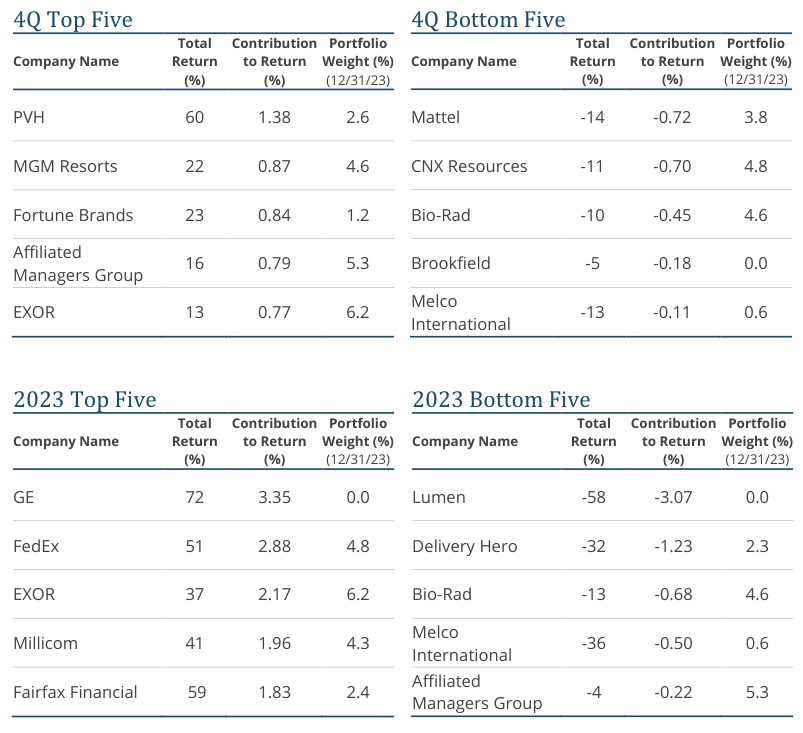
- General Electric ( GE ) - Industrial conglomerate General Electric ( GE ) was the top performer for the year. We exited this multi-year investment as its price went above our appraisal. In 1Q23, GE spun out GE Healthcare, which we sold as it traded at our value. The share price continued its strong performance throughout the spring and summer, and we ultimately sold the position in the third quarter when we no longer saw a margin of safety for the business. CEO Larry Culp was a great partner who created significant value for shareholders by reducing leverage, cutting costs, streamlining operations, improving company culture and simplifying the structure with plans to split the company into three businesses. We hope to have the opportunity to partner with him again in the future.
- FedEx ( FDX ) - Global logistics company FedEx was another top contributor for the year, driven by strong performance in the first half of the year. FedEx benefitted from strong pricing power in the face of rising inflation that improved earnings vs. low expectations. Effective cost control at the Ground business helped the company beat guidance in the first half, and margins increased even with weak overall revenues. In the last two weeks of the year, FedEx’s share price was punished after F2Q23 results disappointed, driven by revenue and earnings weakness at Express. The company revised revenue guidance down from flat for the fiscal year to down low single-digits. However, Ground and Freight both had strong quarters, and FedEx continued to buy back discounted shares. The Ground business comprises the majority of our appraisal value for FedEx, with Freight and Express comprising smaller but equal values. We added to our position in the fourth quarter after the price declined, and our appraisal remained steady.
- EXOR ( EXXRF ) - European holding company EXOR was another top contributor this year and for the quarter. The company consistently reported solid results with strength across most of its listed and private investments. In September, EXOR announced a €1 billion share buyback program, representing more than 5% of the market cap. The company also made a sizeable investment in publicly listed healthcare company Philips, which we know well from prior successful investments in the business, as well as a smaller investment in TagEnergy. EXOR also spun out its investment business in Lingotto and increased its investment in the business in the latter half of the year. CEO John Elkann has a strong history of making value additive investments and selling assets at attractive prices to get the value of those investments recognized.
- Millicom ( TIGO ) – Latin American wireless and cable company Millicom was also a top performer for the year, after being a top detractor in 2022. Millicom rallied early in the year on the news of multiple interested third parties. The share price retreated in 2Q after Millicom confirmed it had ended takeover discussions with private equity company Apollo Global. We were not counting on an Apollo buyout as an outcome, and our appraisal was not impacted by the news. The more compelling and value-additive update in the year was the arrival of new shareholder French billionaire Xavier Niel, founder of French broadband Internet provider Iliad, and subsequent shake-up of executive management and the board. Niel built up a roughly 30% ownership stake in Millicom via his investment vehicle Atlas Investissement. He took a seat on the Nomination Committee, where Southeastern also has a seat, and asked for multiple board seats as well. In August, Millicom announced the resignation of Chair José Antonio Ríos García, with CEO Mauricio Ramos taking over as Interim Chair and slated to step down as CEO of the business in 2024. Additionally, Maxime Lombardini, Vice-Chairman and prior CEO of Iliad, joined Millicom as President and COO, adding significant relevant industry expertise and capital allocation discipline to the company. We reduced our position on the back of strong price performance.
- Fairfax ( FRFHF ) – Fairfax was another top performer after it consistently reported solid EPS growth throughout the year. CEO Prem Watsa guided expectations for $100 EPS for the next three years and is on pace to exceed this level in 2023. The company extended its fixed income investment duration when treasury yields spiked in October. The company delivered strong underwriting performance with a mid-90s% combined ratio and premiums increasing 5% in the most recent quarter. The company continues to return capital to shareholders through discounted share repurchase, and in early January announced it was raising its annual dividend from $10 to $15.
- PVH – Apparel company PVH, which owns brands Tommy Hilfiger and Calvin Klein, was the top performer in the fourth quarter and among the top contributors for the year. CEO Stefan Larsson, whom we previously partnered with at Ralph Lauren, has done a great job improving brand power while growing margins and FCF per share in a challenging environment. PVH reported a solid 3Q and is on track to buy back over 10% of shares this year. We expect more repurchase after the sale of its Warners, Olga and True and Co businesses in the period. This sale highlights the company’s continued focus on growing its core brands Calvin Klein and Tommy Hilfiger.
- Live Nation ( LYV ) – Live Nation Entertainment, a new purchase this year, was a strong performer in the fourth quarter and a strong performer for the year as it outperformed expectations. Live Nation reported a great 3Q, with revenues and adjusted operating income up 30%+, concert revenues up 29% and ticketing up 55%. The company guided for continued strong growth in 2024. We have prior knowledge of Live Nation from our time owning various Liberty Media entities and are encouraged on future capital allocation that Liberty is still on the case as a 30%+ owner.
- Lumen Global - Fiber company Lumen was the top detractor for the year, and we sold our position in the first half, when it became clearer the new management team under CEO Kate Johnson would not pursue a strategic path to monetizing Lumen’s consumer business. Lumen represented a permanent capital loss for the Fund, a significant opportunity cost for the portfolio and a disappointing long-term mistake. Lumen has reinforced the importance of limiting overweight positions in the portfolio, being cautious of leverage and value declines, and fully reunderwriting a case – and being willing to move on – when the people and/or underlying facts change.
Portfolio Activity
2023 was a busy and productive year for our research team. We initiated 12 new positions. These additions were funded by selling 11 positions (two of which were spun out of existing holdings) and trimming an additional 15 in the year. Four of the new purchases appreciated before we were able to fill out a complete position, so we exited at a gain to fund opportunities with a higher margin of safety and upside potential. We ended the year with eight new positions spanning multiple sectors: Kellanova, Live Nation Entertainment, Bio-Rad Laboratories ( BIO ), Fidelity National Information Services ( FIS ), Eurofins ( ERFSF ), Delivery Hero ( DELHY ), Richemont ( CFRHF ) and Fortune Brands ( FBIN ). In addition to the small positions that we were never able to fill out, we sold GE Healthcare ( GEHC ) and WK Kellogg ( KLG ), which were spun out of existing holdings, and again successfully exited Alphabet ( GOOG , GOOGL , albeit with a shorter holding period our second time around). We exited CK Hutchison ( CKHUY ) as a result of a lack of value growth and disappointing capital allocation, coupled with increasingly challenging macro-economic headwinds. We sold our small position in Kering ( PPRUF ) and long-term holdings General Electric at a gain. We exited General Electric when it reached our appraisal value. We continue to watch the stock closely and hope to have the opportunity to partner with best-in-class CEO Larry Culp again. Finally, we sold our long-term position in Lumen at a loss, as discussed in more detail above and in our 2Q letter. While it is always disappointing to have a permanent capital loss, taking these losses puts the Fund in a tax advantageous position, meaning we could realize significant future capital gains without incurring a capital gain distribution.
Outlook
While our cash ended the year at a slightly higher than usual level of 8%, our on-deck list remains healthy, if not as strong as it was at other points over the last two years. The high level of new idea generation this year means we have multiple partial positions that we would love to fill out. We think it likely that 2024 will give us some volatility to put our cash to work and continue to improve our portfolio. We can’t tell you exactly where that volatility will come from or when it will hit. We did like how The Economist quantified 2024 as globally “ the biggest election year in history . ” And it might not be anecdotal that the market and humanity seemingly have itchier trigger fingers than the past. One quantification comes from how unruly airline passengers remain elevated at ~2x pre-covid levels. Volatility won’t just help us improve our portfolios, it will help our existing investees grow their own value per share in ways that are unexpected and don’t fit into a spreadsheet, again highlighting the importance of high-quality people who are on offense. We thank our long-time clients for their partnership. It was good to deliver better results in 2023. We believe we have the pieces in place to continue to deliver future results more like our first 30+ years.
| Footnotes [1] Discussed in our 4Q21 Global Fund Commentary See following page for important disclosures. Before investing in any Longleaf Partners Fund, you should carefully consider the Fund’s investment objectives, risks, charges, and expenses. For a current Prospectus and Summary Prospectus, which contain this and other important information, visit Longleaf Partners Fund . Please read the Prospectus and Summary Prospectus carefully before investing. RISKS The Longleaf Partners Global Fund is subject to stock market risk, meaning stocks in the Fund may fluctuate in response to developments at individual companies or due to general market and economic conditions. Also, because the Fund generally invests in 15 to 25 companies, share value could fluctuate more than if a greater number of securities were held. Investing in non-US securities may entail risk due to non-US economic and political developments, exposure to non-US currencies, and different accounting and financial standards. These risks may be higher when investing in emerging markets. MSCI World Index is a broad-based, unmanaged equity market index designed to measure the equity market performance of 24 developed markets, including the United States. An index cannot be invested in directly. The FTSE Developed Index is a market-capitalization weighted index representing the performance of large and mid-cap companies in Developed markets. The index is derived from the FTSE Global Equity Index Series ( GE IS) which covers 98% of the world’s investable market capitalization. The FTSE Developed Value Index measures the performance of the investable securities in the developed large and mid-cap value segment of the market, which includes companies that are considered more value oriented relative to the overall market. P/V (“price to value”) is a calculation that compares the prices of the stocks in a portfolio to Southeastern’s appraisal of their intrinsic values. The ratio represents a single data point about a holding and should not be construed as something more. P/V does not guarantee future results, and we caution investors not to give this calculation undue weight. “Margin of Safety” is a reference to the difference between a stock’s market price and Southeastern’s calculated appraisal value. It is not a guarantee of investment performance or returns. The S&P 500 Index is an index of 500 stocks chosen for market size, liquidity and industry grouping, among other factors. The S&P is designed to be a leading indicator of U.S. equities and is meant to reflect the risk/return characteristics of the large cap universe. S&P 500 Value Index constituents are drawn from the S&P 500 and are based on three factors: the ratios of book value, earnings, and sales to price. S&P 500 Growth Index constituents are drawn from the S&P 500 and are based on three factors: sales growth, the ratio of earnings change to price, and momentum. The S&P 500 Equal Weight Index is the equal weight version of the S&P 500, where each company is allocated a fixed weight (0.2%) of the index total. Discounted cash flow ('DCF') is a valuation method used to estimate the attractiveness of an investment opportunity. DCF analysis uses future free cash flow projections and discounts them to arrive at a present value estimate, which is used to evaluate the potential for investment. Enterprise value ('EV') is a company’s market capitalization plus debt, minority interest and preferred shares, and less total cash and cash equivalents. Price / Earnings (P/E) is the ratio of a company’s share price compared to its earnings per share. Free Cash Flow ('FCF') is a measure of a company’s ability to generate the cash flow necessary to maintain operations. Generally, it is calculated as operating cash flow minus capital expenditures. Earnings per share ('EPS') is the portion of a company's net income allocated to each share of common stock. EBITDA is a company’s earnings before interest, taxes, depreciation and amortization. As of December 31, 2023, the top ten holdings for the Longleaf Partners Global Fund: EXOR, 6.2%; Affiliated Managers Group, 5.3%; Kellanova, 4.8%; CNX Resources, 4.8%; FedEx, 4.8%; Prosus, 4.8%; Live Nation Entertainment, 4.7%; IAC, 4.7%; Bio-Rad, 4.6% and MGM Resorts, 4.6%. Fund holdings are subject to change and holdings discussions are not recommendations to buy or sell any security. Current and future holdings are subject to risk. Funds distributed by ALPS Distributors, Inc. |
Editor's Note: The summary bullets for this article were chosen by Seeking Alpha editors.
For further details see:
Longleaf Partners Global Fund Q4 2023 Commentary