DFH - M/I Homes: Thriving Despite Sectoral Challenges
Summary
- MHO has favorable positioning in a challenging housing market.
- Consistent operational excellence makes the business stronger over time.
- Successive positive surprises on housing market indicators suggest mispriced expectations.
- MHO is undervalued; it trades at a 14.6% valuation discount vs. peers.
- Technicals also suggest a bullish outlook.
Introduction
Prima facie, the housing sector seems like a terrible place to be with interest rates high, a hawkish Fed and affordability at decadal lows. But it is precisely within these sectors that value is often found. In this piece, I discuss a small $1.3 billion market cap company that is involved in development and construction of residential single-family homes targeted towards the American mass-market. The stock is M/I Homes ( MHO ).
Investment Thesis
Like a milking stool , my case rests on four legs:
- MHO has favorable positioning in a challenging housing market
- Consistent operational excellence makes the business stronger over time
- Successive positive surprises on housing market indicators suggest mispriced expectations
- MHO is undervalued
MHO has favorable positioning in a challenging housing market
Mix of Business
As of 3Q FY22 , 57% of MHO's sales came from Southern and Mid-Atlantic home building operations:
MHO Sales Mix (Company Filings, Author's Analysis)
In terms of more detailed geographic exposure, the company does not disclose the numbers, but it does give us the locations and its market position, which helps us ascertain scale:
MHO Operational Locations (MHO November 2022 Investor Presentation)
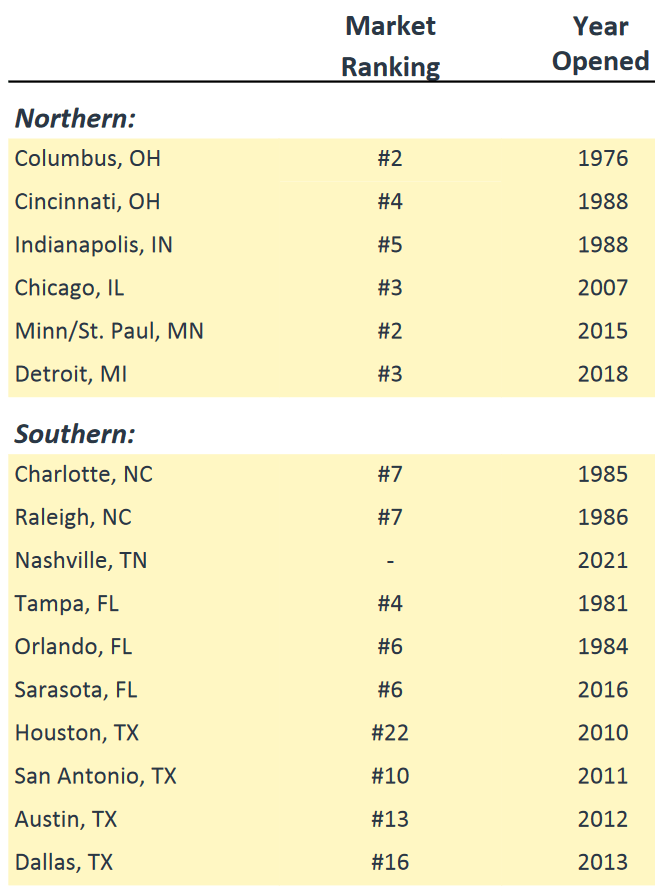
Make a mental note of the moderate exposure to Florida, North Carolina, Texas and Tennessee. This becomes important later...
Given that mix of business info, let's now dig into the growth and margin characteristics:
Growth
The total YoY sales growth for MHO has been steadily increasing over recent quarters:
Sales growth YoY (Company Filings, Author's Analysis)
Digging a little deeper, we find that the Southern and Mid-Atlantic operations have been a major driver of this increase; in 3Q FY22, the company printed a sharp increase of 19.5% YoY growth:
Southern and mid-Atlantic homebuilding sales growth YoY (Company Filings, Author's Analysis)
This has mostly been due to strong relocation trends, especially to Florida as data from Redfin for the August 2022 - October 2022 suggests. Moreover, data from Visual Capitalist suggests that MHO's mix of Southern states rank favorably in terms of home price growth; Florida ranks #1, Tennessee #4, North Carolina #8 and Texas #17. This is advantageous to MHO given the higher mix of sales to the Southern states. Indeed, this is seen in the margin expansion profile as well:
Margins
Overall gross profit margins have increased from low-20% levels to high-20% levels over the last few quarters:
Company gross profit margins (Company Filings, Author's Analysis)
Northern home-building gross profit margins continue to be range-bound in the low-teens:
Northern homebuilding gross profit margins (Company Filings, Author's Analysis)
Thus, the narrative checks out that the Southern and Mid-Atlantic homebuilding segment is what is responsible for overall gross profit margin expansion, driven by higher prices:
Southern and mid-Atlantic homebuilding gross profit margins (Company Filings, Author's Analysis)
Takeaway
Overall, this analysis suggests that MHO has favorable exposure to the best segments of the US residential housing markets.
Consistent operational excellence makes the business stronger over time
MHO's gross margins have improved by 670bps from an average of 20.2% in the 3Q FY12 to 2Q FY20 time period till 3Q FY22:
Gross profit margins (Company Filings, Author's Analysis)
The key driver of this improvement would be driven by pricing, especially in the last few quarters, when inflation would have dragged down costs and hence been a margin headwind.
Unlike other industries such as software, one must be cautious of expecting pricing improvements to be secular due to the highly cyclical nature of real estate markets and home prices.
Hence, to assess MHO's degree of structural margin improvement, we must look at EBIT margins:
EBIT margins (Company Filings, Author's Analysis)
As can be seen in the chart above, MHO's operating profit margins, unlike its gross profit margins have always been in an increasing trend. Since 3Q FY12 till 3Q FY22, EBIT margins have seen a 1060bps increase. Conservatively assuming that the entire gross margin improvement is due to pricing that is not sustainable over the longer term, this implies a steady 390bps structural margin improvement over the last 10 years.
Another way to clearly visualize this is by looking at operating costs below COGS as a % of revenue:
Operating costs as % of revenue (Company Filings, Author's Analysis)
The steady decline in this figure is a testament to management's ability to consistently improve the operational profile of the business.
Successive positive surprises on housing market indicators suggest mispriced expectations
The chart below from myfxbook depicts the United States' New Home Sales MoM growth rates:
United States New Home Sales MoM change (myfxbook)
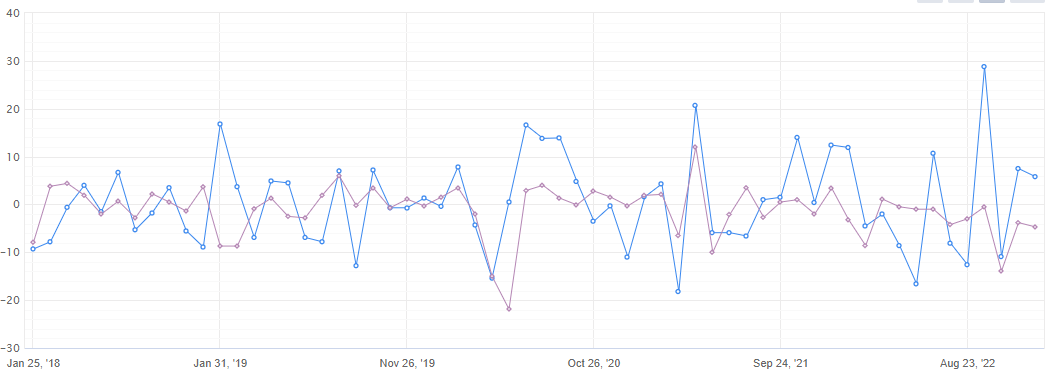
The blue data series depicts the actual figures. The purple data series depicts consensus estimates.
For the past 4 months, the actual print has been above consensus expectations. Moreover, the chart below shows the absolute new home sales data:
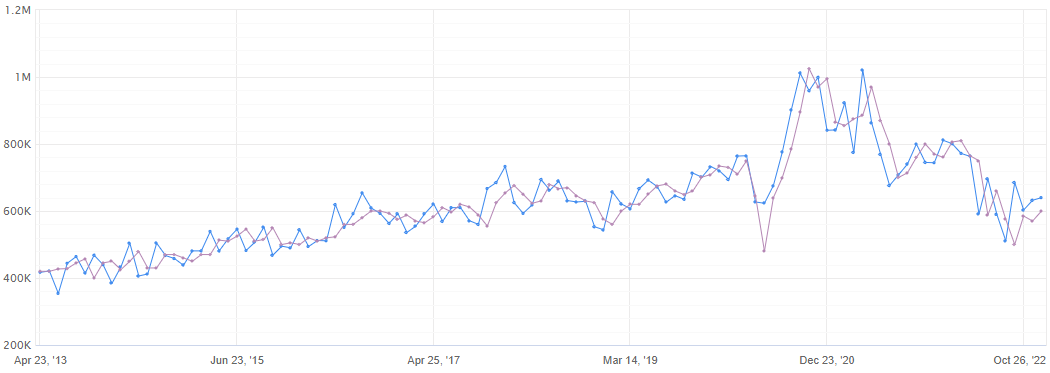
The blue data series depicts the actual figures. The purple data series depicts consensus estimates.
As can be seen in the chart above, new home sales have come back down to pre-pandemic run rate levels at a bit over 600 thousand. If one considers this to represent more normalized levels after the liquidity excess in the last couple of years, then this may make the case for stable levels going forward. This would help boost MHO's top-line.
MHO is undervalued
LTM EV/EBITDA (Company Filings, Author's Analysis)
Peers set includes Meritage Homes Corporation ( MTH ), Century Communities ( CCS ), M.D.C. Holdings ( MDC ), Beazer Homes USA ( BZH ), Skyline Champion Corporation ( SKY ), Tri Pointe Homes ( TPH ), Taylor Morrison Home Corporation ( TMHC ), KB Home ( KBH ), Hovnanian Enterprises ( HOV ) and Dream Finders Homes ( DFH ).
As can be seen from the chart above, MHO trades at a LTM EV/EBITDA of 3.5x. This is at a 14.6% discount to the median multiple of 4.1x.
As I think the business is positioned rather well from a fundamental perspective, I believe it deserves at least a median valuation multiple, if not more. Hence, I can expect at least ~15% upside in the stock.
Wisdom of the Crowds Analysis
I am a big believer in the wisdom of crowds . In my experience, I have found that the footprints of the crowd sentiment can be detected reliably by analyzing the historical price and volume prints. Indeed, this is what has enabled me to generate alpha in my investment account (see my bio for more details).
If this is your first time reading a Hunting Alpha article using Technical Analysis, you may want to read this post , which explains how and why I read the charts the way I do, utilizing principles of Flow, Location and Trap.
Relative Read of MHO vs. S&P 500
MHO vs S&P500 Technical Analysis (TradingView, Author's Analysis)
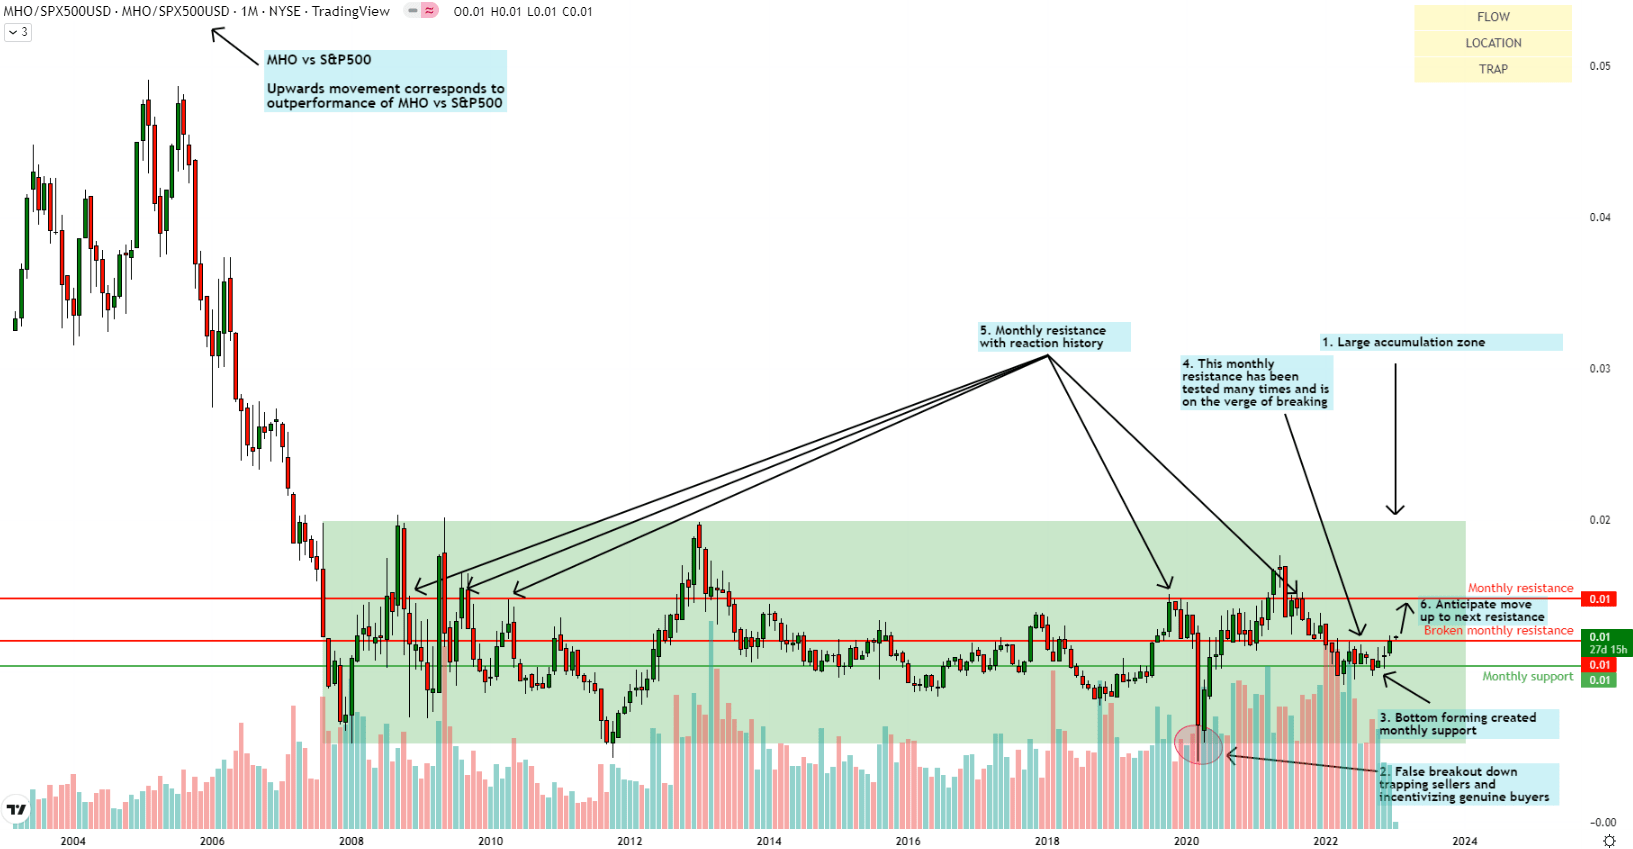
On the relative chart of MHO vs. S&P 500, I identify an extended accumulation range since 2008. In early 2020, there was a false breakout down, trapping sellers and premature buyers. According to my read, this opens up the way for buys.
More recently, buyers have been forming a bottom and the immediate resistance has been tested multiple times and I believe it is about to break. I anticipate a sharp move up towards the next monthly resistance.
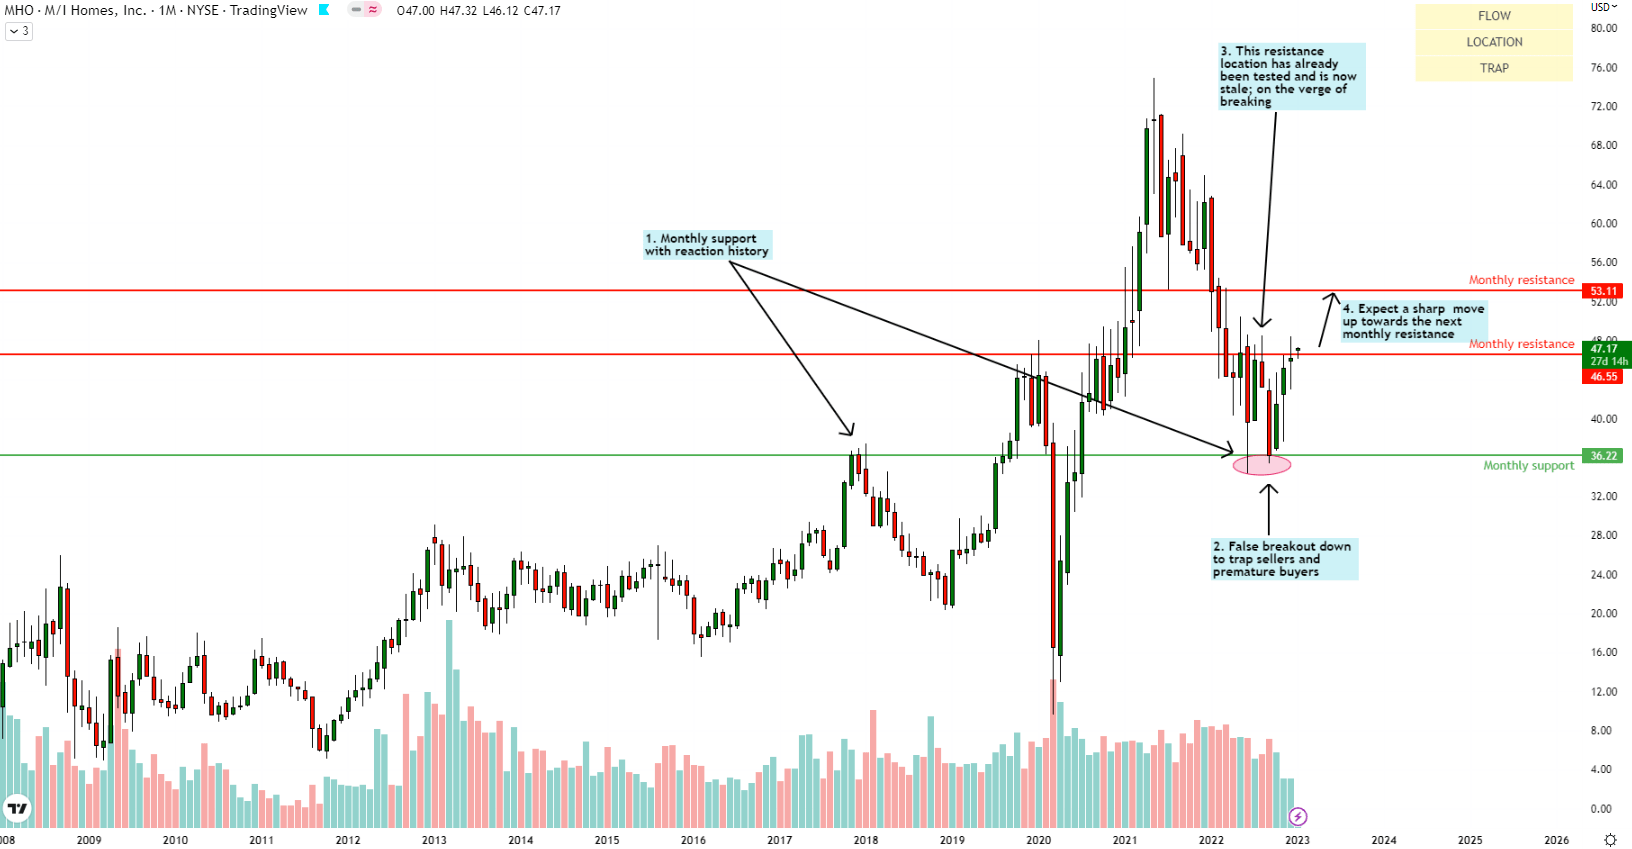
Standalone Read of MHO
MHO Technical Analysis (TradingView, Author's Analysis)
MHO has bounced off monthly support at $36.22 and has tested the immediate resistance at $46.55 a few times. I believe it is on the cusp of a breakout to the upside toward the monthly resistance at $53.11.
Risks & Monitorables
On the company's side, in 3Q FY22 , I note that new orders have fallen 31% YoY and the cancellation rate of orders has also increased sequentially from 11.0% to 17.0%. Further deterioration of these figures would not bode well for MHO's future top-line and hence would be a risk to monitor.
I believe the leading indicators of this company specific risk would be the monthly new home sales data. Hence, it is important to monitor this variable too.
Takeaway & Positioning
MHO has proven itself to be strong operator in its industry. Its business has favorable positioning in the current housing market downturn, for which leading indicators and consecutive bullish surprises suggest a bottoming out of the sector. From a valuations perspective, it is trading at almost a 15% discount to the median of its peer set, which I believe should re-rate higher towards median levels. Finally, the technicals are also pointing bullish.
Thus, I believe MHO is an attractive 'buy'.
For further details see:
M/I Homes: Thriving Despite Sectoral Challenges