PECO - Magnificent Monthly Mailbox Money
2023-09-10 07:00:00 ET
Summary
- Dividend growth is important for long-term stock ownership and has historically outperformed during good and bad times.
- Monthly dividends provide benefits such as dollar cost averaging, compounding opportunities, and minimizing market risk.
- Realty Income, STAG Industrial, LTC Properties, Agree Realty, and Whitestone REIT are our recommended monthly dividend stocks.
When it comes to dividends, I’m all about quality over quantity.
That’s why our team spends so much time analyzing stocks based on these attributes:
- Strength of the Balance Sheet
- Quality of the Income Statement
- Expertise of Management
- Safe Payout Ratio (based on AFFO)
- Portfolio Construction
- Analyst Estimates
That’s why I frequently cite this quote from Josh Peters.
“The safest dividend is the one that’s just been raised”.
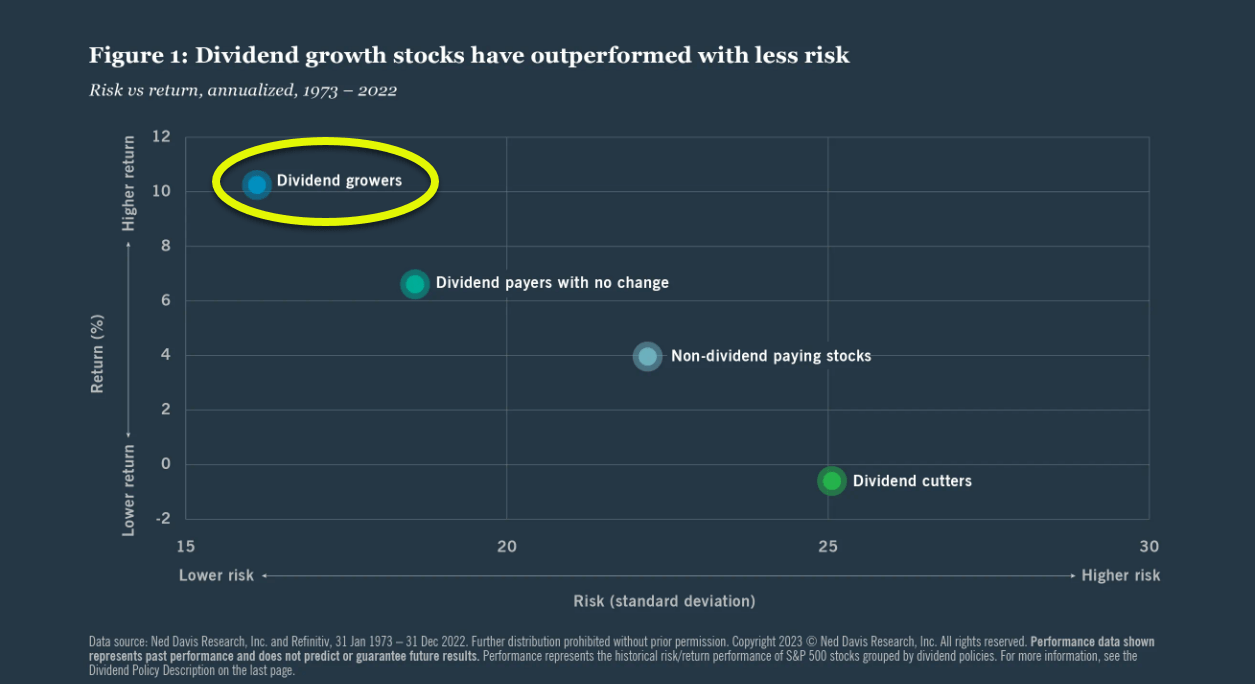
Dividend growth is one of the most important reasons to own stocks because they have historically outperformed during good times and bad.
Over the long-haul dividend growers have generated higher returns with less risk (measured by standard deviation) than companies that maintained, reduced, or cut their dividends.
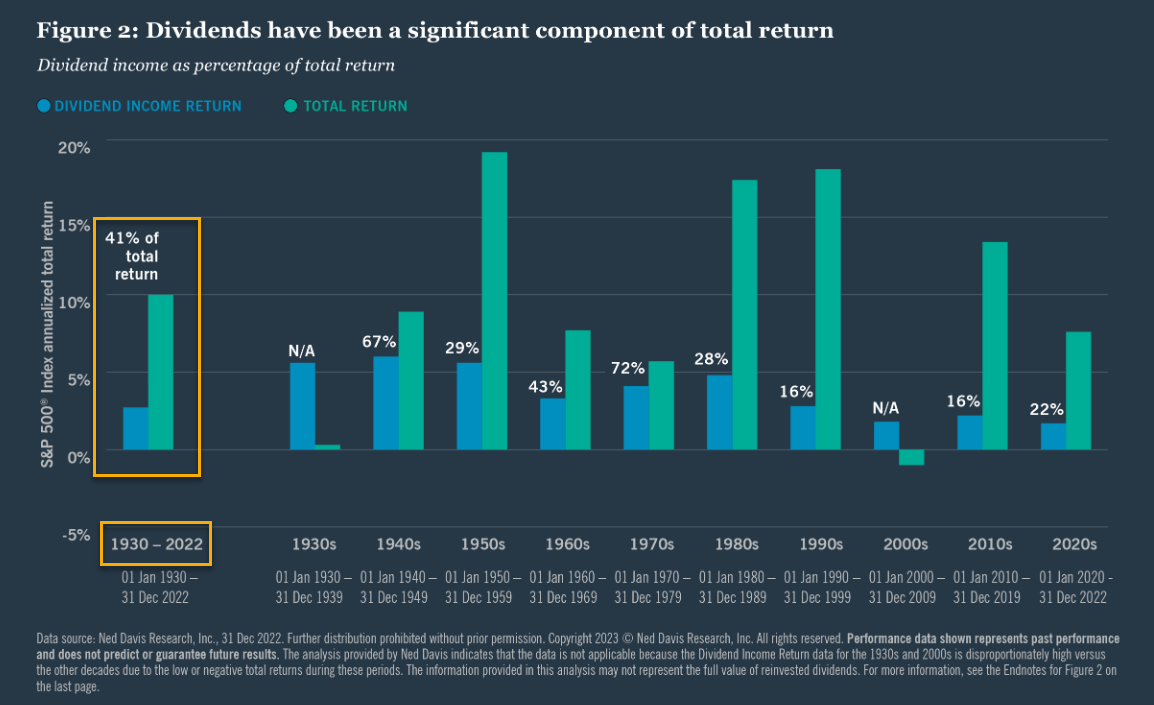
More importantly, dividends are not guaranteed, they have contributed substantially to equity total return over the decades.
In fact, from 1930 to 2021, 40% of the annualized total return of the S&P 500 was derived from the payment and reinvestment of dividends, with capital appreciation contributing the rest.
The dividend income generated may be an essential complement to a strong capital appreciation strategy, as it limits volatility and contributes to total return over time.
Market volatility can cause swings in the price return of a portfolio, but the performance of companies with healthy balance sheets and the financial strength necessary to support dividend growth helps mitigate volatility.
Now that I’ve addressed the quality component, let’s discuss quantity.
The Case for Monthly Dividends
Most stocks in our coverage spectrum pay quarterly dividends.
However, there are a handful that pay monthly.
Here are a few reasons to consider monthly dividends:
- Automatically reinvesting dividends is a benefit of dollar cost averaging.
- Dividends allow more opportunities for compounding to work its magic.
- Dividends minimize market risk.
As I survey readers here on Seeking Alpha, I’ve found that most monthly dividend investors own shares to cover regular bills or grow savings. Having that extra income stream makes budgeting easier and it creates discipline (just like getting a monthly paycheck).
Another way to do the “monthly thing” is to choose quarterly dividend stocks that are staggered over 12 months. Something like this:
- Stock A pays in January, April, and October
- Stock B pays in February, May, and August
- Stock C pays in March. June, September, and December.
Because I was a real estate developer and investor for over three decades I’m biased regarding monthly dividends. I like seeing the checks hit my bank account each month because it puts me in closer contact with the company sending out the checks.
Now let's check out a few of our favorites...
Realty Income ( O )
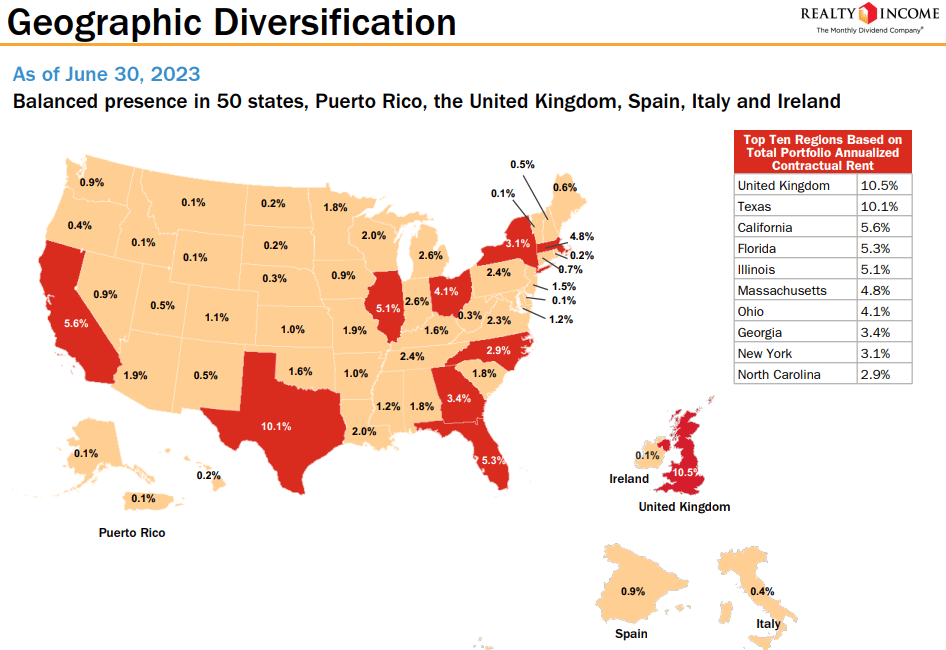
Realty Income, otherwise known as “The Monthly Dividend Company,” is a real estate investment trust (“REIT”) that specializes in single-tenant, free-standing commercial properties that are leased on a long-term, triple-net basis. Their portfolio consists of 13,118 properties that are leased to more than 1,300 tenants doing business in 85 separate industries.
Realty Income’s properties are located in all 50 states and they have a growing international presence with properties in the United Kingdom, Spain, Italy, and Ireland. Retail properties are their largest property type and make up 82.5% of their annualized contractual rent, followed by industrial properties which contributes 13.1% and gaming properties which contributes 2.7%.
As of the end of the second quarter, Realty Income’s portfolio had a weighted average remaining lease term of 9.6 years and an occupancy rate of 99.0%.
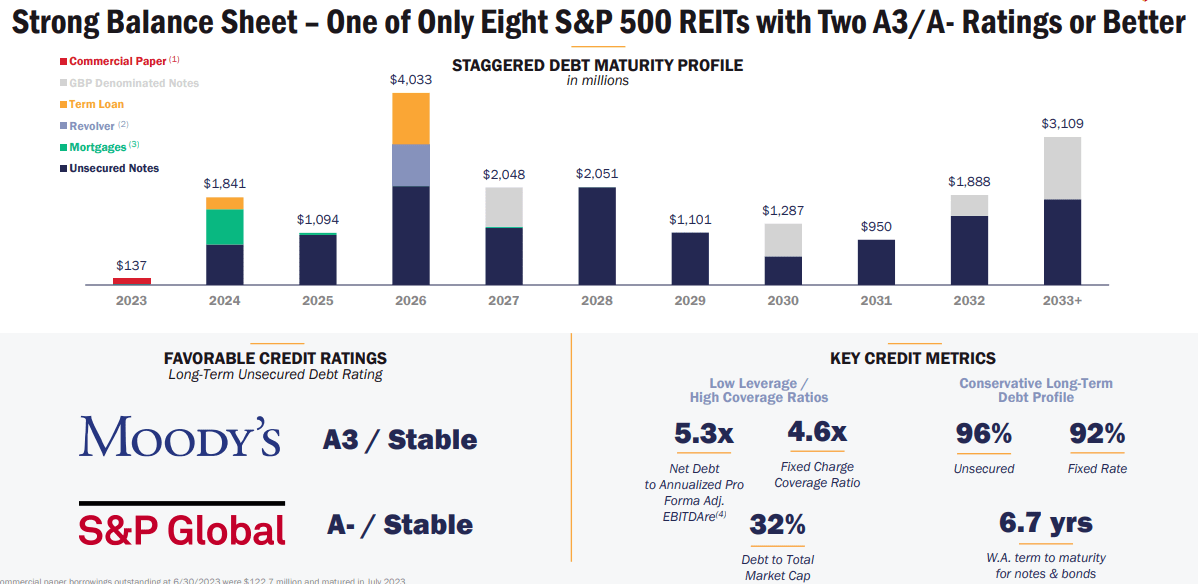
Realty Income has an investment-grade balance sheet with an A- credit rating from S&P Global. They have strong debt metrics including a net debt to pro forma adjusted EBITDAre of 5.3x, a long-term debt to capital ratio of 40.64%, and a fixed charge coverage ratio of 4.6x.
Their debt is 96% unsecured, 92% fixed rate and has a weighted average term to maturity of 6.7 years. At the end of the second quarter, Realty Income had $3.5 billion of liquidity which consisted of $253.7 million in cash and equivalents and roughly $3.3 billion of availability under their revolving credit facility.
Realty Income is well-known for the monthly dividend they pay and with good reason as they have paid 638 consecutive monthly dividends throughout their 54-year operating history and are a Dividend Aristocrat having increased their dividend for 29 consecutive years.
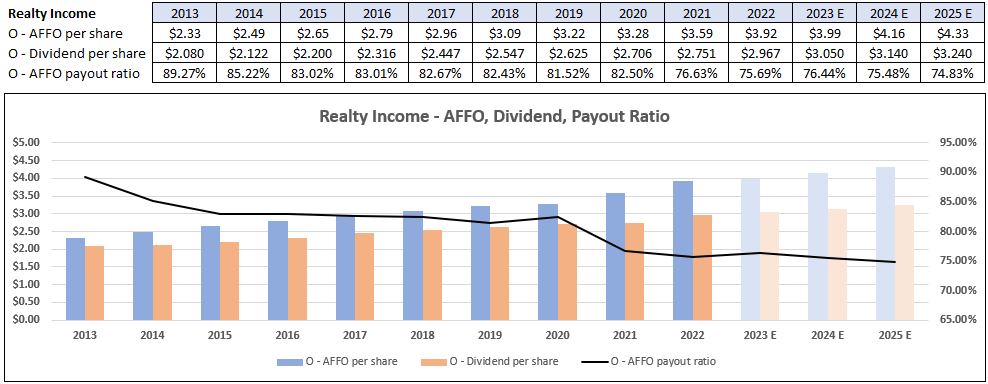
Realty Income has a history of raising their dividend on a quarterly basis and have raised it for 103 consecutive quarters, and 121 times since their public listing in 1994. Currently, they pay a 5.55% dividend yield that is well covered with a 2022 year-end AFFO payout ratio of 75.69%.
As seen in the graph below, Realty Income has significantly improved their AFFO payout ratio over the last 10 years, going from 89.27% in 2013 to 75.69% in 2022. Analyst expect dividend growth of 2.80% in 2023 which would put their forward 2023 AFFO payout ratio at 76.44%.
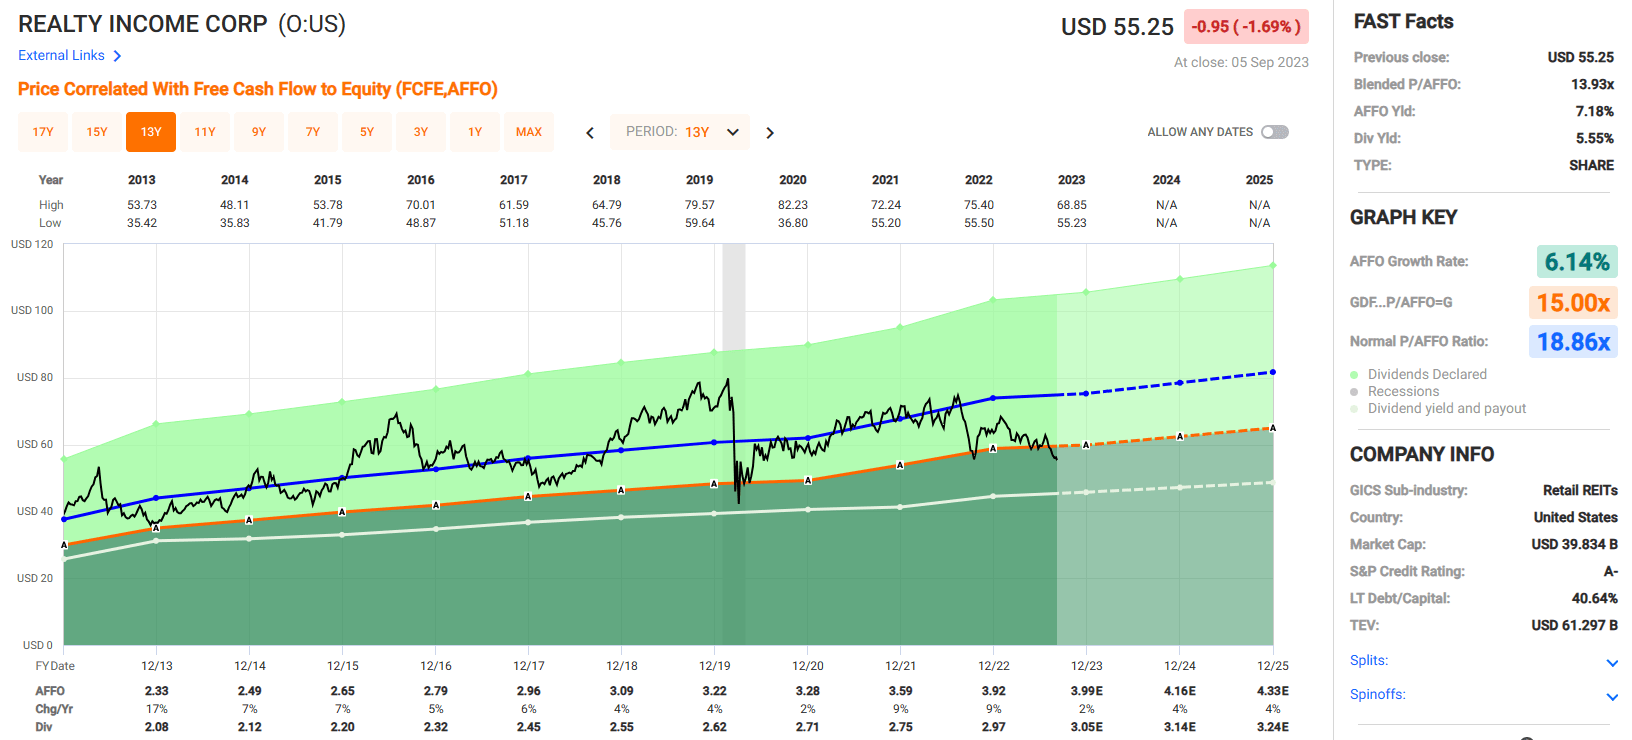
Realty Income is currently trading at a deep discount with a current P/AFFO ratio of 13.93x compared to their 10-year average AFFO multiple of 18.86x. They are trading approximately 7% under their net asset value (“NAV”) with a P/NAV ratio of 0.93x and the stock is paying the highest yield in recent memory.
As previously mentioned, the stock currently pays a 5.55% dividend yield compared to their 10-year average dividend yield of 4.63%. Between their price multiple, their discount to NAV, and their above average dividend yield, this blue-chip REIT is currently priced at a very attractive valuation.
We rate Realty Income a Buy.
STAG Industrial ( STAG )
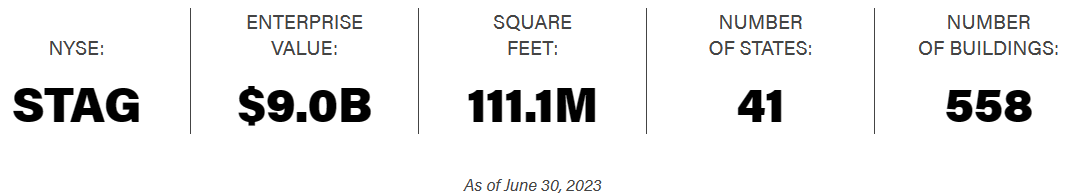
STAG Industrial is a REIT that owns light manufacturing and industrial warehouses that are primarily leased to a single tenant. STAG owns or has an ownership interest in 558 properties that covers approximately 111.1 million square feet with properties located in 41 states across the U.S.
As of the end of the second quarter STAG’s total portfolio achieved an occupancy rate of 97.7% with a weighted average remaining lease term of 4.6 years.
They are well-diversified by tenant, market, and industry with their top tenant (Amazon) only contributing 2.8% of their annualized base rent (“ABR”), their top market (Chicago) only making up 7.0% of their ABR, and their top industry (Air Freight & Logistics) only making up 11.4% of their ABR.
While many industrial REITs and institutional investors tend to focus on properties in certain primary markets, STAG targets individual industrial properties across many markets within the U.S., including middle markets where their competition tends to be local investors that do not have the same access to debt or equity capital, giving STAG a competitive advantage in these markets. This past May, STAG was added to the S&P MidCap 400 index.
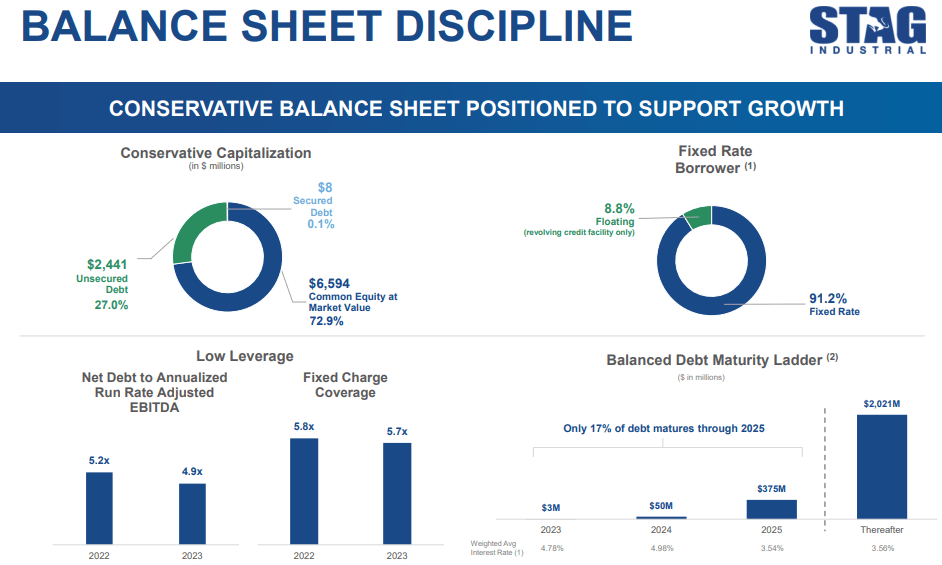
STAG is investment-grade with a Baa3 credit rating from Moody’s and a BBB credit rating from Fitch. They have solid debt metrics including a net debt to adjusted EBITDA of 4.9x, a long-term debt to capital ratio of 42.59%, and a fixed charge coverage ratio of 5.7x.
Their debt is 91.2% fixed rate with a weighted average interest rate of 3.59% and a weighted average term to maturity of 4.9 years. STAG has no material debt maturities until late 2024 and had $794.2 million of liquidity as of the end of the second quarter.
STAG filed its initial public offering in 2010 and paid a quarterly dividend up until September of 2013. In October 2013, STAG changed its dividend policy to make monthly distributions and the company has paid consecutive monthly dividends since that time.
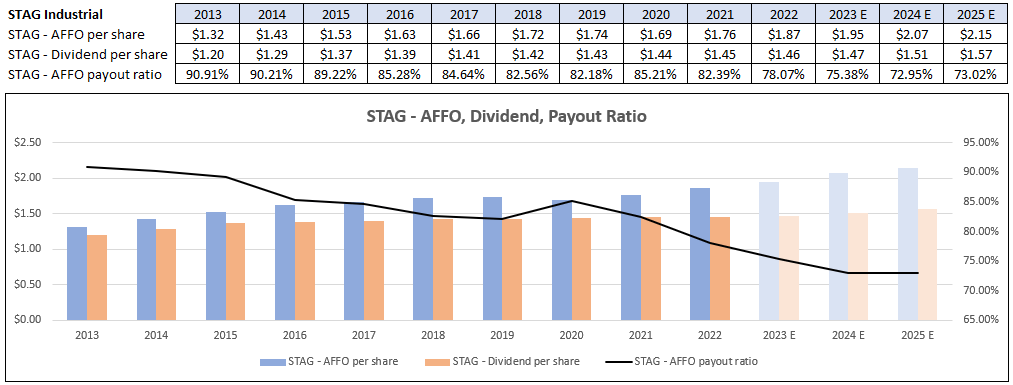
STAG has a 10-year average dividend growth rate of 3.22%, but their dividend growth has slowed in recent years with dividend increases of under 1% since 2019. While recently their dividend growth has been lackluster, the company currently pays a high dividend yield of 4.06% that is well covered with an AFFO payout ratio of 78.07%.
Their AFFO payout ratio has dramatically improved over the years, going from 90.91% in 2013, to 78.07% in 2022 and analysts project this metric to continue to improve with 2024 AFFO per share estimated at $2.07 and STAG’s 2024 dividend estimated at $1.51, for a projected AFFO payout ratio of 72.95% in 2024.
Additionally, STAG has never suspended or reduced its dividend and has raised it each year since they became a publicly traded company.
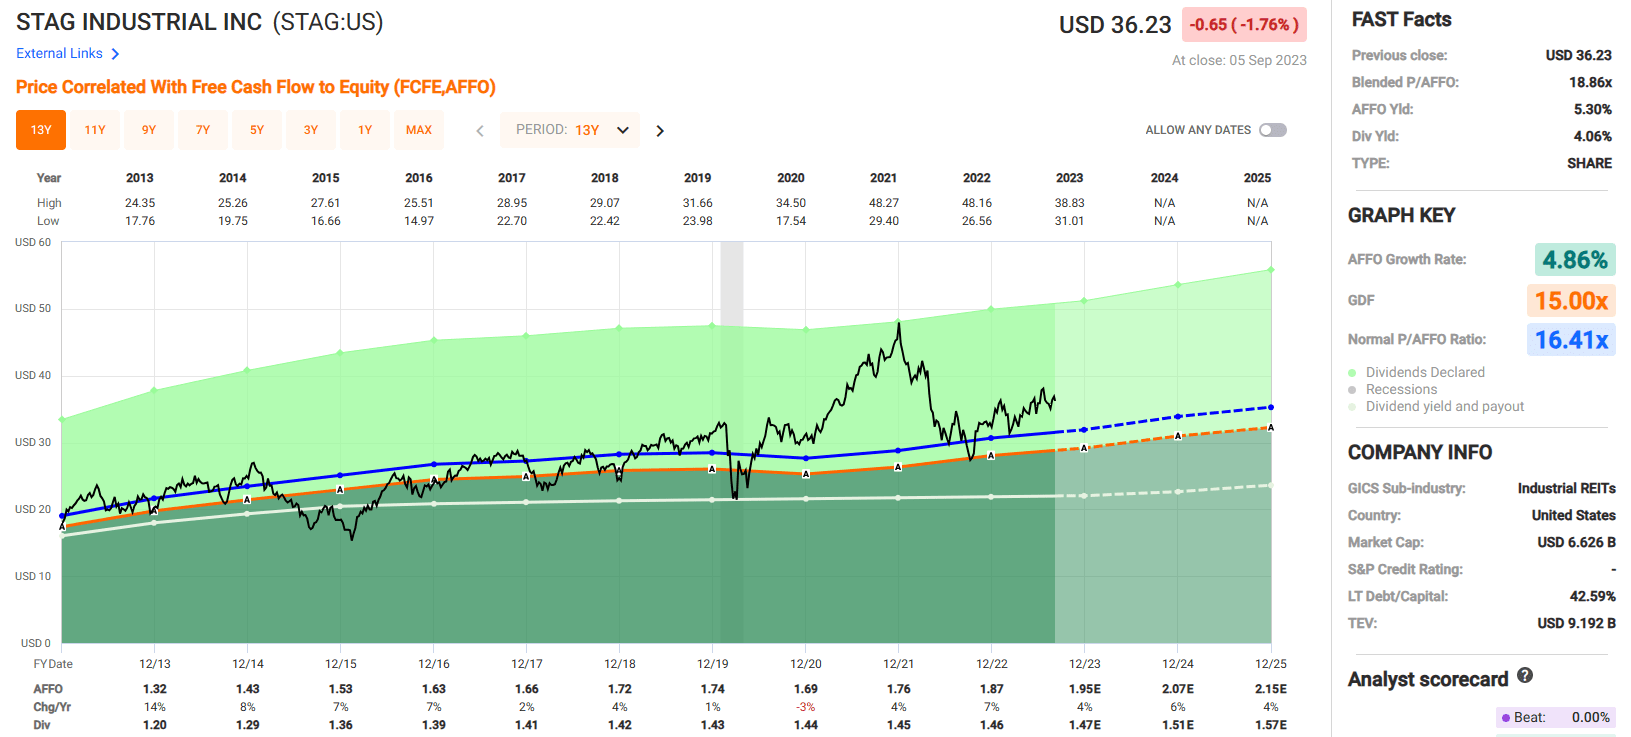
STAG has solid fundamentals including a strong balance sheet and a conservative payout ratio, but the stock is currently trading at a premium multiple to its 10-year average. STAG currently trades at a P/AFFO of 18.86x, compared to its 10-year average AFFO multiple of 16.41x.
While there is a lot to like about STAG, we feel there are better deals to be had, especially considering how much REITs have sold off over the last 2 years. We recommend investors wait for a pull-back in price before buying shares and have a Buy Under target of $35.00 per share.
We rate STAG Industrial a Hold.
LTC Properties ( LTC )
LTC Properties is a healthcare REIT that invests in skilled nursing facilities and senior housing through sale-leasebacks, joint-ventures, mortgage financing, and structured financing solutions including mezzanine lending and preferred equity. LTC receives rental income from its owned properties and interest income through their loan products.
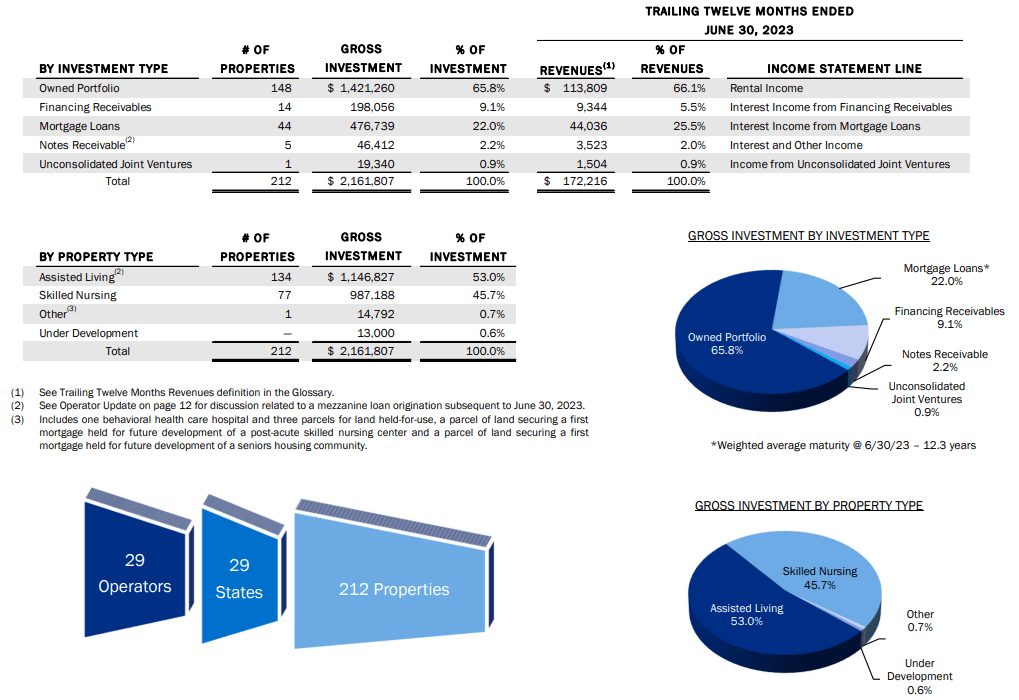
Their owned portfolio consist of 148 properties that makes up 65.8% of their investments and provides 66.1% of their revenues through rental income. Their second largest category is mortgage loans which makes up 22.0% of their investments and provides 25.5% of their revenue through interest income, followed by financing receivables and notes receivables which provides 5.5% and 2.0% of their revenue respectively.
By property type, LTC is pretty evenly split between assisted living and skilled nursing facilities with assisting living properties representing 53.0% of their investments and skill nursing properties representing 45.7% of their investments.
LTC does not have an investment grade credit rating through S&P or Moody’s, however they do have an investment grade rating from the National Insurance Company Rating agency.
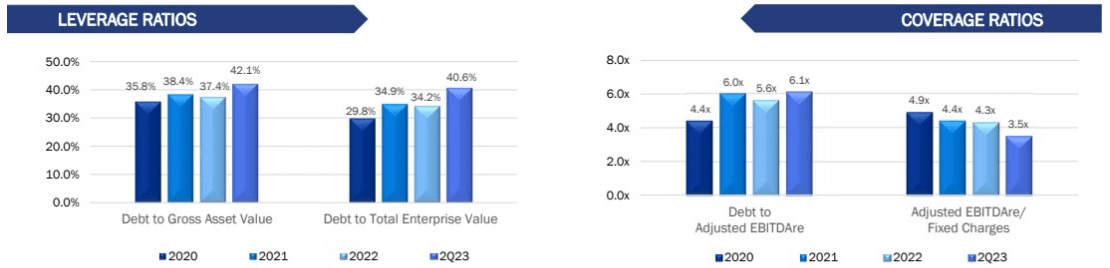
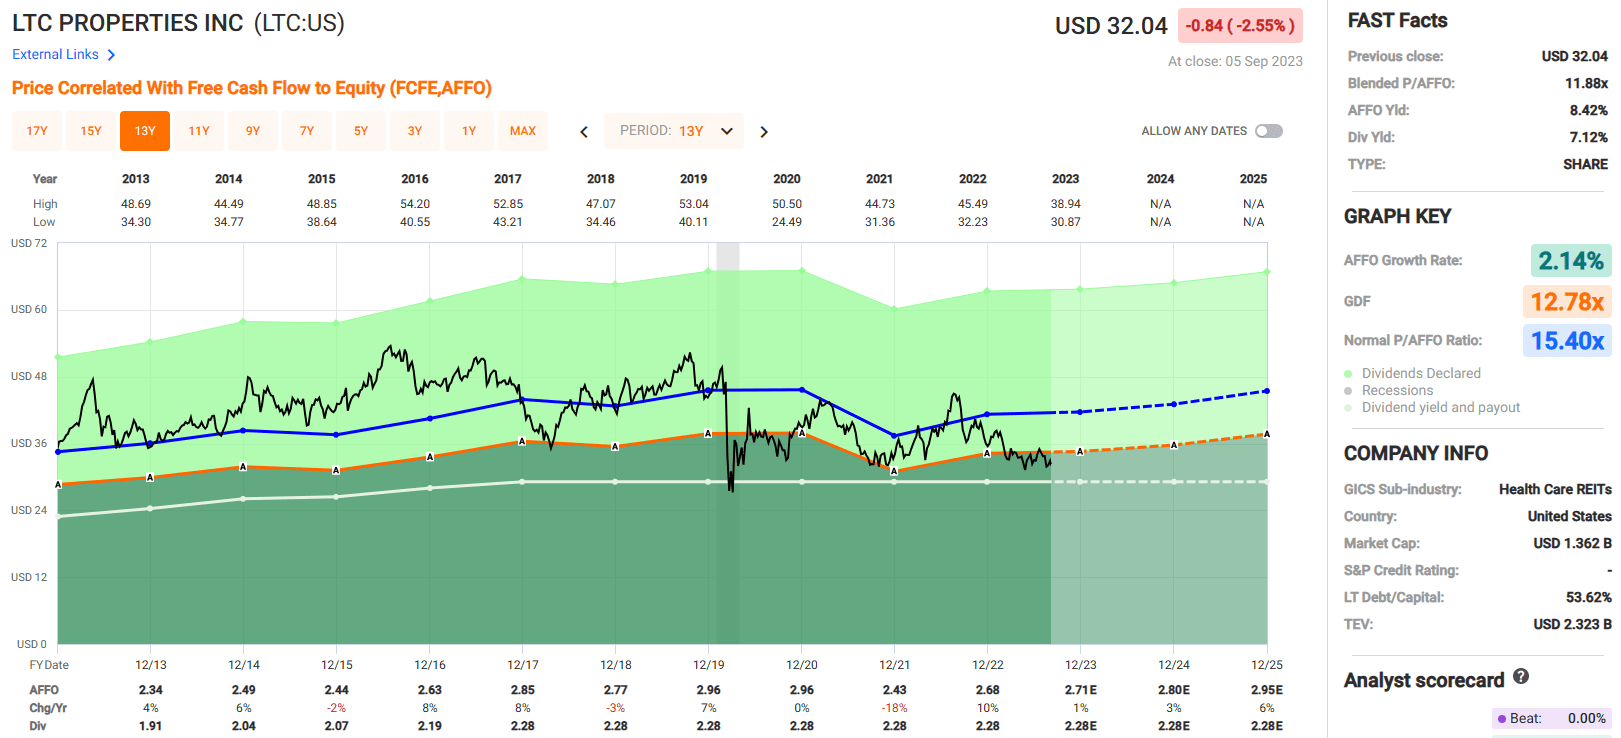
They have sound debt metrics with a debt to gross asset value ratio of 42.1%, a long-term debt to capital ratio of 53.62%, a debt to adjusted EBITDAre of 6.1x, and an adjusted EBITDAre to fixed charges ratio of 3.5x.
Only 4.0% of their debt matures in 2023 and only 5.1% matures in 2024, but 44.6% of their total debt matures in 2025 which will likely need to be refinanced at some point in the near future.
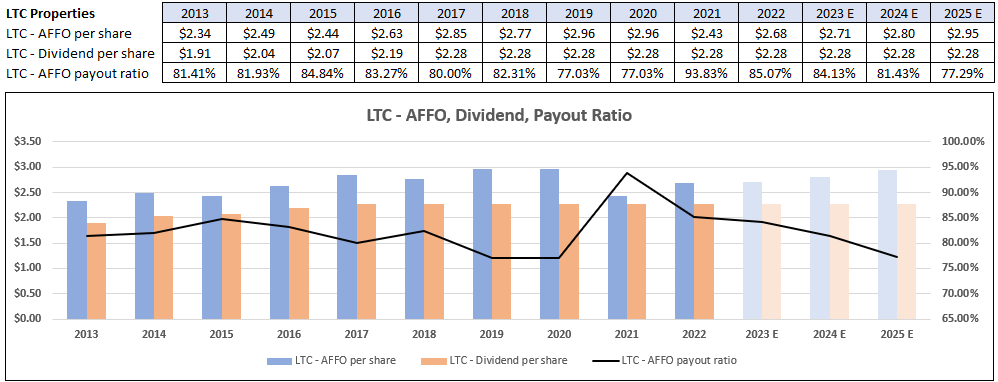
LTC currently pays a monthly dividend of $0.19 per share or $2.28 per share annually. They have not consistently raised their dividend each year, but they have either raised or maintained their dividend each year since at least 2009. LTC paid a dividend of $1.91 per share in 2013 which was increased to $2.28 by 2017.
However, LTC has not raised their dividend since that time and continues to pay a dividend of $2.28 per share. While there has been no dividend growth over the last several years, the company already pays a high dividend yield of 7.12% that is covered with an AFFO payout ratio of 85.07%.
Their AFFO payout ratio jumped to almost 94% in 2021 due to an 18% decline in AFFO that year, but their earnings recovered to some extent in 2022, pushing the AFFO payout ratio down to 85.07%.
Analysts expect AFFO to grow to $2.95 per share by 2025 which would put the AFFO payout ratio at 77.29%, assuming the dividend rate remains unchanged.
Currently LTC is trading at a P/AFFO of 11.85x which is a significant discount to their 10-year average AFFO multiple of 15.40x. In relation to their AFFO the stock rarely trades at such a low multiple.
The stock traded at a lower multiple during the Great Recession, for a brief period in 2011, and during the covid crash, but generally speaking this is the most attractive valuation the stock has traded at in over a decade.
Likewise, the current dividend yield is well above its average levels with a current yield of 7.12% compared to their 10-year average dividend yield of 5.93% and their 5-year average dividend yield of 6.09%.
While LTC’s growth rates have not been exceptional, the stock is trading at a discounted valuation and offers an attractive yield and we believe this could be a good opportunity to buy shares.
We rate LTC Properties a Buy.
Agree Realty ( ADC )
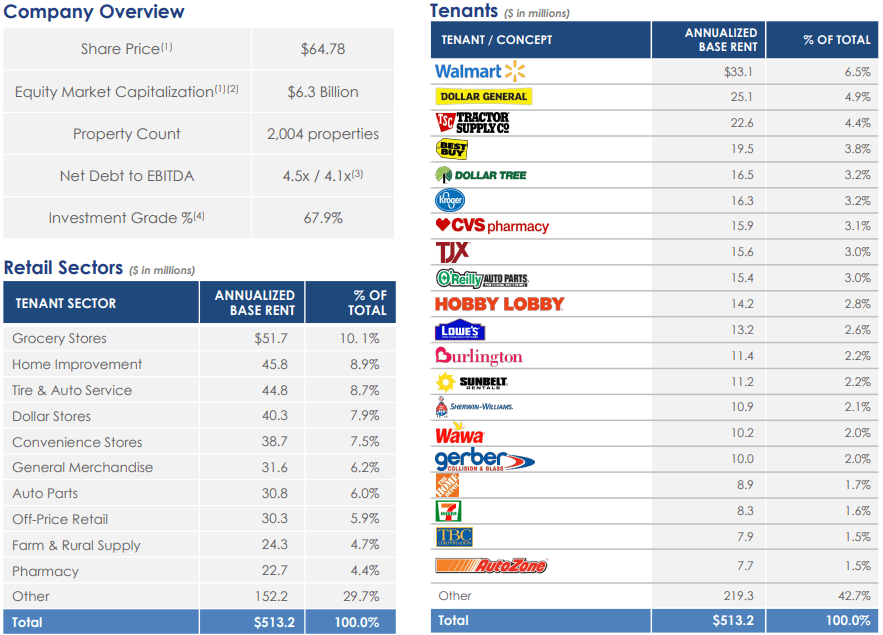
Agree Realty is a REIT that invests in free-standing retail properties that are leased on a net-basis. They own or have an ownership interest in 2,004 properties covering approximately 41.7 million square feet of gross leasable area and their properties are located across 49 states.
Their portfolio has a weighted average lease term of roughly 8.6 years and is approximately 99.7% leased. ADC has a very strong tenant roster which includes names such as Walmart, Tractor Supply, Kroger, Best Buy, and Dollar General.
In total 67.9% of their ABR is derived from investment grade tenants, or from tenants whose parent company is investment grade. As a percentage of ABR, their largest 3 retail sectors are grocery stores which makes up 10.1% of their ABR, home improvement stores which makes up 8.9%, and tire & auto service which makes up 8.7% of their ABR.
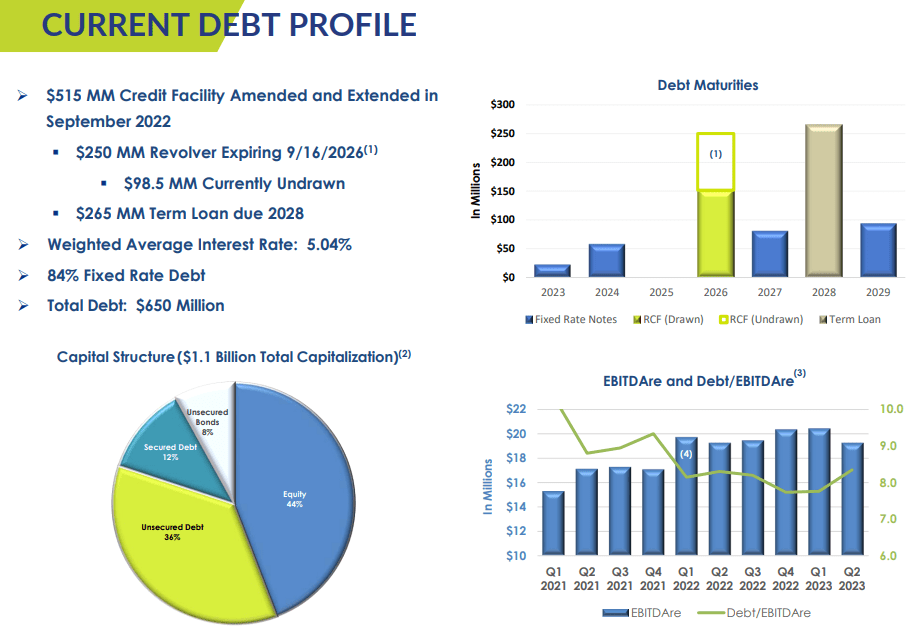
Agree Realty has an investment-grade balance sheet with a BBB credit rating from S&P. They have excellent debt metrics including a net debt to EBITDA of 4.5x, a long-term debt to capital ratio of 30.64%, and a fixed charge coverage ratio of 5.1x.
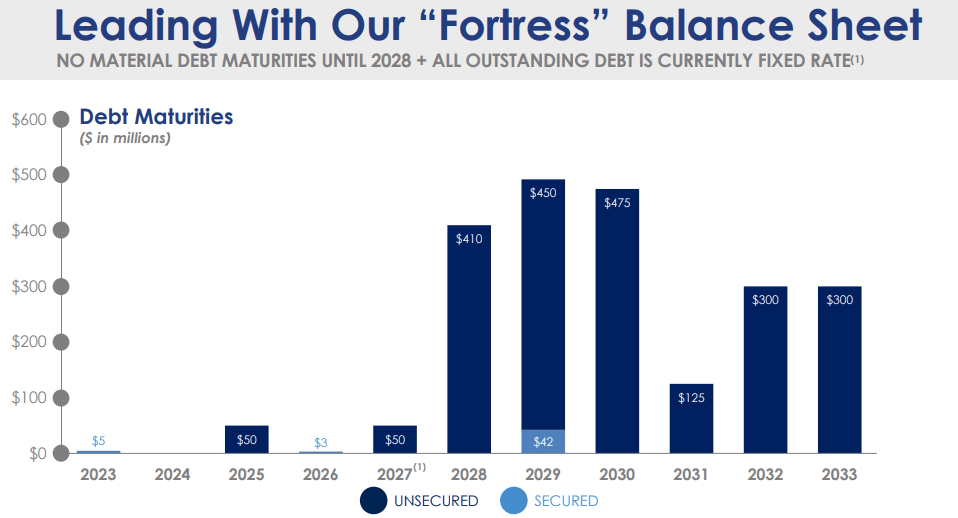
All of their outstanding debt is currently fixed rate with no significant debt maturities until 2028 and the company has approximately $1.3 billion of liquidity as of July 31, 2023.
ADC has had an excellent dividend track record since it went public in 1994. The company initially paid a quarterly dividend but changed its policy to pay a monthly dividend in 2021. Prior to the change Agree Realty paid 107 consecutive quarterly dividends from 1994 to 2020 and since the change ADC has paid 31 consecutive monthly dividends.
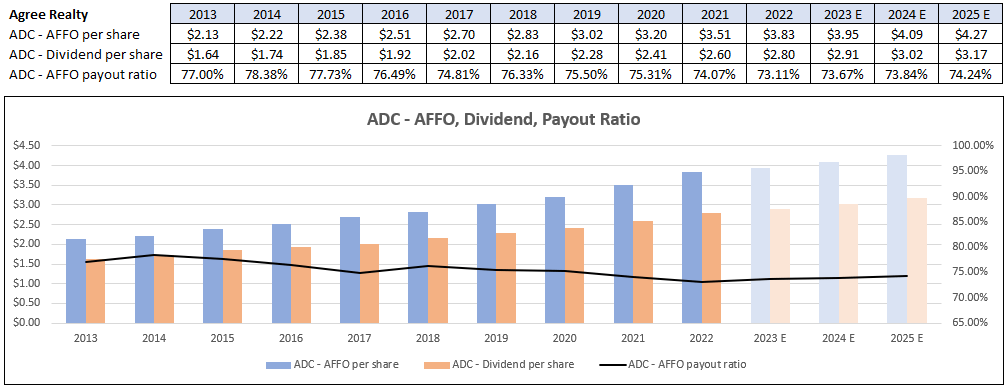
Additionally, they have increased their dividend each year since 2013 and have an average dividend growth rate of 5.79% over the last 10 years. ADC has also maintained a conservative AFFO payout ratio over the past decade, with the payout ratio being held under 80% since 2013.
Currently the stock pays a 4.85% dividend yield that is well covered with a 2022 year-end AFFO payout ratio of 73.11%, and a projected 2023 AFFO payout ratio of 73.67%.
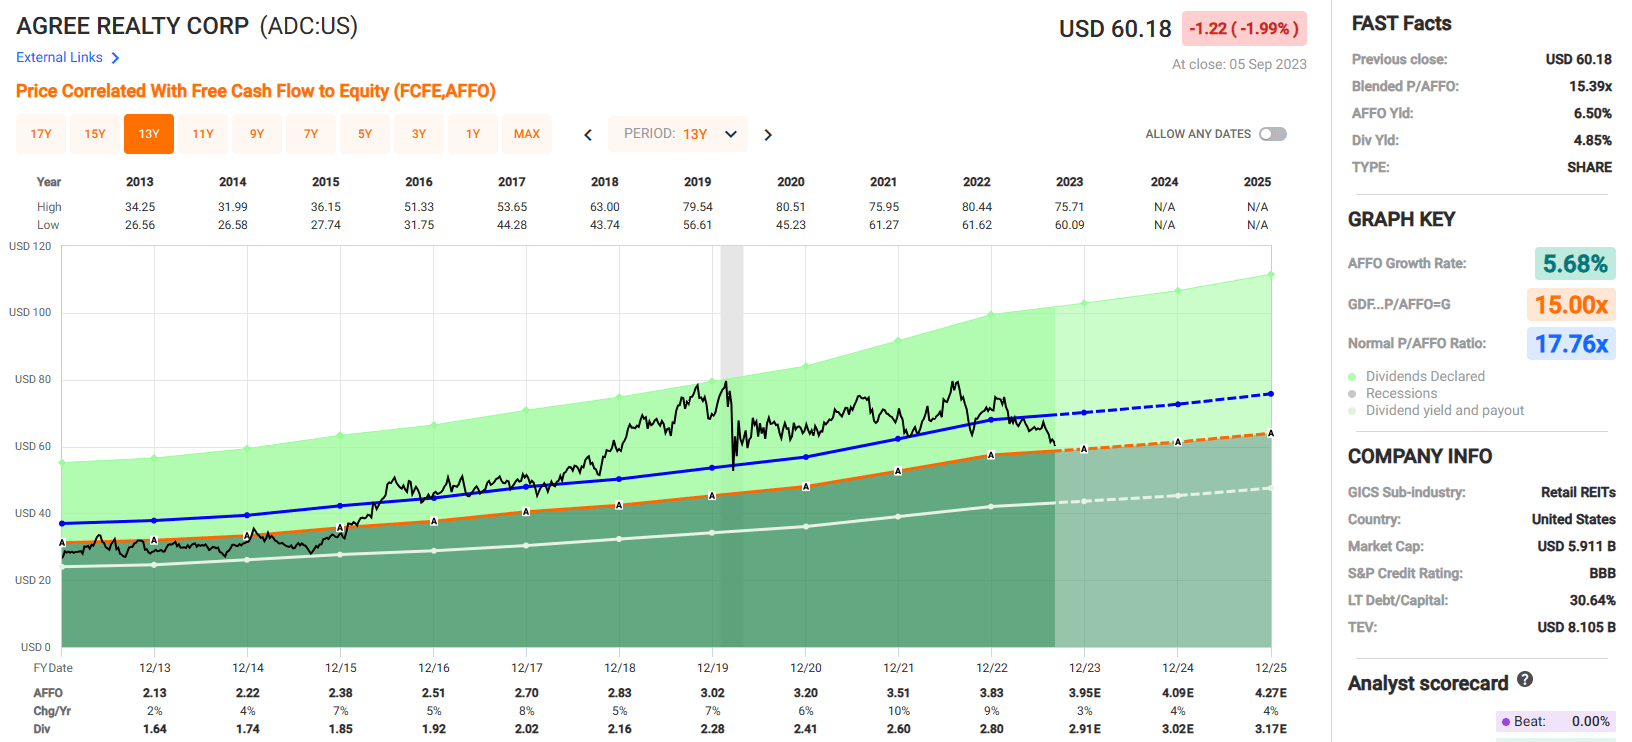
Agree Realty rarely goes on sale but it is currently priced at a discount, trading at a P/AFFO of 15.39x compared to their 10-year average AFFO multiple of 17.76x. The stock is also trading at a slight discount to its net asset value with a P/NAV ratio of 0.96x. This compares with their 2021 year-end P/NAV of 1.13x and their 2022 year-end P/NAV of 1.17x.
The stock is also trading at a discount as it relates to their dividend with the stock currently yielding 4.85% compared to ADC’s 10-year dividend yield average of 4.19% and their 5-year dividend yield average of 4.04%. On all counts this is a high quality REIT trading at an attractive valuation that pays a high yield on a monthly basis.
We rate Agree Realty a Buy.
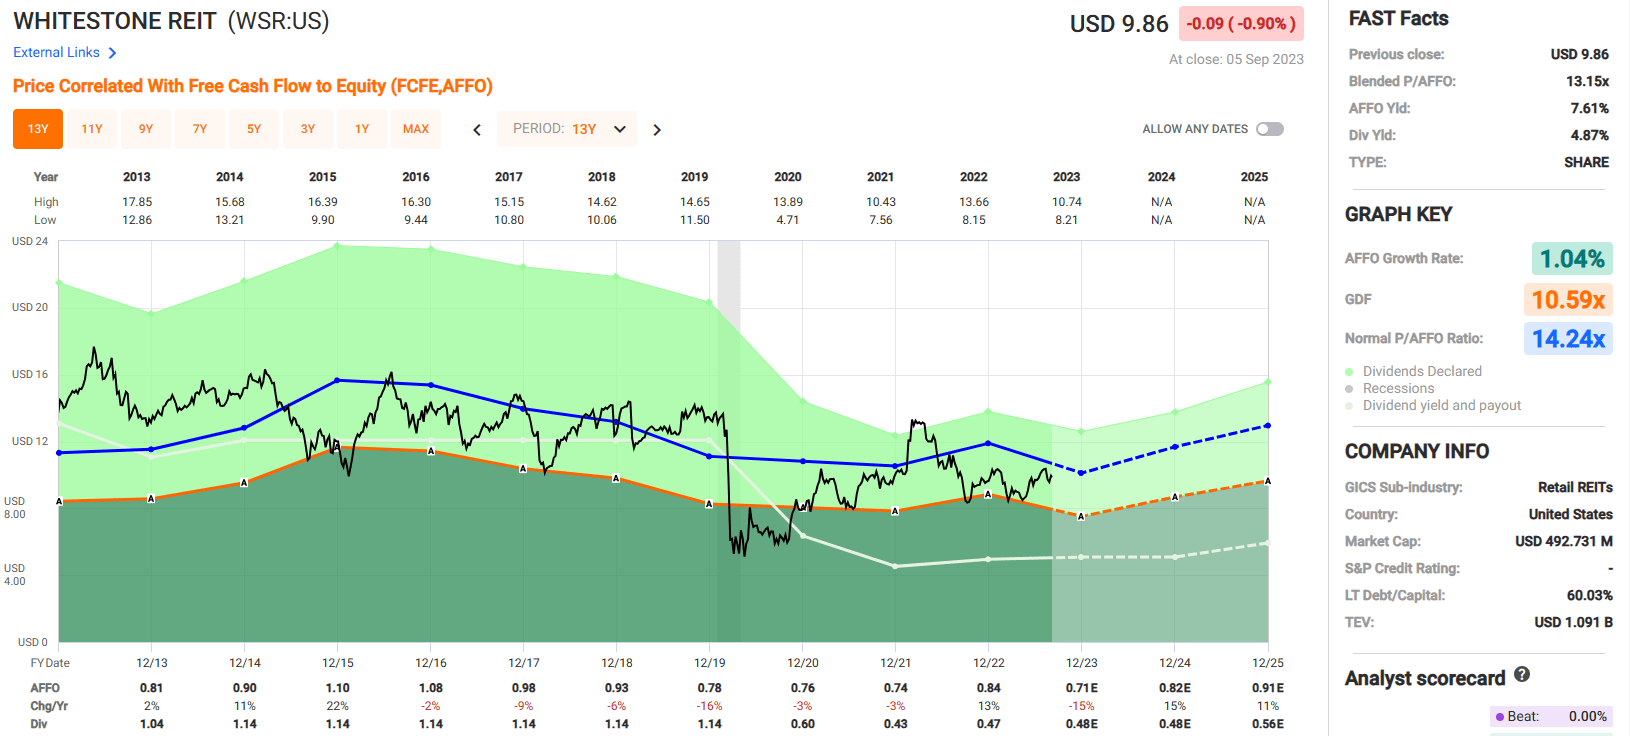
Whitestone REIT ( WSR )
Whitestone REIT is a shopping center REIT that develops, acquires, and operates open-air, retail shopping centers that are primarily located in the Sunbelt. WSR targets service-oriented tenants that operate in industries such as grocery stores, specialty retail, restaurants, and financial and educational services and in total they lease their properties to 1,466 tenants.
As of the end of the second quarter, WSR wholly owned 51 operating properties and 5 land parcels which are held for future development. Their properties cover 5.0 million square feet of gross leasable area with 29 properties in Texas, 26 properties in Arizona, and 1 property in Illinois.
WSR’s largest market is Phoenix with 26 properties that make up 42% of their net operating income (“NOI”), followed by Houston with 12 properties that make up 25% of their NOI. Other major markets include Austin/San Antonio and Dallas/Fort Worth which contribute 15% and 18% of their NOI respectively.
In addition to their wholly owned portfolio, Whitestone also has an 81.4% equity interest in 8 properties totaling 0.9 million square feet through their investment in Pillarstone OP.
Whitestone has reasonable debt metrics including a debt to pro forma EBITDAre of 8.3x, a long-term debt to capital ratio of 60.03%, and an EBITDA to interest expense ratio of 2.48x. Their debt is 84% fixed rate with a weighted average interest rate of 5.04%.
They have manageable debt maturities in 2023 & 2024, and no debt maturities in 2025. Additionally, WSR has $98.5 million available to them under their $250.0 million revolving credit facility.
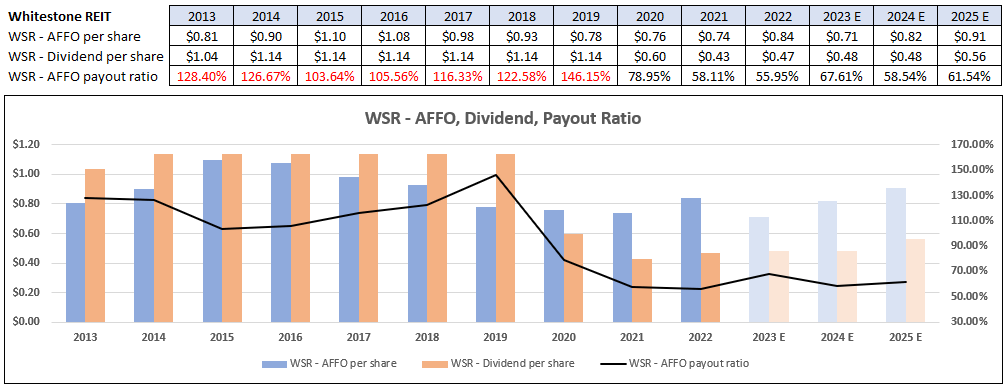
Out of all the monthly payers we’ve looked at so far, Whitestone REIT has the least favorable dividend track record. On one hand WSR has consistently paid a monthly dividend for over 15 years, on the other hand they paid more in dividends than the AFFO they generated from 2013 to 2019 and had an AFFO payout ratio of more than 100% over that time.
In 2020 WSR had to slash its dividend from $1.14 to $0.60 per share, representing a -47.37% dividend cut, and then they cut it again the following year by -28.75%. On a positive note, due to the dividend cuts in 2020/2021 WSR had a very conservative year-end 2022 AFFO payout ratio of 55.95% and analysts expect the AFFO payout ratio to remain below 70% through 2025.
Whitestone currently pays a 4.87% dividend yield that is well covered and trades at a P/AFFO of 13.15x which compares favorably to their 10-year average AFFO multiple of 14.24x.
We like WSR’s properties and their Sunbelt focused strategy and in spite of their recent past dividend history we like their prospects going forward as they now pay a high yield supported by a low AFFO payout ratio.
We have a Spec Buy on the stock due to its discounted valuation and well-covered dividend but we want to emphasize that this is a speculative buy due to their past dividend history.
We rate Whitestone REIT a Spec Buy.
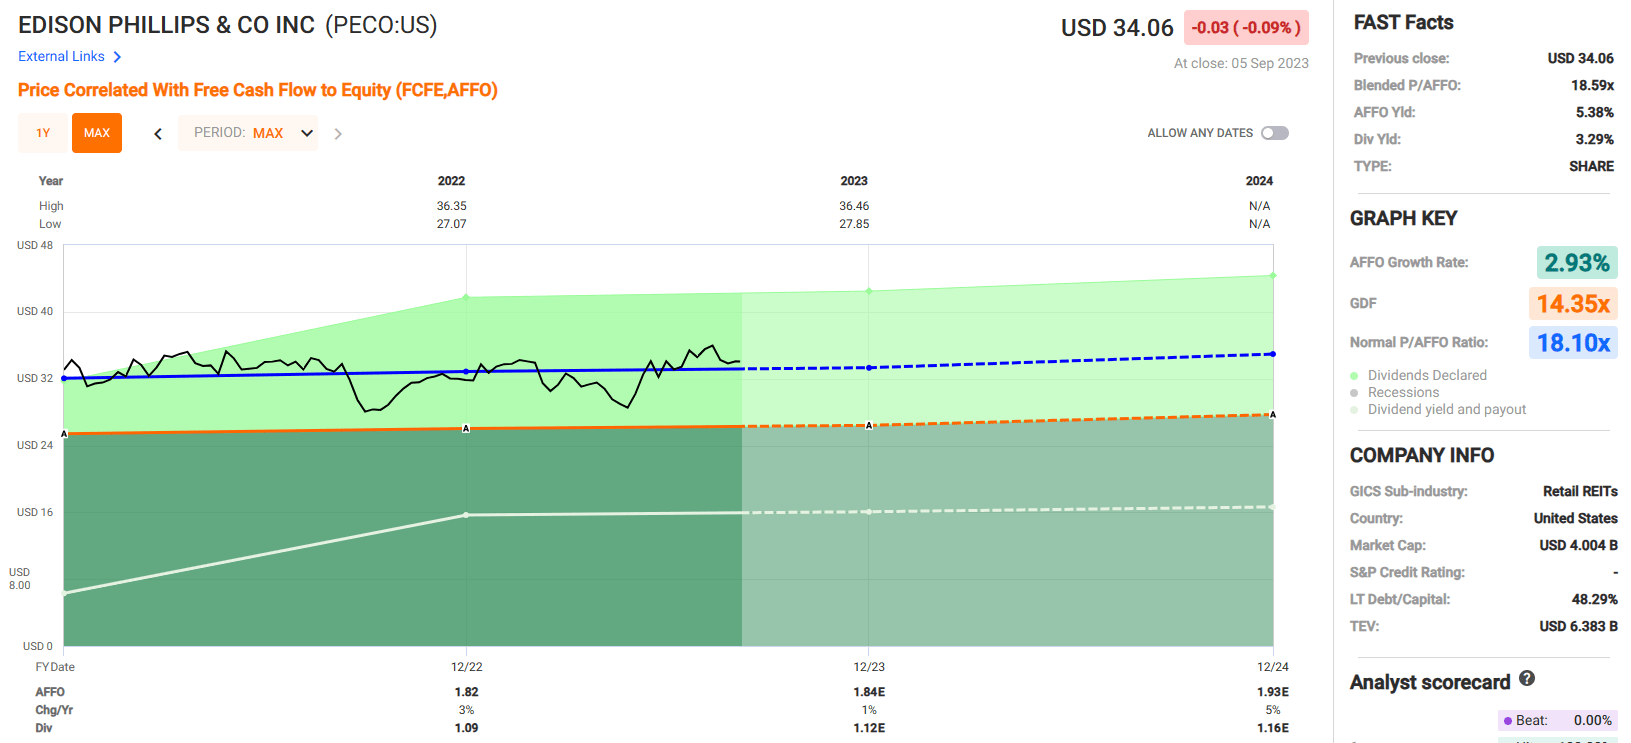
Phillips Edison ( PECO )
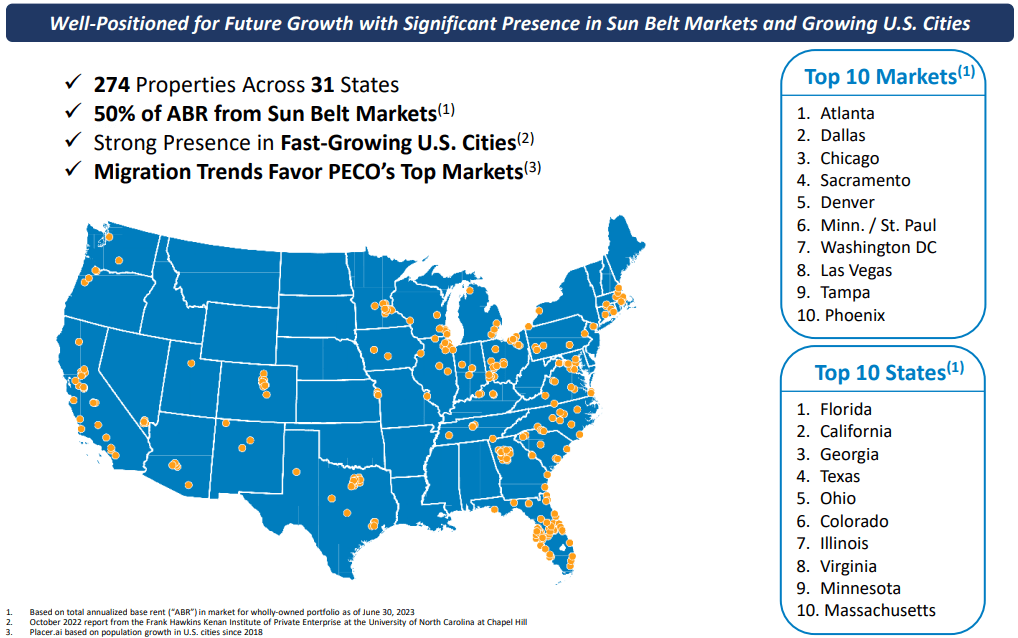
Phillips Edison is a REIT that specializes in omni-channel, grocery-anchored shopping centers which are occupied by local, regional, and national retailers that provide necessity-based goods and services.
They almost exclusively focus on shopping centers that are anchored by a grocery store and receive 97% of their annualized base rent (“ABR”) from omni-channel, grocery-anchored shopping centers. PECO owns 274 shopping centers covering 31.4 million square feet across 31 U.S. states and has an ownership interest in 20 shopping centers through a joint venture.
PECO has a strong presence in the Sunbelt and derives 50% of their ABR from Sunbelt markets. Based on ABR, their top 3 markets are Atlanta, Dallas, and Chicago, and their top 3 states are Florida, California, and Georgia.
Between their anchor tenants and inline tenants, PECO leases their properties to well-known establishments such as Kroger, Publix, Walmart, Dollar Tree, Subway, Lowe’s, The UPS Store, and Starbucks.
As of the end of the second quarter, PECO’s anchor occupancy was reported at 99.4% and their inline occupancy was reported at 94.8%.
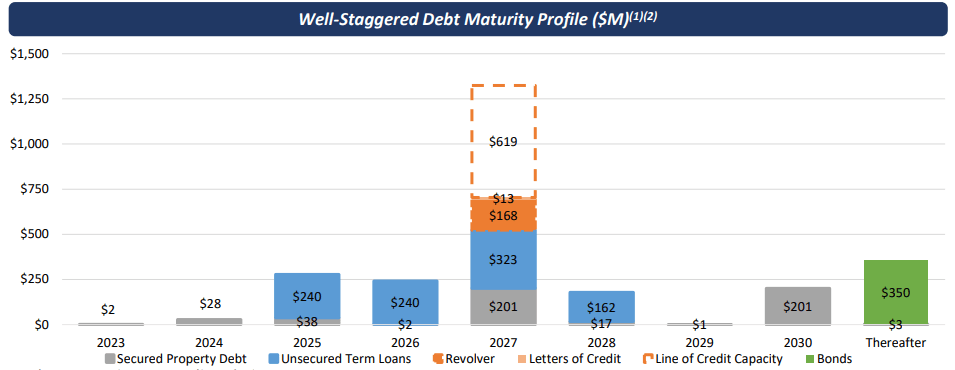
PECO is investment-grade with a Baa3 credit rating from Moody’s and a BBB- rating from S&P Global. They have solid debt metrics including a net debt to adjusted EBITDAre of 5.2x, a long-term debt to capital ratio of 48.29%, and an EBITDA to interest expense ratio of 5.37x.
PECO’s debt is 81.3% fixed rate with a weighted average interest rate of 3.9% and a weighted average maturity of 4.6 years when including their extension options.
They have minimal debt maturities in 2023 & 2024 and $629 million of liquidity consisting of $9.9 million in cash, equivalents and restricted cash and $619.2 million of availability under their revolving credit facility.
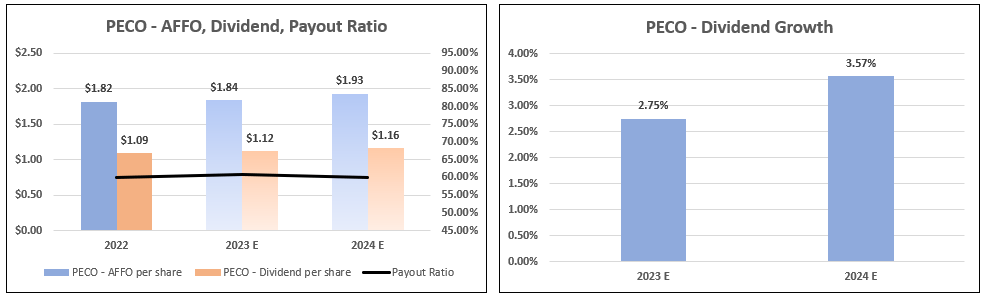
PECO was founded in 1991 but only went public in 2021 so we don’t have much dividend history to look at. The stock currently pays an annual dividend yield of 3.29% that is paid on a monthly basis and is secure with an AFFO payout ratio of 60.23% as of the end of 2022.
Analysts are expecting PECO’s AFFO to increase by 1%, to $1.84 per share in 2023, and then by 5%, to $1.93 per share in 2024.
They are also expecting annual dividend growth of 2.75% in 2023 and 3.57% in 2024. If these projections are on target, it would maintain PECO’s conservative AFFO payout ratio, ranging between 59% and 61% through 2024.
PECO has solid fundamentals, but the stock is currently trading at a P/AFFO of 18.59x, slightly above its normal AFFO of 18.10x. Likewise, it is trading at a slight premium to its net asset value with a P/NAV ratio of 1.04x.
We like several things about PECO including the quality of their properties, the above average yield that is paid monthly, and the conservative AFFO payout ratio, but recommend investors wait until a pull-back in price to buy shares.
We rate Phillips Edison a Hold.
I Like Quality and Quantity
Historically, dividend growers have outperformed the other cohorts of the S&P 500 after the Fed has increased interest rates.
With rising interest rates in mind, we believe that REIT investors should focus on companies supported by positive fundamentals, balance sheet strength, ample free cash flow and management teams committed to sustainable dividend growth.
On the contrary, higher yielding stocks with high debt levels will be challenged given their interest rate sensitivity.
Investing in REITs with sustainable dividend growth can help augment total returns and reduce volatility while providing a growing income stream.
Ultimately, I consider these monthly paying REITs to be ideal for small investors who are looking for the perfect combination of quality and quantity .
Note: Brad Thomas is a Wall Street writer, which means he's not always right with his predictions or recommendations. Since that also applies to his grammar, please excuse any typos you may find. Also, this article is free: Written and distributed only to assist in research while providing a forum for second-level thinking.
For further details see:
Magnificent Monthly Mailbox Money