CA - Manulife: Taking A Closer Look At Canadian Life Insurance
2023-09-25 18:29:10 ET
Summary
- Since 2018, Manulife has been successfully implementing its strategic plan to de-risk its portfolio.
- Manulife offers a strong dividend yield, attractive valuation, and a focus on high-potential markets like Asia, making it an appealing investment option.
- Exposure to commercial real estate and sensitivity to market downturns are key risks to consider.
- Manulife should benefit from rising interest rates, particularly in its fixed-income portfolio.
All figures are in unless otherwise noted.
All financial information is from Seeking Alpha unless otherwise noted.
Investment Thesis
Since unveiling its strategic roadmap in 2018, Manulife ( MFC:CA )( MFC ) has made significant strides in de-risking its asset portfolio. In light of the current macroeconomic landscape, characterized by rising interest rates and a forward-looking, high-quality investment strategy, Manulife is exceptionally well-positioned for growth in my opinion. This makes it a compelling buy at this juncture. Backed by a robust dividend yield, an upward growth trajectory, and an attractive valuation, now appears to be an opportune moment for long-term investors to acquire Manulife shares.
Introduction
Manulife is one of the world's largest life and health insurance companies with operations in Canada, the U.S., and Asia. They operate through 3 segments:
- Insurance and Annuity: Provides deposit and credit products, individual life insurance, individual and group long-term care insurance, and annuities
- Wealth and Asset Management: Offers investment advice and solutions to retirement, retail, and institutional clients.
- Corporate and Other: Property and casualty reinsurance businesses and run-off reinsurance operations.
The difference between net income and core earnings is that core earnings allow investors to focus on the company's operating performance excluding the impact of market-related gains or losses, changes in actuarial methods, and other items that don't reflect the underlying earnings capacity of the business.
YTD 2023, Asia has made up 30.36% of core earnings followed by 26.61% in the United States, 22.94% in Canada, 19.16% from Global WAM, with the rest coming from corporate and others.
YTD Performance & Commentary
New business has been surging , with YTD APE sales reaching $3.233 billion—a 7.1% increase compared to the same period in 2022. This surge was largely fueled by Asian markets rebounding post-lockdown, although gains were partially offset by softer APE sales in Canada and the U.S. New Business Value rose by 6.8% to $1.094 billion, while total CSM for new business climbed 5.2% to $1.034 billion.
In the Wealth and Asset Management (WAM) sector, Global AUM increased by 9.7% to $819.6 billion, bolstered by net inflows totaling $6.6 billion for the year.
Core earnings for YTD 2023 stand at $3.168 billion, translating to $1.63 per share, an improvement over last year's $2.919 billion or $1.45 per share. This resulted in a core ROE of 15.2%, up from 14.5% during the corresponding period last year. This earnings growth can be attributed to higher expected investment returns, fewer adverse mortality-related claims, and improved returns on surplus assets, albeit offset by increased debt financing costs.
Since launching its focus on operational efficiency in 2018, Manulife reports a YTD expense efficiency ratio of 46.1%, a slight uptick from 44.7% last year. This increase is primarily due to elevated distribution and labor costs, as well as a resurgence in travel expenses as the world moves towards pre-pandemic normalcy.
From a regulatory standpoint, Manulife maintains a solid financial footing with a LICAT ratio of 136% at the end of Q2 2023, comfortably above the regulatory minimum of 100%. The financial leverage ratio remains stable at 25.8%, marginally down from 26% in Q2 2022.
Catalysts
Relative Valuation
Some of the key valuation metrics used for life insurance companies are the P/B ratio and the ROE metric. For our comparison, I use MetLife ( MET ), Prudential ( PRU ), Sun Life ( SLF:CA ), Great-West Lifeco ( GWO:CA ), Power Corporation ( POW:CA ), and Unum Group ( UNM ).
Manulife currently has a P/B ratio of 1.1x compared to the median of the peers at 1.4x. The main competitor in Canada is Sunlife which carries a current P/B of 2.68x compared to Manulife's at 1.08x. From 2018-2022 Manulife had an average P/B of 0.99x compared to Sunlife at 1.47x and Great West Life at 1.40x. That means that Manulife's P/B ratio has historically traded at around 67.34% of Sunlife's P/B and 70.71% of Great West Life.
Given that Sunlife has a current P/B ratio of 2.68x and Great West has a current P/B ratio of 1.64x, if Manulife was trading at the historical levels seen from 2018-2022 their P/B should be 1.80x based on a comparison to Sunlife and 1.16x based on a comparison to Great West Life. In both cases, we see that Manulife's current P/B of 1.08x is below what it historically should have been.
Note that the current P/B shown in the figure above used reported book value however, for my calculations I used the adjusted book value which can be found on Capital IQ.
Interestingly, the LTM ROE for Manulife has been 25.4% compared to the group median of 7.7%, and looking at Sunlife which has had an ROE of 12.2%, and Great West Life which has had an ROE of 8.5% I'm surprised to see that the P/B ratios have actually trended unfavorably for Manulife.
I believe that the higher ROE combined with a much lower P/B is due to Manulife's portfolio being riskier. However, the spread between the ratios has grown dramatically, especially for Sunlife which I feel is overblown.
Higher Interest Rates & Investment Portfolio
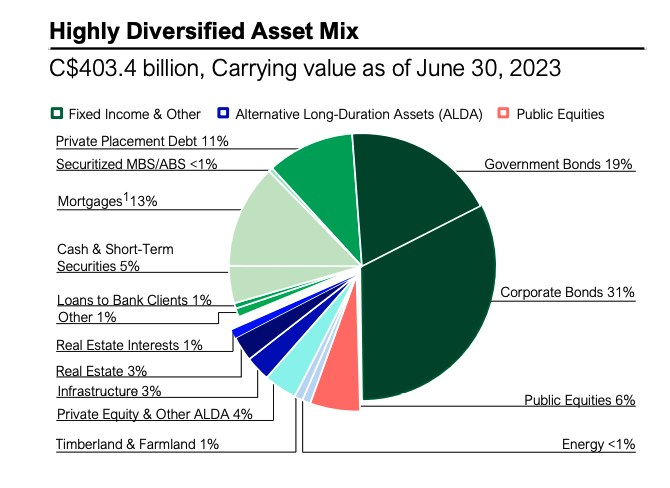
Manulife's investment portfolio is roughly 81% in fixed-income assets.
Manulife's Portfolio (Q2 2023 Investment Fact Sheet)
Over the past few years, interest rates have been relatively low which means that Manulife's investment portfolio, specifically the fixed-income side of the portfolio, wasn't earning a very high return. Now that interest rates have increased substantially over the past 2 years, as Manulife's debt securities come to maturity, they will be able to invest these assets at a much higher rate of return helping enhance the long-term returns of the portfolio.
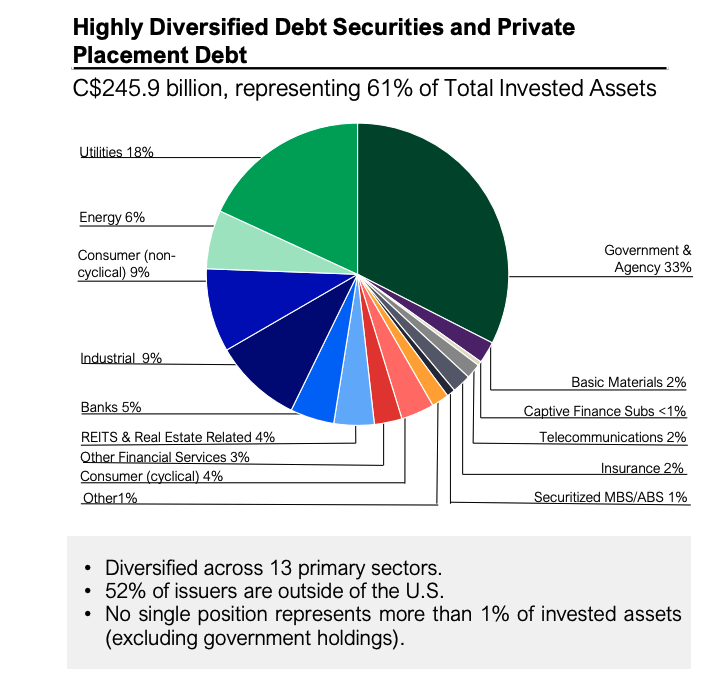
Their fixed-income portfolio is well diversified across 13 key sectors and 52% of the issuers are outside of the U.S.
Manulife's Fixed-Income Portfolio (Q2 2023 Investment Fact Sheet)
The benefits from higher interest rates also impact their direct mortgage portfolio (13% of total invested assets). The average duration for Canadian mortgages is 4.16 years and the average U.S. duration is 6.13 years. As new mortgages are originated and clients refinance their mortgages, Manulife will be able to earn higher returns as mortgage rates have increased substantially.
Manulife's Mortgage Portfolio (Q2 2023 Investment Fact Sheet)
Manulife has already started to see the benefits of higher interest rates as YTD interest income of $6.149 billion trumps the $5.613 billion earned during the same period of 2022. I expect this trend to continue and higher interest rates for longer should continue to provide benefits to Manulife's bottom line.
Strong Dividend & Growth Regions
Manulife should be in the conversation as one of the best Canadian dividend payers as they boast a dividend yield of 5.71% at the time of writing. Comparing that to the current dividend yield on Sunlife at 4.48% and Great West Life at 5.12% we see that Manulife stands as one of the premier dividend payers within the Canadian insurance industry.
Manulife has demonstrated an impressive track record of dividend growth. Over the past decade, the company has achieved a CAGR of 10.61% in its dividend payouts. In the last five years, this rate has been a consistent 10.5%, and just in the past year alone, the dividend growth soared an extraordinary 13.93%. When benchmarked against Sunlife , one of its primary competitors, Manulife clearly stands out. Sunlife's 10-year dividend CAGR is 7.4%, its 5-year CAGR is 9.59%, and its one-year growth rate is 12.5%. Manulife has consistently increased its dividend every year since 2013 and maintains a payout ratio of just under 50%, in line with its medium-term target of a core dividend payout ratio of 35-45%.
They also return money back to investors through the share buyback program. The current TTM buyback yield is 4.04% which would make the total return from dividends and buybacks 9.62%. I believe this yield is an excellent incentive for long-term investors, especially those seeking consistent retirement income, to consider adding Manulife to their portfolio.
Manulife is targeting 50% of its core earnings to come from Asia by 2025. YTD Asia currently makes up 36% of core earnings which means they are on track to meet this goal. Growth in the Asian life insurance market is forecasted to grow by 5.6% in 2024, 5.7% in 2025, and 6.1% in 2026 making the goal for Manulife all the more realistic.
Asia-Pacific Life Insurance Market (Global Data)
I believe that Manulife's strategic focus on the Asian markets will prove to be beneficial for shareholders because of the sheer size of the market. As Manulife continues to grow its name in the region, its intangible assets will also grow. Additionally, new business value out of this region continues to be the highest for Manulife. YTD, Asia has made up roughly 73% of new business value for Manulife highlighting the focus Manulife has placed on this region.
Strategic Direction and De-risking
Manulife has traded sideways for years ever since their performance during the financial crisis was less than spectacular. An overly risky insurance portfolio and a subsequent dividend cut were the common themes for Manulife. One potential reason for underperformance compared to its peers is that investors still haven't regained their confidence in Manulife. Some of the more complex and risky products in Manulife's portfolio include their long-term care and variable annuity businesses and Manulife has made a strategic effort to reduce exposure to these higher-risk segments.
The goal was for Manulife to reduce their core earnings from LTC & VA to less than 15% by 2025. By reducing exposure to these lines of business, Manulife will be able to free up additional capital which they can use to invest.
Manulife Portfolio Optimization Strategy (Q2 2023 Investor Presentation)
In Q2 2023, Manulife released $101 million in capital related to this portfolio optimization strategy, and core earnings from LTC & VA now only make up 16% of core earnings which puts them well on track to achieve that goal. As they continue to reduce exposure to these lines of business, I believe that the risk profile for Manulife will continue to improve relative to their peers setting them up nicely for shareholder returns.
Management is also aiming to have 75% of their core earnings come from 'high potential businesses' by 2025 which defined loosely, is earnings from Asia, investment management, and behavioral insurance products. YTD they have been able to achieve 59% of core earnings coming from these high-potential businesses. As Manulife continues to grow its WAM segment, the stability of its earnings should also increase.
Both of these efforts should help de-risk Manulife's overall portfolio and hopefully helps attract new investors who didn't want as much volatility in earnings.
Risks
Note that the risks below are not exhaustive in nature. Manulife is subject to a variety of different risks however, I believe the risks highlighted below are some important considerations for investors.
Real Estate Portfolio
Within Manulife's portfolio of invested assets, they have commercial real estate holdings amounting to $16.8 billion (4% of total invested assets). After the pandemic, the shift to working from home has had significant impacts on office properties. Manulife currently has $5.026 billion invested in office properties (before accounting for real estate interests). I believe the risk of these properties deteriorating in value is something that investors should consider.
Manulife Real Estate Holdings Breakdown (Q2 2023 Investment Fact Sheet)
Potential Recession
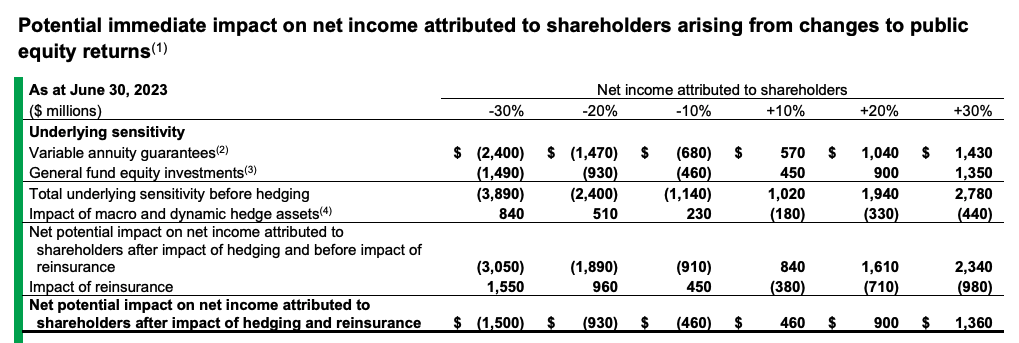
The global markets have been dealing with negative sentiment from investors who believe we are due for a recession. The impact of a downturn in public equity markets has significant effects on Manulife. A 30% decrease in public equities would have a negative $1.5 billion impact on net income, a 20% decrease would have a negative $930 million impact, and a 10% decrease would have a negative $460 million impact on net income.
Net Income Sensitivity to Public Equities (Q2 2023 MD&A)
Moreover, the ALDA (alternative long-duration assets) that Manulife holds are also subject to changes in the equity markets. ALDA consists of commercial real estate, timber and farmland real estate, infrastructure, and private equity. While these asset classes are less correlated with the public equities market, a potential recession would still impact them. A 10% decrease in the ALDA portfolio would result in a negative $2.5 billion impact to net income.
The risk of a global recession would have material impacts on Manulife which is something I believe investors should consider as a risk.
Conclusion
Manulife has demonstrated a compelling investment thesis characterized by robust financial performance, strategic growth initiatives, and a strong risk-mitigation strategy. With a focus on high-potential markets like Asia, an impressive dividend yield, and a portfolio set to benefit from rising interest rates, the company presents a strong case for long-term investment. While risks such as real estate exposure and potential economic downturns should not be overlooked, Manulife's efforts to de-risk its asset portfolio and optimize its operations add an additional layer of resilience. Given these factors, Manulife stands out as a buy for investors seeking both growth and income.
For further details see:
Manulife: Taking A Closer Look At Canadian Life Insurance