HGTY - Markel Corporation: Calculating The Mathematical Value
Summary
- The CEO of Markel Corporation has suggested a simplified view of deriving its value.
- This article explores a modification of that approach and benchmarks it against historical prices.
- Initial results indicate that market sentiment might be discounting the value of Markel Corporation more than the risk of the inherent business deserves.
Investment thesis
At the last Markel Corporation (MKL) shareholder meeting, then Markel co-CEO Thomas Gayner commented on how he calculated what he called "Markel's value using a formula." This is a simplistic view of estimating a company's true intrinsic value, but it triggered my interest, as it could serve as a quick and rough measure of market pricing of Markel, from its value at a point in time. Analysis in the continuation of this article will provide a modified version of Gayner's concept, and compare its results with current and historical price development.
Valuation approach
During the 2022 annual shareholders meeting, CEO Tom Gayner, devoted a significant part of the meeting in explaining how he looks at the value creation process in Markel and how that could translate to a tangible measurement that is at least, directionally, correct.
During the session, Gayner explained how he would value Markel if put into an analyst's shoes. However, later on, he would make a disclaimer that this value does not have to necessarily be reflected in the actual share price of Markel. But, it can serve as a directional indicator of where the value of the Markel as a business is going, and where price might follow. One additional disclaimer he makes is the following quote:
What any single calculation can never capture though is the intangible value of how each part of Markel is better off because it is part of all of Markel. as my favorite coach John Wooden used to say the main ingredient of stardom is the rest of the team.
The approach he suggested by him makes the following assumptions:
- Insurance and reinsurance businesses that operate with continuous underwriting profit are left to invest collected premiums at the best of their abilities and regulatory constraints. This assumes that Markel operates with a free float, since positive cost of float would limit its investment options.
- Investments in fixed income securities that are usually held to deadlines that meet insurance liabilities are thus funded with minimum cost, and their value is what we currently see on books.
- Investments in equities are viewed in the similar way. Markel has historically sold its investments with a profit, thus the value of its equity portfolio is at minimum its current price.
- Cash and cash equivalents are simply added to overall mathematical value.
- Debt is a negative element. Although used to generate income, this is a share of business owned by other stakeholders, and thus subtracted from the aggregate mathematical value.
- Markel Ventures, a collection of 21 fully owned, mature and profitable independently operated companies, is valued by applying a through the cycle EV to EBITDA ratio. For all intends and purposes, I will assume the value of this multiple to be equal to 10, inherently implying cost of capital of 10%.
- ILS and other businesses are valued using the same principle as for Markel Ventures, by applying an appropriate EV to EBITDA ratio.
- My addition to this approach , is that the amount of float generated by Markel insurance and reinsurance should be additionally subtracted to obtain the value estimate belonging to the common equity holders.
- At the same time, after tax free cash flow to equity generated by insurance and reinsurance operations should be discounted assuming stable growing income in line with long term inflation of 2% and cost of equity of 7%. This is historically slower growth than achieved growth rate, however it's an assumption rolled out to perpetuity.
- 23% share of ownership in Hagerty (NYSE: HGTY ) accounted under equity model is shown at market value using fully diluted share count (333.5 million shares outstanding, of which 76,6 million owned by Markel) and latest share price.
- Equity belonging to the holders of proffered stock should be subtracted from the overall sum.
Float
The strong assumption in the first point of this approach is that Markel's float is free of charge, and it will grow or remain stable in the future.
In simplest terms, float of an insurance company is calculated as a difference between premium liabilities (money owed to policyholders at reporting date - cash collected by the company through premiums for future event insurance) and part of premiums yet to be collected from policyholders (cash to be collected in future through contracted premiums), policyholder receivables. In more details, and using Markel balance sheet information, these two elements are defined as sums of:
-
Policyholder liabilities = Unpaid losses and loss adjustment expenses + Life and annuity benefits + Unearned premiums + Payables to insurance and reinsurance companies
-
Policyholder receivables = Reinsurance recoverable + Deferred Policy acquisition costs + Prepaid reinsurance premiums
Looking at the latest quarterly financial statements, the following item of the balance sheet are relevant for current float calculation.
Float elements (Markel Q3 2022 balance sheet)
As for the cost of float, float is free if it's not causing underwriting losses. If an insurance company can underwrite additional policies without taking miscalculated risks (earned premiums consistently higher than losses) each period at the time, it is in effect left to manage the float at hand to the best of its abilities (while bounded by the regulation). Note that if an insurance company operates its investment portfolio with exceptional skill, it can be overall profitable even if it operates with underwriting loss. As long as realized investment income is higher than underwriting loss, at least some value is created. We will see below that Markel operates as dual positive extreme (profitable underwriting and exceptional capital allocation in investments portfolio).
To determine the true cost of float, one would need to go back to each underwriting vintage and then track its underwriting results until all the premiums from that particular vintage are either earned, ceded or result in losses. Based on public disclosures, this is impossible to do without inside information. However, it can be approximated using available disclosed information over and adequately long period of time.
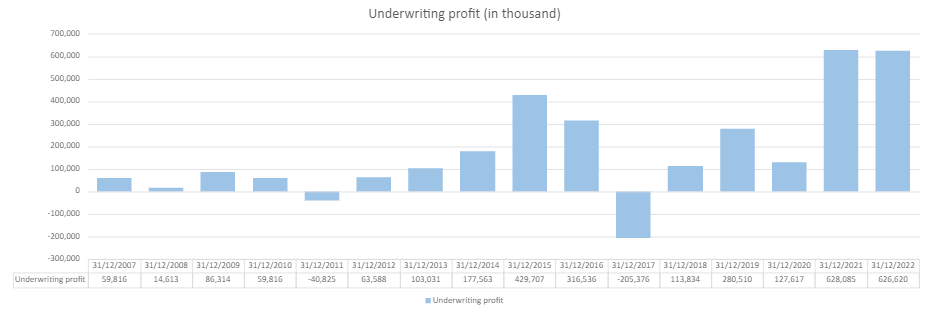
First, let's start with the overview of the underwriting results over time. In the case of Markel, underwriting results in the past 15 years were the following:
Markel underwriting results (2007 - 2022 financial statements)
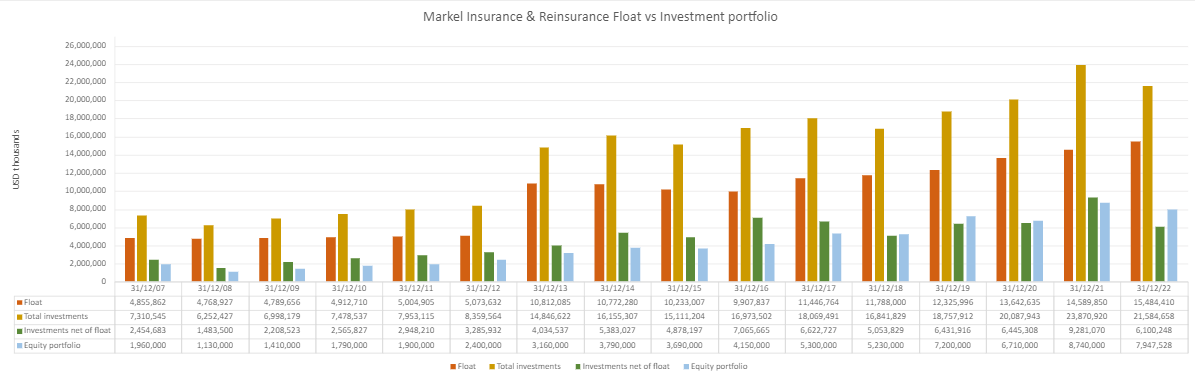
At the same time, using previous definition of the float, we can also track its development over the comparable period of time.
Markel float development (Author's Calculations)
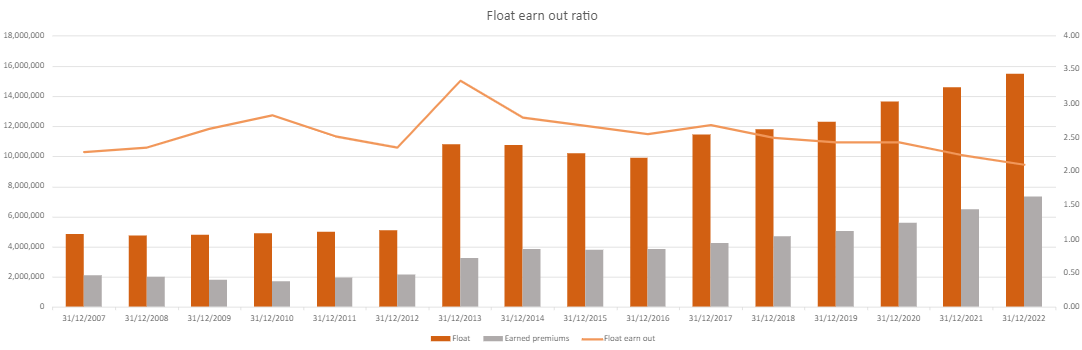
From this, cost of float would be nothing but the underwriting profit divided by float. As seen above, 2011 and 2017 would result in positive cost of float (underwriting loss). In order to account for previously mentioned vintage dependencies, and approximate them somehow, it is a prudent approach to smooth out underwriting results over some arbitrary period of time. My best estimate is that this period should be extended over the period in which existing float is earned out. Or in other words, period of time in which earned premium cover the existing float. In the case of Markel, this ratio oscillates between 2 and 3 years, indicating that it take to average this many years for previously written and then unrealized risks, to equal the amount of existing float.
Markel float earn-out ratio (Author's calculations)
Note that I cannot estimate the amount of previously collected premiums that result in claims and get a more accurate measure of float replacement. However, this approximation would suffice, and for the rest of the analysis I would consider that float is replaced on average in 3 years of underwriting.
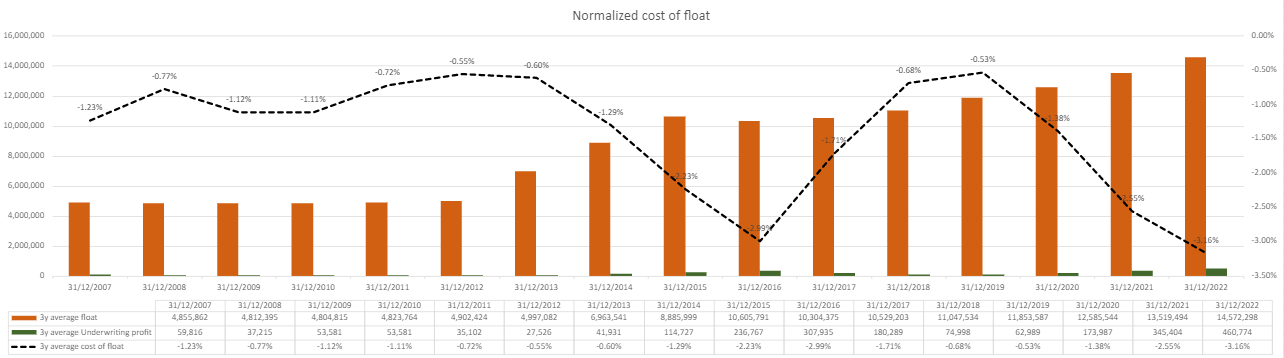
Using this period as a representative period and averaging underwriting profits and recorded float over the period of 3 years, we can now calculate normalized cost of float by dividing the two amounts.
Markel Insurance cost of float (Author's Calculation)
In midterm, Markel has goals of reducing their combined ratio close to 90%, implying even lower cost of float of 3.5-4%.
All of the above indicates that float generated by Markel Insurance and reinsurance segment is indeed free. Better even, it is generating relatively stable and cost free profits and cash flows.
Investment portfolio
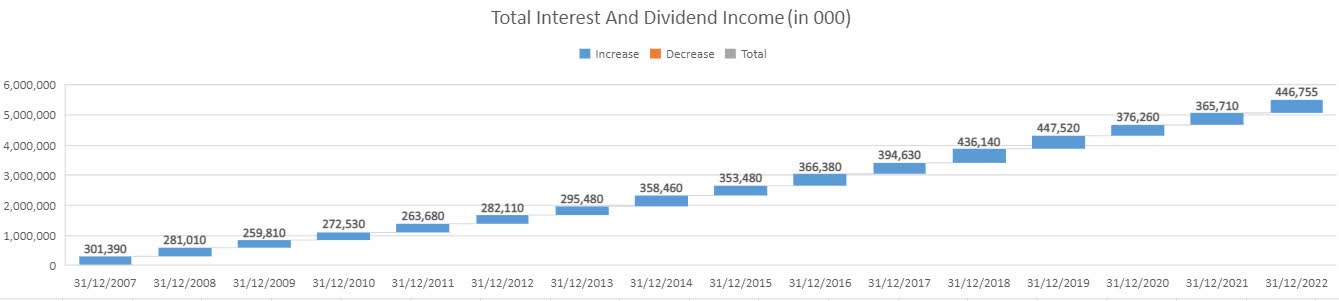
Another element in the calculation of the mathematical value is the development of the investment portfolio. In case of Markel, this portfolio is roughly spilt 60:40 between fixed income securities and equity investments. But because the need to forcefully sell any of their holdings is limited to rare occasions (remember constant underwriting profits), Markel has the privilege of holding its fixed income securities to their maturity, and adjusting their equity portfolio based on their preferences. In their history, their securities' portfolio did not show negative realized investment results apart in 2008, when net of interest and dividend income, USD $125 million was recognized as a loss. Figure below shows the stream of interest and dividends Markel collected in the period. In cumulative value, this is close to USD $5.5 billion in 15 years.
Total interest and dividend income (Author's calculation)
This excess flow of capital could have been theoretically used solely to acquire business that shape what is today Markel Ventures, one of three main value creation engines in Markel.
Markel also provides us with after tax portfolio measurements on different time horizons, their annual statement. Looking at a 10-year period, Markel equity portfolio has clearly outperformed the market index equivalent on after tax basis (17.3% vs 13.34%, or close to 1.3 times more, after tax).
Portfolio performance (Markel 2021 annual report)
For the purpose of the calculation of the Markel's mathematical value, I will ignore the compounding nature of the investment portfolio. Although historical performance would indicate that it is consistently compounding at the rate higher than that of the broad market portfolio. In my assessment, I would use the value of the equity portfolio as of February 2nd (approximately USD $7.9 billion).
Markel Ventures
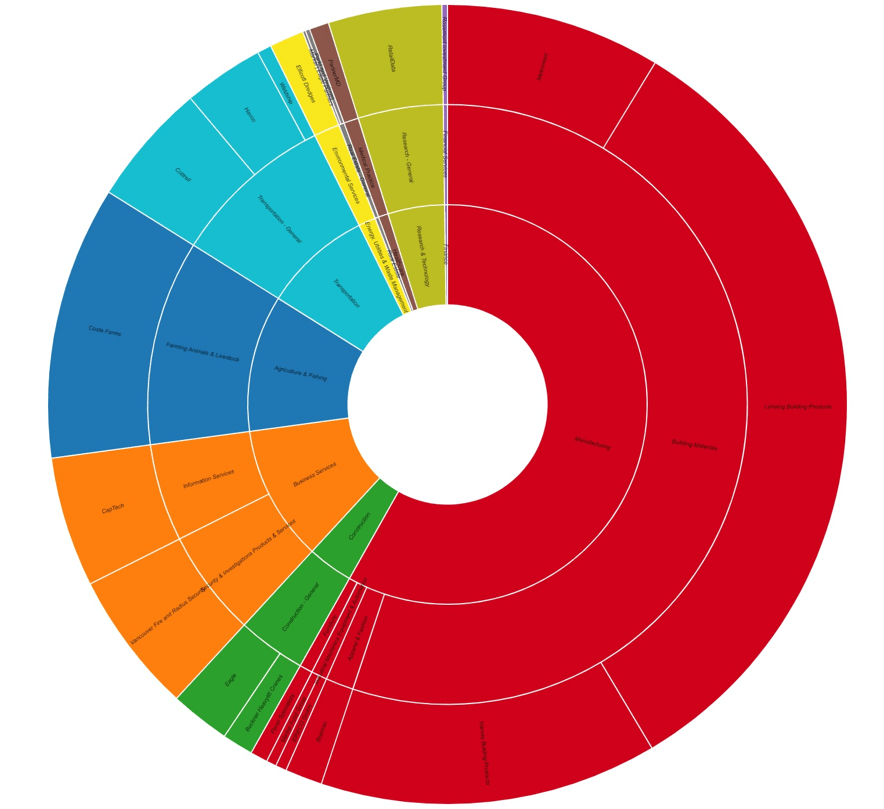
Ventures is a collection of 19 mature companies spread across multiple industries in sector, but most importantly these are robust businesses in generally stable and unpopular industries (with the exception to RetailData working on AI applications and Rosemont Investment Group - a small equity management company). More than 50% of revenue generated by Markel Ventures is produced in the Manufacturing sector.
Markel Ventures Sector/Industry revenue distribution (Author's calculation)
Measured through asset size and revenue, Venture's business doubles every 2 to 3 years through small organic growth and mostly through acquisitions of additional businesses. In my estimate of its value, I would assume no organic growth, i.e., its market price would be derived using a constant EV/EBITDA multiple as a simplified version of perpetual discounted cash flow model estimate (equivalent of one over cost of capital).
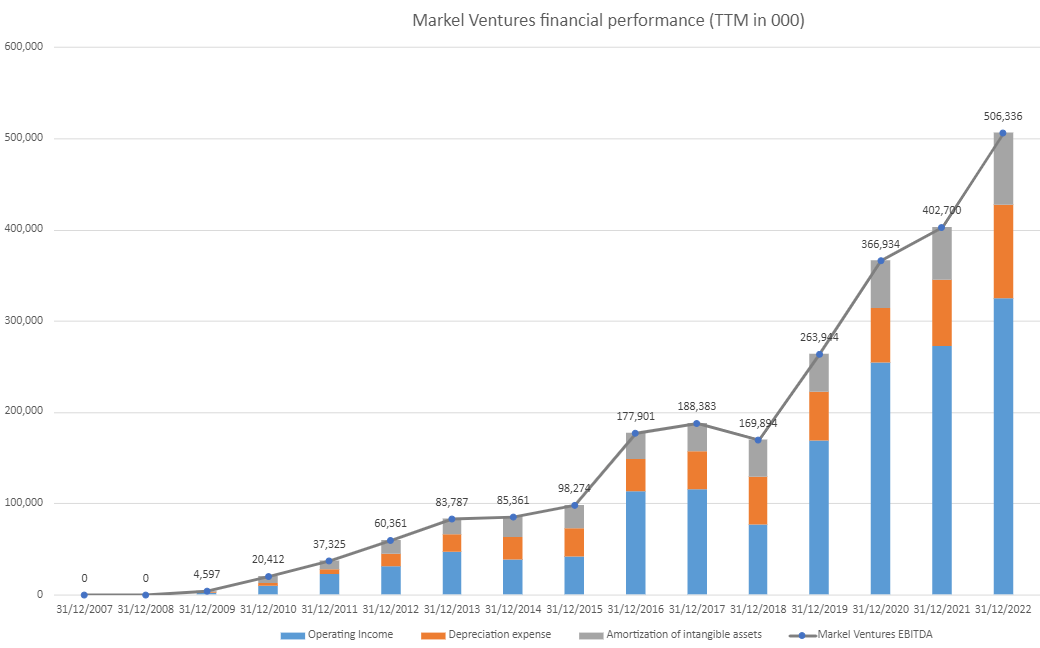
During the process of its growth and development, Ventures became a significant contributor to the overall cash flow generation of Markel.
Markel Ventures financial performance (Author's calculation)
Measured among the three, (investment portfolio dividends and interest, underwriting profits and Ventures), over time, Ventures will surely become the biggest generator of cash before interest, capital expenditure and taxes within Markel.
According to Tom's approach, the value of the Ventures business should be assessed by applying a reasonable market EV/EBITDA multiple throughout the time. My interpretation of this is that the same value of the multiple should be used in different years, as the goal here is to use a through the cycle measure and avoid periods of optimism and pessimism in the market to drive one's view on the value.
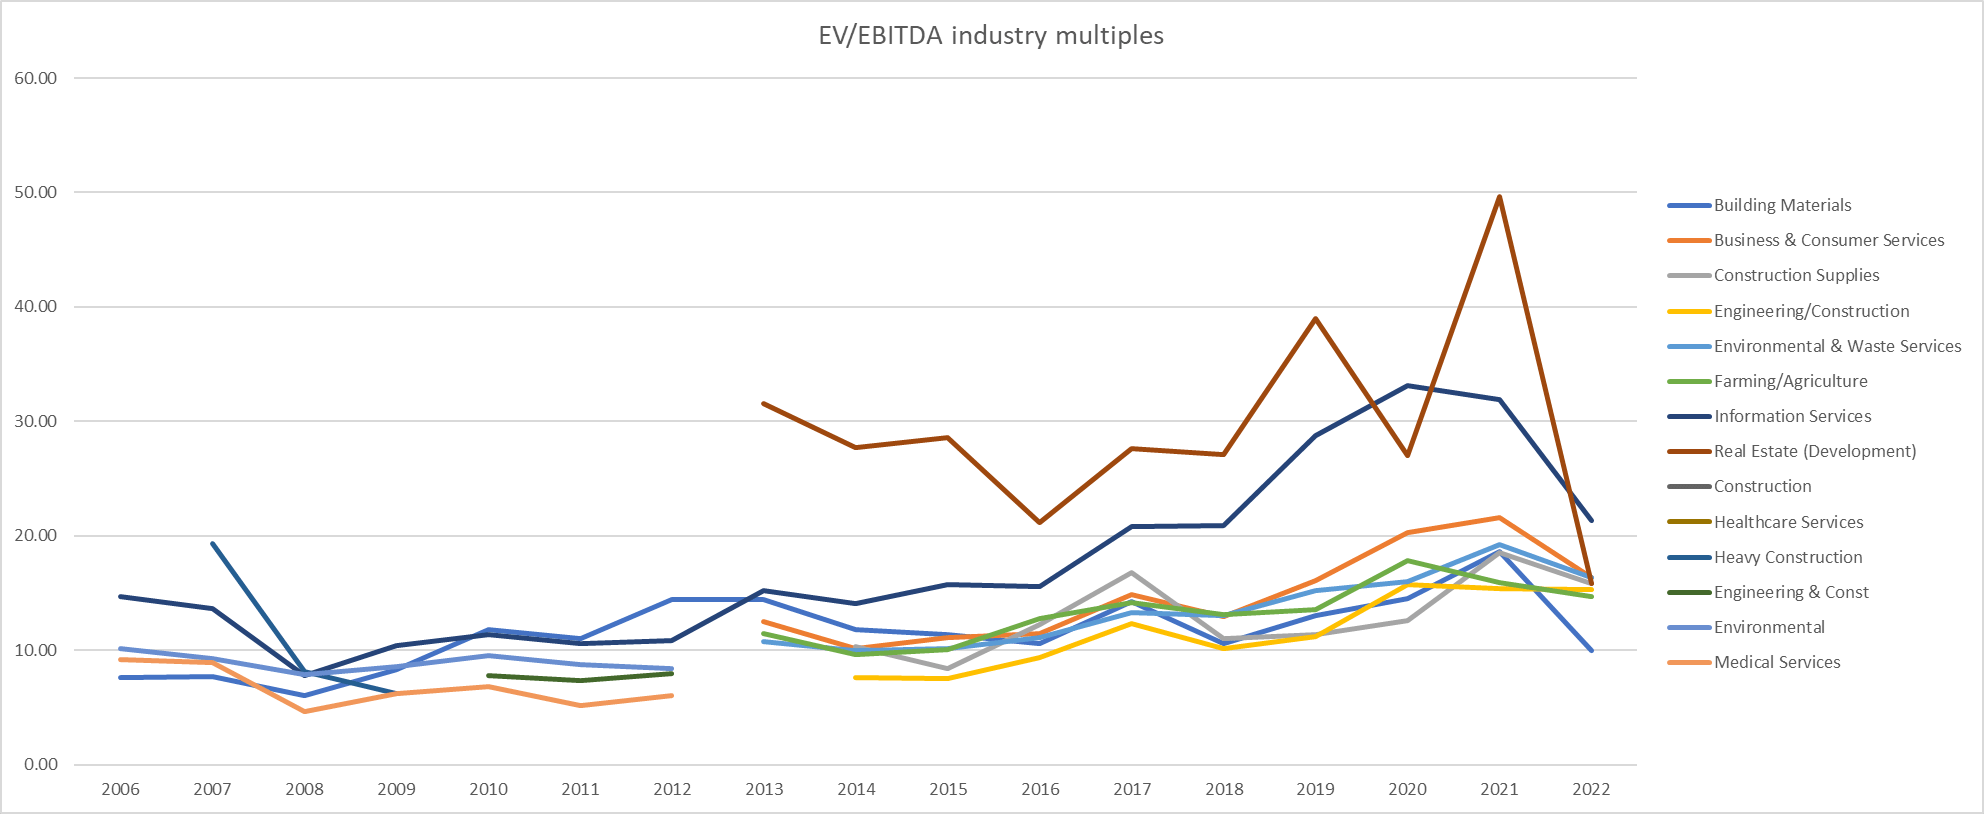
On a personal note, I do not feel comfortable with pricing, however, staying true to the method at hand, I have no options but to price it. As I reference, I collected the data on EV to EBITDA multiples from the webpage of Prof. Damodaran and I selected those I found representative of the Markel Ventures current structure (note that Damodaran's data is based on old Value Line industry segmentation while the one I showed in a graph above follow MSCI GICS definitions).
This data is far from complete. However, my reasonable estimate for EV to EBITDA ratio for Markel Ventures would be 10.
EV/EBITDA multiples across selected industries (pages.stern.nyu.edu/~adamodar)
Nephila ILS
The last part of the Markel, includes what is reported as Nephila ILS ( insurance linked securities - instruments similar to CDOs) operations, Program services and other fronting (underwriting on behalf of other insurers) and other (including CATCo runoff). These are not standard insurance business and are viewed by Markel as fee income generating operations. As such, they also are not valued by their net investment value, but rather on the EV to EBITDA multiple pricing approach. Similar, as in the case of Ventures, historical data can give some guidance on a reasonable multiple:
Cost of capital for insurance and reinsurance (NY Stern)
In lack of better evidence, multiple of 10 EV/EBITDA seems to be a reasonable estimate.
As for the performance, other segment of Markel has performed in the following manner during past 15 years:
ILS, Program Services & Other EBITDA (Author's calculation)
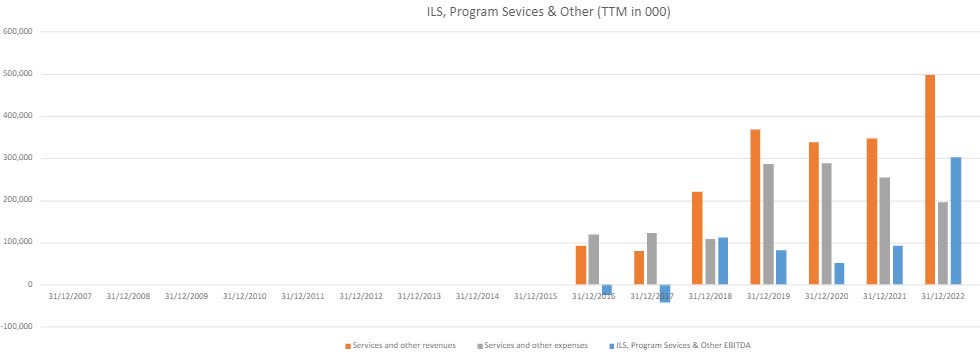
In cumulative, this segment has earned just shy of USD $0.5 billion since its inception.
Now it's time to bring all these elements together.
Estimation
Using the steps in deriving the mathematical value I described above, we get the following values:
Mathematical value estimate - annual figures (Author's calculations)
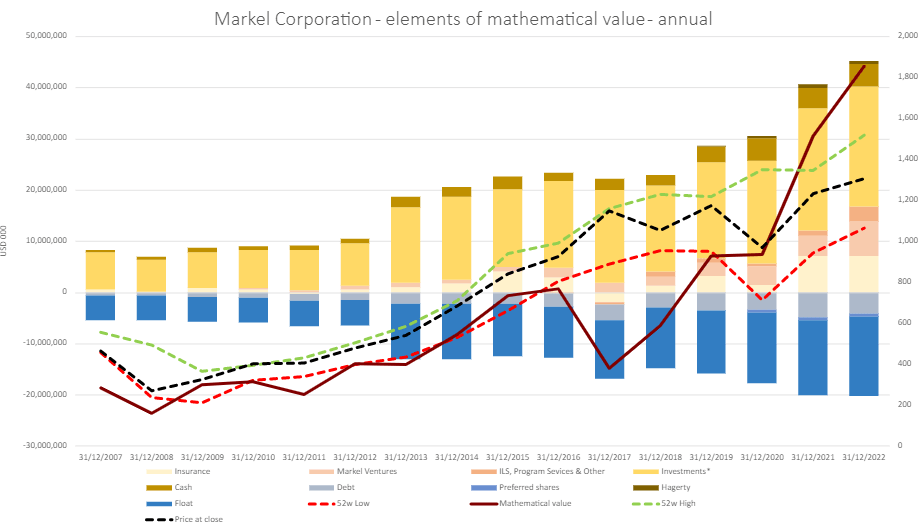
As visible from above, mathematical value based on annual figures per share is significantly currently equal to the market price offered for Markel. Markel uses 5-year time interval to measure its performance. In my case, based on what I have observed over time, even shorter period of 3 year would suffice to obtain the average values that are representative estimates of the current state of operations. Markel is a growing company, and use of 5 year averages would in most cases understate its size. With these average, and repeating the steps in the process described above, the following relationship between the historical prices and mathematical value is obtained.
Mathematical value - 3 year average figures (Author's calculation)
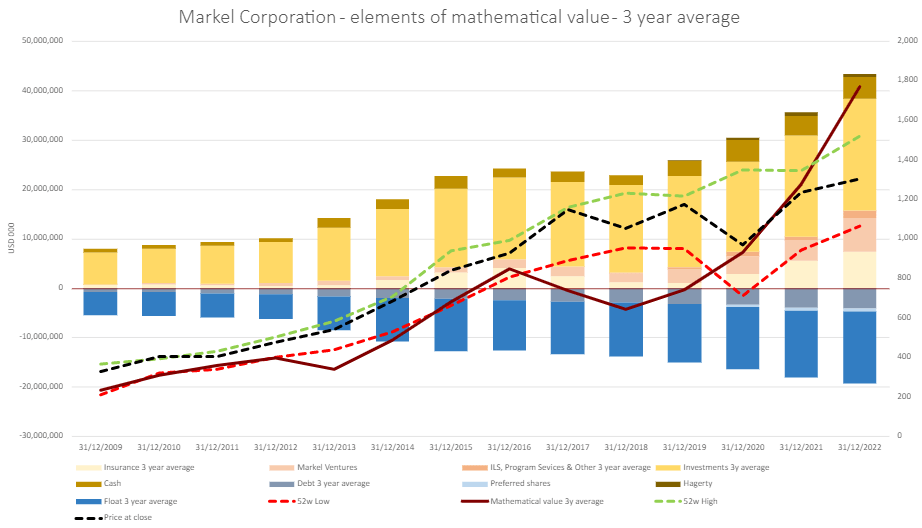
Using annual values, value of USD $1,850 is implied. Using 3-year average USD $1,765 is implied. As of February 2nd, price of one Markel share was USD $1,304.
Summary
Depending on your biases and expectations, these results can be disappointing or promising. Reality is, mathematical value as defined by Tom, or my modification of it, is not a valuation logic that has to be recognized by the market at any given point. My adjustment to it seems to be somewhat closer to historical market price of Markel. However, this can be an accident. Proper way of valuing Markel is to value all individual parts separately and then assume some achievable return that Markel could record on its invested capital, and apply it to some medium term period between five to ten years. Value shown here, does serve at least one purpose. It shows the simplified version of the earnings power value without the option of unconservative growth.
If you believe that Markel Corporation will at least continue to grow as it did historically, data above shows that this price level will promise you returns at least on par with historical market. Even as such, I feel much more comfortable in holding a long position in company like Markel, than holing a broad market index and currently it represents 5% of my portfolio. Given the latest market reaction after the Q4 2022 results , I might even consider adding to my position.
But, as Tom mentioned, correlation of any definition of the mathematical value with the price and book value is visible, and the direction is clear. Up and to the right!
Call For Comments
What is your view on the future development of Markel Corporation? Do you think its insurance business can outgrow the market while keeping the combined ratio at current levels? Can its equity portfolio continue to outperform the broad market index over a foreseeable future? Express your opinion, provide alternative assumptions and different opinions in the comment section below, and I will rerun my analysis using your inputs.
For further details see:
Markel Corporation: Calculating The Mathematical Value