ARCC - MCI: Strong Track Record But Not At A Bargain
2023-12-31 11:39:48 ET
Summary
- Barings Corporate Investors (MCI) has been benefiting from the higher rate environment that we've been in.
- That's been driving the fund's distribution higher, and there is currently strong distribution coverage even after they raised once again with the latest announcement.
- However, with expectations of rate cuts in the coming years, MCI may see a decrease in distribution if rates are slashed more than expected.
- Additionally, while MCI was at bargain prices for most of the last couple of years, that bargain has vanished and it looks about fairly valued.
Written by Nick Ackerman, co-produced by Stanford Chemist.
Barings Corporate Investors ( MCI ) is a fund that invests primarily in the private high-yield market. In particular, with significant exposure to floating rate securities and has been benefiting from that through higher income-generation. That has led to the fund increasing its distribution regularly over the last couple of years. Even the latest distribution announcement was good for another penny bump for the next quarter.
With all that being said, rates are looking like they are set to be cut over the coming years instead of increased. That doesn't mean that MCI can't continue to perform well; after all, rates aren't expected to go back to zero as they were in most of the last decade plus. Rather, we are likely seeing with peak rates that we are coming near peak distribution.
If rates end up being slashed even more than expected due to an economic slowdown, then we could see distribution cuts in the next couple of years. That's more of a worst-case scenario. If we get a soft landing and rates can come down in an orderly manner, then MCI could likely hold its payout fairly steady in the coming year or two.
Additionally, MCI is not currently very attractively priced. They report NAV quarterly, and based on the last reported NAV, we are looking at a bit of a premium. Though on the fund's website, they do list a discount based on the share price versus the NAV per share as of the last reporting date. That being said, NAV could have likely lifted at least a bit through this period.
MCI Assets And NAV Per Share (Barings)
MCI Basics
- 1-Year Z-score: 2.10
- Premium: 7.97% (based on last quarterly reported NAV)
- Distribution Yield: 8.25%
- Expense Ratio: 1.03%
- Leverage: 10.57%
- Managed Assets: $378.37 million
- Structure: Perpetual
MCI's investment objective is "to provide a consistent yield while at the same time offering an opportunity for capital gains." To achieve this, the fund invests in "privately placed, below-investment grade, long-term debt obligations of companies primarily domiciled in the U.S. These direct placement securities may, in some cases, be accompanied by equity features such as warrants, conversion rights and occasionally preferred stock."
This fund is quite old, with inception going back to 1971. The fund is also only modestly leveraged. When including the fund's leverage expenses, the total expense ratio comes to 1.66%.
Their leverage is split between a fixed-rate convertible note and a credit facility. The credit facility saw rising borrowing costs as they paid on their credit facility at a rate of LIBOR plus 2.25%, and they had $10 million withdrawn from that at the end of June 2023.
The $30 million in fixed-rate convertible notes pay interest at 3.53%, and "MassMutual, at its option, can convert the principal amount of the Note into common shares." The Note is due November 15, 2027, so they've locked in an enviable rate for a considerable period of time. That has helped keep the fund's expense ratio relatively stable due to keeping most of their borrowings at a fixed rate.
Performance Comparisons And Valuation
MCI might be in a traditional closed-end fund wrapper, but the fund has blown away its peers. Due to the fund's positioning, it probably isn't out of line to compare to business development companies instead. Below is a comparison to put this into some context. I've selected a couple of popular BDCs to put the performance against, as well as a few traditional CEFs for comparison. Those include Main Street Capital ( MAIN ), Ares Capital ( ARCC ), Apollo Senior Floating Rate Fund ( AFT ), BlackRock Floating Rate Income Strategies Fund ( FRA ) and Invesco Senior Income Trust ( VVR ).
However, Barings also manages a BDC themselves, the Bargins BDC ( BBDC ), which hasn't really been able to capture the same success. Though admittedly, it's not a name I've actually looked at before, so there could be an understandable reason for this.
Ycharts
BDCs don't have their total NAV returns tracked on Ycharts, but we can see that on a total return share price basis, MCI is somewhere in the middle. When looking at the total NAV returns, it inches the fund up in terms of total return results and puts it even closer to the BDC performance. It's also important to consider that MAIN trades at an extreme premium to its NAV per share; were that to deflate, it could easily fall to the same total return results we are seeing with MCI.
BDCs often have higher levels of fixed-rate borrowings and are more leveraged in general. They also work much more closely with the companies they are lending to rather than picking up securities on the secondary market as the traditional CEF wrapper managers do. Those are at least some of the reasons for the significant performance differences over the long term.
Over the shorter term of the last year, these baskets of investments have actually performed quite closely with traditional CEFs, even on occasion outperforming the BDC ARCC.
Ycharts
Given the last reported $17.07 NAV, that would put MCI at a premium trading level these days. The last it was reported, though, was at the end of September, so we are looking at a stale number. That's another similarity with BDCs; they only report NAV quarterly. With such a larger portion of their portfolio in private securities, this makes sense, as a daily NAV is likely not going to see very much in terms of fluctuations unless they are trading them around. A turnover of 5% in the last semi-annual report and 12% in the prior year suggests they weren't very active in this period.
That being said, NAV has likely increased at least a little bit since their last report. We can see that the Invesco Senior Loan ETF ( BKLN ) while holding fairly steady and probably most reflecting MCI's portfolio due to overwhelmingly being tied to bank loans, has inched higher in the last few months. iShares iBoxx High Yield Corporate Bond ETF ( HYG ) jumped even higher during this period as the risk-free Treasury Rates receded materially.
Author Note: From what I can presume, Ycharts above is reflecting a change in the NAV for MCI based on the distribution. When it goes ex-distribution date, those assets would be deducted from the fund. However, since they don't report NAV daily, we aren't getting what income is being earned and added back to the NAV, nor the potential realized/unrealized gains/losses during this period.
With the expectation that MCI has seen its NAV lift since they last reported, I don't believe it would be a large enough increase to push the fund to an attractive discount at this point. Therefore, while investors are likely quite happy with the results of the fund they are already holding, I don't necessarily think this is the time to be jumping into this name. However, it would mean that relative to the last reported NAV, the premium is probably at least a little lower than what it looks like today.
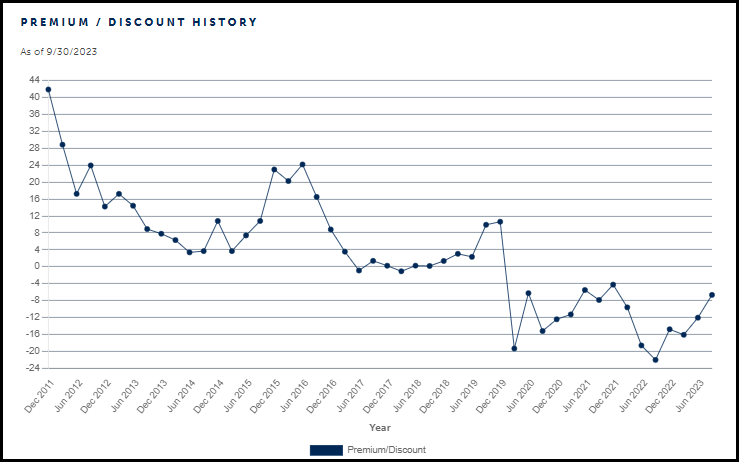
A discount closer to 5% would be attractive, but historically speaking, this fund has generally traded at near its NAV or even at a significant premium if you go back earlier in the decade. That could mean investors could be in for a longer wait before getting a more lucrative time to invest. Investors picking up the fund at a 10%+ discount in the last couple of years certainly got a great deal if history is any guide. I'd put shares of MCI around fairly valued currently, so it isn't a buy, but it is why I don't believe it is a sell, either.
MCI Premium/Discount Chart (Barings)
Distribution Looking Attractive With Solid Coverage
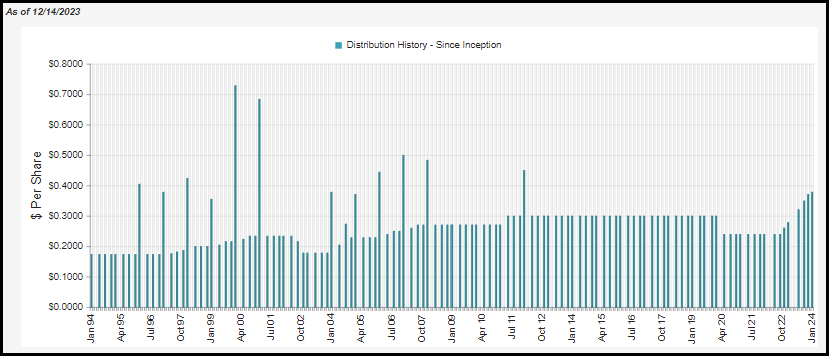
As mentioned, MCI has been benefiting from rate increases, boosting the fund's income generation from the underlying portfolio. This has resulted in the fund being able to pass on that higher income to investors through a fairly steady streak of quarterly increases over the last couple of years.
MCI Distribution History (CEFConnect)
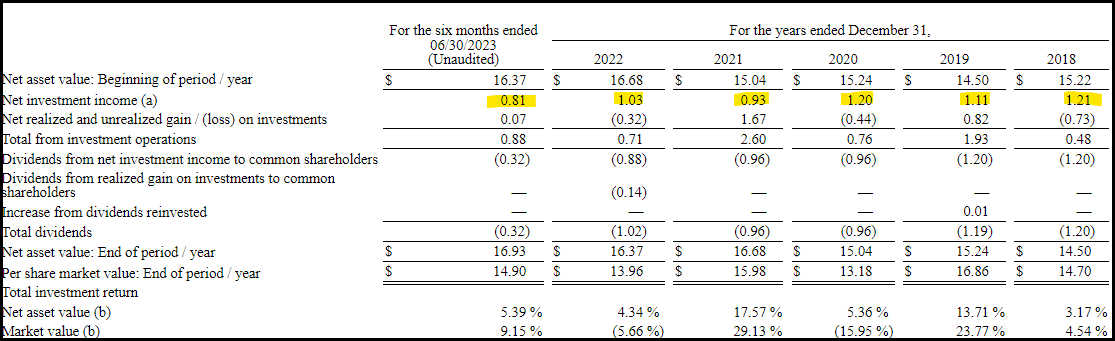
Looking at the fund's net investment income from their latest semi-annual report shows this is largely being supported. Given the last $0.81 for a six-month period, we would arrive at an annualized NII of $1.62. That is an astounding increase of 57.3% year-over-year. Interestingly, they were able to achieve this increase while even taking down leverage a touch from $46 million in borrowings to $40 million as of their last report.
MCI Financial Highlights (Barings (highlights from author))
This also puts the latest distribution coverage at nearly 107% based on the newly announced $0.38 distribution.
Therefore, it seems as though the fund has some wiggle room here. They can sustain some rate cuts before a distribution cut could be on the table. However, as a fund that is mostly invested in floating rate securities, we can see that the fund before this last decade, where rates hardly moved, had regularly adjusted their payout. If we are moving to a new environment where interest rates can be raised and lowered more regularly - instead of just at or very near zero - we could potentially expect that distribution gyration to return.
MCI's Portfolio
At the end of September, we can see that the fund did indeed hold primarily private debt investments. That accounted for nearly 96% of the fund's portfolio.
MCI Portfolio Composition (Barings)
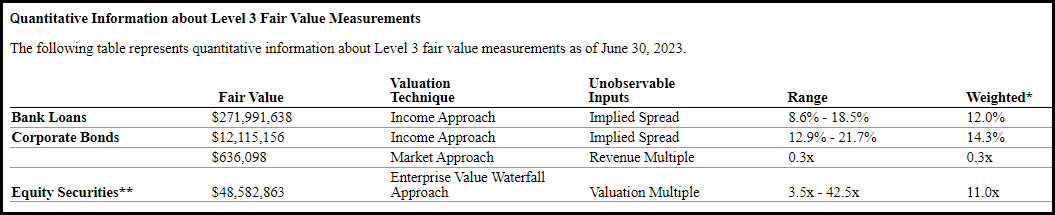
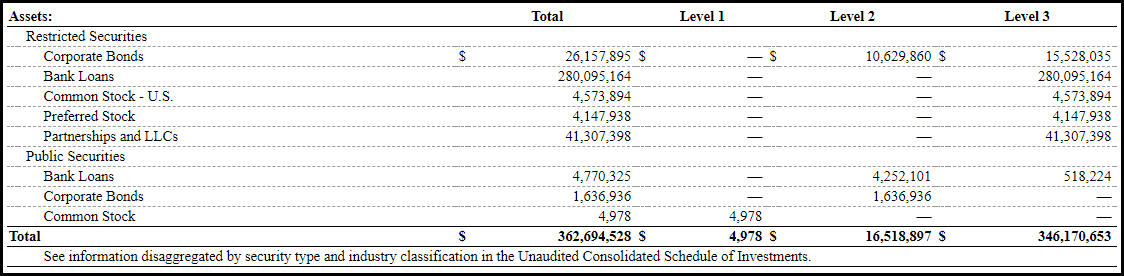
When dealing with private investments, we are looking at a fund with significant level 3 securities. Perhaps unsurprisingly, level 3 securities accounted for over 95% of the fund, similar to the allocation at the end of September into private investments. Level 3 securities seem to be more of an issue, with mostly equity investments being level 3 in terms of skepticism on the accuracy of their valuations. Often, those valuations don't get updated until a new funding round.
Instead, debt investments can be valued with an "income approach" where a spread can be garnered from what debt instruments are trading regularly on a secondary market.
MCI Portfolio Valuation Mechanics (Barings)
When looking at that breakdown, we can also see that most of the fund's investments in the high-yield space were bank loans. Bank loans are predominantly floating rate-based debt investments.
MCI Portfolio Level Breakdown (Barings)
In terms of sector allocation, the fund is tilted toward technology investments to a fairly large degree. Tech is a broad sector, and being that they are invested in the debt instruments of these underlying companies, the volatility here is likely to be relatively minimal as opposed to if it were equity investment. Tech equities are often quite volatile - though they've been booming for most of this year, at least the largest of the tech companies.
MCI Sector Weighting (Barings)
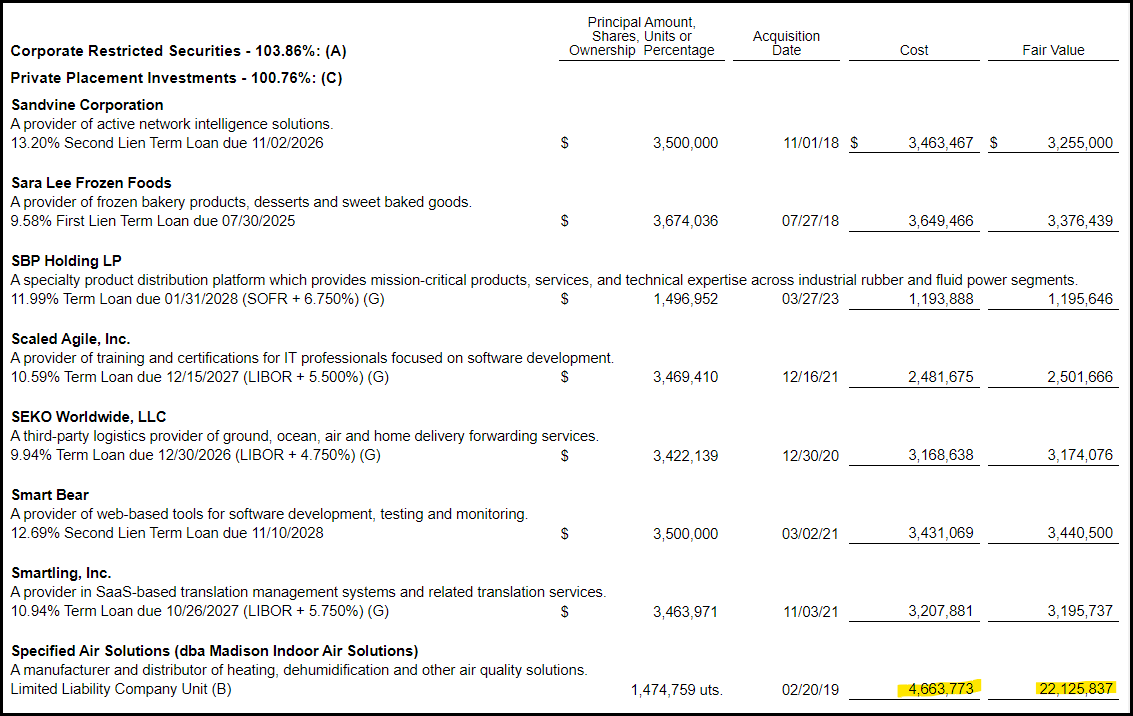
The top holdings of the fund are mostly diversified. The outlier here would be the fund's top holding, which accounts for nearly 6% of the fund's invested assets.
MCI Top Ten Holdings (Barings)
This became a particularly large investment for the fund due to its fair value skyrocketing. Their last report showed that they had a cost of $4.664 million, but the fair value has risen to $22.126 million. For a fund with less than $400 million in assets, that's a significant increase but a positive one.
MCI Portfolio (Barings (highlights from author))
This is a non-income-producing investment, and it is also one of the fund's equity investments.
Conclusion
MCI has a strong historical track record and is unique in terms of the private exposure that MCI carries. It makes it operate a bit more like a BDC rather than the traditional closed-end funds that we are familiar with. In the last couple of years, the fund has been able to increase its distribution significantly as its income generation increased due to the Fed's increasing rates. Interestingly, this was also a period where the fund's discount was substantial relative to its historical levels. Prior to that, the fund traded near its NAV per share for several years, similar to where it is today.
So, it's really looking mostly fair-valued here, in my opinion. Additionally, while it looks like a strong fund, the next two years aren't likely to produce the same success as the last two years. Investors currently holding are probably fine with continuing to do so; after all, rates aren't expected to go back to zero, and that should bode well for continuing to sustain higher distribution to investors. However, I would want to see a discount before being tempted to consider this name today.
For further details see:
MCI: Strong Track Record But Not At A Bargain