RRX - MDYV: A Good Mid-Cap ETF With 2 Shortcomings
2023-08-03 11:58:59 ET
Summary
- SPDR® S&P 400 Mid Cap Value ETF holds about 300 stocks selected with value and growth metrics.
- It is well-diversified across sectors and holdings.
- Past performance and liquidity make it a good trading instrument.
- The two shortcomings of value ETFs.
This article series aims at evaluating ETFs (exchange-traded funds) regarding past performance and portfolio metrics. Reviews with updated data are posted when necessary.
Strategy and portfolio
SPDR® S&P 400 Mid Cap Value ETF ( MDYV ) started investing operations on 11/8/2005 and tracks the S&P Mid-Cap 400 Value Index. It has 298 holdings, a 12-month distribution yield of 1.70%, and a total expense ratio of 0.15%.
As described by S&P Dow Jones Indices , S&P 400 constituents are ranked in Value and Growth styles using 6 valuation and growth metrics. The valuation ratios are book value to price, earnings to price, and sales to price. By construction, 33% of the parent index constituents exclusively belongs to each style, and 34% belongs to both styles. The Value subset serves as S&P 400 Value Index and is rebalanced annually. It is capital-weighted, with an adjustment for constituents belonging to both styles. For example, a company with a value rank better than its growth rank is given a larger weight in the Value Index than in the Growth Index.
Aggregate valuation metrics of MDYV are not much better than for the parent index S&P Mid-Cap 400, represented in the next table by iShares Core S&P Mid-Cap ETF ( IJH ). The price/earnings and price/cash flow ratios are almost identical.
| MDYV |
| IJH |
| Price/Earnings TTM |
| 13.6 |
| 13.7 |
| Price/Book |
| 1.71 |
| 2.22 |
| Price/Sales |
| 0.92 |
| 1.19 |
| Price/Cash Flow |
| 10.55 |
| 10.45 |
Source: Fidelity.
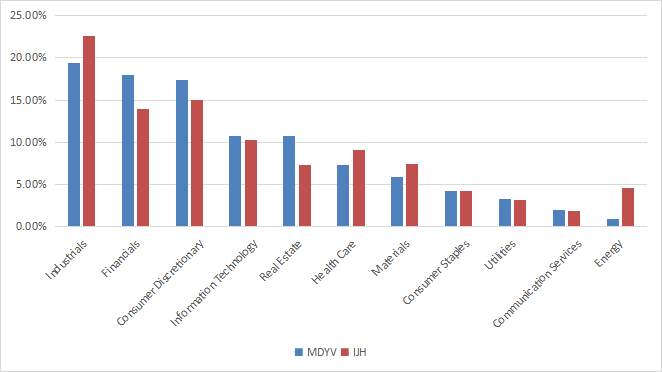
The heaviest sectors in the portfolio are industrials (19.5% of asset value), financials (18%) and consumer discretionary (17.4%). Other sectors are below 11%. Compared to IJH, MDYV overweights financials, consumer discretionary, real estate, and it massively underweights energy.
Sector breakdown (chart: author; data: SSGA, iShares)
MDYV has about 300 holdings. The top 10 names, listed below, represent 8.3% of asset value. The heaviest one weighs 1.25%, so risks related to individual companies are low.
| Ticker |
| Name |
| Weight% |
| P/E ttm |
| P/E fwd |
| P/Sales |
| P/Book |
| P/FCF |
| Yield% |
| Jabil, Inc. |
| 1.25 |
| 15.23 |
| 12.72 |
| 0.41 |
| 5.34 |
| 19.97 |
| 0.30 |
| Equity LifeStyle Properties, Inc. |
| 1.08 |
| 46.46 |
| 44.62 |
| 9.38 |
| 9.63 |
| 305.78 |
| 2.54 |
| Regal Rexnord Corp. |
| 0.95 |
| 43.42 |
| 15.43 |
| 1.93 |
| 1.68 |
| 26.17 |
| 0.87 |
| New York Community Bancorp, Inc. |
| 0.85 |
| 3.34 |
| 3.29 |
| 1.53 |
| 0.92 |
| 2.93 |
| 5.06 |
| Reinsurance Group of America, Inc. |
| 0.81 |
| 10.33 |
| 8.10 |
| 0.59 |
| 1.27 |
| 3.84 |
| 2.25 |
| Fortune Brands Innovations, Inc. |
| 0.79 |
| 18.31 |
| 18.37 |
| 1.68 |
| 4.16 |
| 13.84 |
| 1.29 |
| Lear Corp. |
| 0.79 |
| 17.32 |
| 12.86 |
| 0.40 |
| 1.81 |
| 34.00 |
| 2.03 |
| Cleveland-Cliffs, Inc. |
| 0.79 |
| 37.94 |
| 11.01 |
| 0.39 |
| 1.10 |
| 7.96 |
| 0 |
| Unum Group |
| 0.78 |
| 6.83 |
| 6.51 |
| 0.80 |
| N/A |
| 11.17 |
| 2.97 |
| Lithia Motors, Inc. |
| 0.73 |
| 7.59 |
| 7.99 |
| 0.29 |
| 1.44 |
| N/A |
| 0.66 |
Ratios: Portfolio123.
Competitors
MDYV has two direct competitors tracking the same underlying index: iShares S&P Mid-Cap 400 Value ETF ( IJJ ) and Vanguard S&P Mid-Cap 400 Value ETF ( IVOV ). The next table compares their asset values, volumes, fees and inception dates.
| S&P Mid-Cap 400 Value ETFs |
| MDYV |
| IJJ |
| IVOV |
| AUM |
| $2.36B |
| $7.35B |
| $0.83B |
| Avg Daily Volume |
| $9.94M |
| $27.92M |
| $2.08M |
| Expense Ratio |
| 0.15% |
| 0.18% |
| 0.15% |
| Inception |
| 11/8/2005 |
| 7/24/2000 |
| 09/07/2010 |
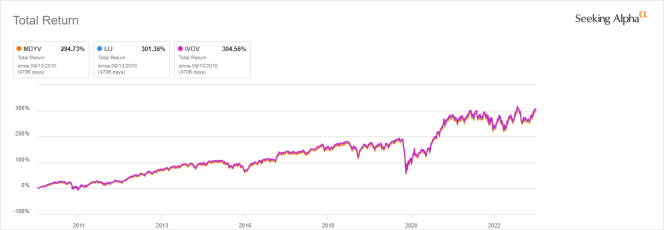
MDYV shows a minor negative drift since IVOV inception (see next chart).
IJJ, MDYV and IVOV since September 2010 (Seeking Alpha)
However, the three funds have almost identical returns in the last 5 years (next chart). MDYV may have suffered from tracking errors years ago, but it seems they have been fixed.
IJJ, MDYV and IVOV, last 5 years (Seeking Alpha)
Performance
Since inception in November 2005, MDYV has lagged the parent index by about one percentage point in annualized return, as reported in the next table. It is also a bit riskier, regarding maximum drawdown and standard deviation of monthly returns (volatility).
| Total Return |
| Annual.Return |
| Drawdown |
| Sharpe ratio |
| Volatility |
| MDYV |
| 290.46% |
| 8.01% |
| -60.71% |
| 0.44 |
| 19.54% |
| IJH |
| 365.59% |
| 9.09% |
| -55.07% |
| 0.51 |
| 18.40% |
Data calculated with Portfolio123.
However, based on IJJ performance, the underlying index has outperformed IJH by one percentage point in annualized return since 8/1/2000.
| Total Return |
| Annual.Return |
| Drawdown |
| Sharpe ratio |
| Volatility |
| IJJ |
| 813.51% |
| 10.09% |
| -58.00% |
| 0.52 |
| 18.60% |
| IJH |
| 641.14% |
| 9.10% |
| -55.07% |
| 0.47 |
| 17.93% |
The S&P Mid-Cap 400 Value Index has a competitor: the Russell Mid-Cap Value Index, tracked by the iShares Russell Mid-Cap Value ETF ( IWS ) since 7/17/2001. Based on IIJ price history, both indexes have been on par until Q2 2022, then the S&P index took the lead. However, it is unlikely to be significant in the long term.
S&P Mid-Cap 400 Value Index vs. Russell Mid-Cap Value Index (Seeking Alpha)
The next chart compares the 10-year total returns of MDYV, IWS and three other mid-cap value funds:
- Vanguard Mid-Cap Value ETF ( VOE ),
- iShares Morningstar Mid-Cap Value ETF ( IMCV ),
- Invesco S&P MidCap 400 Pure Value ETF ( RFV ).
MDYV is the second best performer after RFV.
MDYV vs other mid-cap value funds, last 10 years (Seeking Alpha)
Compari son with my Dashboard List model
The Dashboard List is a list of 60 to 80 stocks in the S&P 1500 index, updated every month based on a simple quantitative methodology. All stocks in the Dashboard List are cheaper than their respective industry median in Price/Earnings, Price/Sales and Price/Free Cash Flow. An exception in utilities: the Price/Free Cash Flow is not taken into account to avoid some inconsistencies. Then, the 10 eligible companies with the highest Return on Equity in every sector are kept in the list. Some sectors are grouped together: energy with materials, communication with technology. Real estate is excluded because these valuation metrics don't work well in this sector. I have been updating the Dashboard List every month on Seeking Alpha since December 2015, first in free-access articles, then in Quantitative Risk & Value.
The next table compares MDYV underlying index (based on IJJ price history) since 8/1/2000 with the Dashboard List model, with a tweak: here, the list is reconstituted once a year to make it comparable with a passive index.
| Total Return |
| Annual.Return |
| Drawdown |
| Sharpe ratio |
| Volatility |
| IJJ |
| 813.51% |
| 10.09% |
| -58.00% |
| 0.52 |
| 18.60% |
| Dashboard List (annual) |
| 1269.10% |
| 12.05% |
| -57.64% |
| 0.65 |
| 17.26% |
Past performance is not a guarantee of future returns. Data Source: Portfolio123.
The Dashboard List outperforms MDYV by about 2 percentage points in annualized return. A note of caution: ETF price history is real, whereas the model simulation is hypothetical.
The two shortcomings of value ETFs
I like the idea of mixing various ratios to rank value stocks. However, I think most value indexes doing so have two weaknesses, and MDYV is no exception. The first one is to classify all stocks on the same criteria. It means the valuation ratios are considered comparable across sectors. Obviously, they are not: my monthly dashboard here shows how valuation and quality metrics may vary across sectors.
The second weakness comes from the price/book ratio (P/B), which adds some risk in the strategy. Historical data show that a large group of companies with low P/B has a higher volatility and deeper drawdowns than a same-size group with low price/earnings, price/sales or price/free cash flow. The next table shows the return and risk metrics of the cheapest quarter of the S&P 500 (i.e., 125 stocks) measured in price/book, price/earnings, price/sales and price/free cash flow. The sets are reconstituted annually between 1/1/2000 and 1/1/2023 with elements in equal weight.
| Annual.Return |
| Drawdown |
| Sharpe ratio |
| Volatility |
| Cheapest quarter in P/B |
| 8.54% |
| -81.55% |
| 0.35 |
| 37.06% |
| Cheapest quarter in P/E |
| 10.71% |
| -73.62% |
| 0.48 |
| 25.01% |
| Cheapest quarter in P/S |
| 12.82% |
| -76.16% |
| 0.47 |
| 34.83% |
| Cheapest quarter in P/FCF |
| 15.32% |
| -74.77% |
| 0.61 |
| 27.03% |
Data calculated with Portfolio123.
This explains why I use P/FCF and not P/B in the Dashboard List model.
Takeaway
SPDR S&P 400 Mid Cap Value ETF picks and weights constituents based on various value and growth metrics. Two other ETFs have the same underlying index: IJJ and IVOV. They are equivalents as buy-and-hold investments. However, MDYV and IJJ have higher trading volumes, which is better for trading purposes and tactical allocation. For example, MDYV may be part of a strategy switching between value and growth styles, or between large and mid-cap segments. The fund’s underlying index has outperformed the mid-cap benchmark S&P 400 by 1% in annualized return since 2000. Like most value ETFs, it has two shortcomings: ranking stocks regardless of their industries, and relying too much on the price/book ratio.
For further details see:
MDYV: A Good Mid-Cap ETF With 2 Shortcomings