SKIN - Meridian Small Cap Growth Fund Q2 2023 Investment Commentary
2023-08-22 23:41:00 ET
Summary
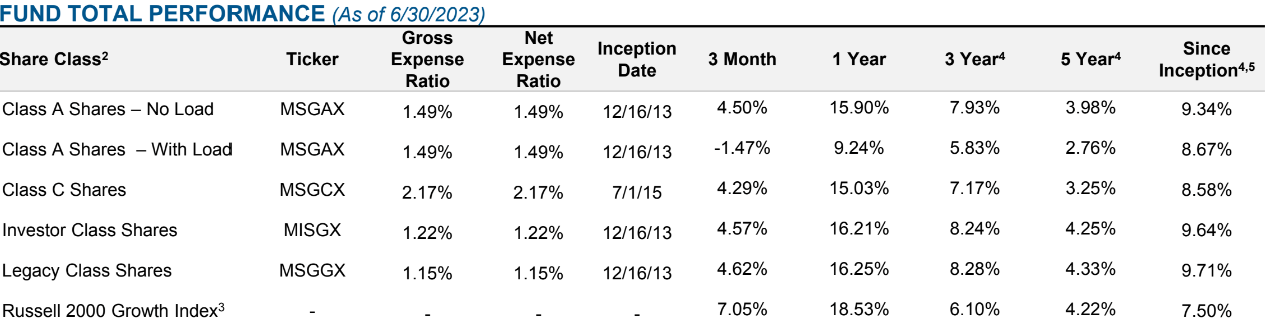
- The Meridian Small Cap Growth Fund returned 4.62% (net) during the quarter ended June 30, 2023, underperforming its benchmark, the Russell 2000 Growth Index, which returned 7.05%.
- The Fund's top contributors included NeoGames SA, ACV Auctions, and Alkami Technology, while detractors included The Beauty Health Company, PagerDuty, and Certara.
- Overall core inflation remains high, with the Fed signaling more rate increases will be necessary to achieve their goals, potentially leading to further market volatility.
Market Summary
With inflation gradually easing and the U.S. economy holding firm, stocks generally advanced during the second quarter. Conditions prompted U.S. Federal Reserve (“Fed”) officials to pause their aggressive rate-hike campaign in June and forecast that the U.S. would avoid a recession in 2023. Fed Chair Jerome Powell did assert, however, that markets should expect further rate increases in the coming months, perhaps as many as two more by year-end. Running counter to stock investors’ general optimism, bond investors drove short- and long-duration yields higher, further sharpening the already inverted U.S. Treasury yield curve.
Fueled by a surge in artificial intelligence-related technology stocks, double-digit gains in large cap growth stocks led the market higher, according to the Russell family of indices. Among small cap stocks, growth stocks outperformed value stocks.
Fund Performance
The Meridian Small Cap Growth Fund (the “Fund”) returned 4.62% (Net) during the quarter ended June 30, 2023, underperforming its benchmark, the Russell 2000 Growth Index, which returned 7.05%.
Our investment process prioritizes the management of risk over the opportunity for return. We look to build an enduring Fund that can mitigate capital losses during turbulent bear market environments and, secondarily, participate on the upside during strong market environments. Muted market volatility—the index declined more than 2% just once during the quarter—limited the impact of our philosophy during the period.
Otherwise, unique market dynamics presented a mixed return landscape. For example, both high- and low- momentum stocks outperformed, although modestly better returns in high-momentum stocks created a headwind for our Fund, in which our valuation discipline emphasizes more lower-momentum stocks. In addition, advances among companies without earnings also weighed on performance. From a sector perspective, stock selection was positive in the consumer discretionary and industrials sectors. Conversely, holdings in the healthcare sector detracted from relative returns.
Top 10 Holdings (% of Portfolio)
Bottom Three Detractors
Three individual detractors from the Fund’s relative performance during the period included The Beauty Health Company ( SKIN ), PagerDuty, Inc. ( PD ), and Certara, Inc. ( CERT ).
The Beauty Health Company produces advanced skin care systems that bridge the gap between medical professional procedures and over-the-counter creams and lotions. Its flagship HydraFacial line consists of equipment sold to medical spas and dermatology offices and cleansing and hydrating treatments used in its systems. The consumables account for roughly half of HydraFacial’s revenues. Its newly introduced Syndeo platform has a more robust feature set that includes enhanced data capture to help personalize and elevate the patient experience. The company has regularly posted double-digit growth, but the stock retreated during the quarter as results missed consensus expectations. International challenges, most notably sluggish sales early in the quarter in China and increased investments to ready Syndeo for a global launch, weighed on performance. Lower margins on refurbished equipment sales also hindered results. Nonetheless, the company raised its full-year target for overall revenues. As we’re encouraged that China sales will rebound—especially given a partial recovery in March—and Syndeo will bolster the company’s global business, we remain optimistic about Beauty Health and added to our exposure.
The Fund’s performance data represents past performance and does not guarantee future results. Current performance may be lower or higher than the performance data shown. The investment return and principal value of an investment will fluctuate so that you may have a gain or loss upon sale. You can obtain performance data current to the most recent month-end at Meridian Funds .
PagerDuty, Inc. offers a cloud-based digital operations management platform focused on incident response services. The company uses automation and machine learning to identify IT incidents and engage operations teams to take action in real- time. Clients and investors are both attracted to PagerDuty due to an extremely rapid payback period when taking into account the high cost of digital downtime. We also like the database nature of the business model that uses historical incidents and detailed employee directories to quickly identify the most capable team and the most likely solution to rapidly resolve incidents. The stock lagged the market during the quarter as management lowered sales guidance, citing challenges in the small- and mid-sized business segment and higher-than- expected churn. However, despite the reduced revenue goal, the company raised profitability guidance and we added to our position as the stock underperformed.
Certara, Inc . develops technology to streamline drug development through biosimulations that model how investigational compounds interact at varied dosing levels with organs and other drugs. Although the technology is still relatively new, a large majority of the most recent 100 drugs that received Food and Drug Administration approval tapped a Certara solution at some point in the process. The company continues to grow and increase its penetration with new and existing clients. It has also largely been insulated from the industry spending slowdown that clipped the revenues of clinical research organizations. Late in the quarter, however, the company cautiously acknowledged that it was experiencing longer sales cycles amid funding pressures within the biotechnology industry and heightened discipline in research and development spending among large pharmaceutical companies. Although management didn’t discuss potential impacts on Certara’s outlook, such conditions can be a recipe for slower revenue growth in the near term, so the stock sold off. Although we continue to believe in the long-term prospects of the company, we slightly trimmed our exposure to the stock.
Top Three Contributors
Three individual contributors to the Fund’s relative performance during the quarter included NeoGames SA ( NGMS ), ACV Auctions, Inc. ( ACVA ), and Alkami Technology, Inc. ( ALKT ).
NeoGames SA develops the technology backbone that supports online gaming platforms such as lotteries and sports betting sites. Already well-established in the online lottery space, the company expanded into online sports betting and casino games in 2022 with the acquisition of Aspire Global. In addition to gaming software, NeoGames’ services include regulatory compliance, content aggregation, payment processing, risk management, and customer loyalty programs. The stock appreciated in mid-May when Australia-based Aristocrat Leisure announced it was acquiring NeoGames at a better than 100% premium. We took advantage of the subsequent price appreciation to trim the position.
ACV Auctions, Inc. operates a digital wholesale auction marketplace to facilitate business-to-business used car sales between sellers and dealers. It has disrupted the traditional physical used-car auction marketplace by attracting thousands of dealers to its online platform. ACV’s competitive advantage is its sizeable team of inspectors and the technology tools supporting this team. The depth and accuracy of ACV’s inspection reports provide buyers the confidence to bid aggressively, knowing that they are unlikely to contend with negative post-purchase surprises. Sellers are drawn to ACV due to its lower auction fees and large buyer base. Strong quarterly results, featuring better-than-expected revenue growth and sharply improving margins, propelled the stock higher during the period. Just as critically, ACV continued to capture a significant amount of market share, posting positive unit volume growth amid the broader industry’s decline. Separately, the company presented projections through 2026, which targeted considerable gains in revenue and EBITDA. We slightly reduced our holdings in the company during the quarter due to a less favorable risk- reward profile.
Alkami Technology, Inc . develops cloud-based digital banking and software services for U.S.-based banks and credit unions. Alkami allows its customers to outsource non- core software development and benefit from an enterprise- grade software suite. The company is capturing share within a sizeable addressable market, provides a mission-critical service to its client base, and benefits from highly attractive unit economics, which are bolstered by a high 90% client retention rate. Furthermore, its cost of adding new clients is extraordinarily low compared to many other software-as-a- service companies, which we believe will drive significant improvements in profitability over the next couple of years. The company opened the quarter under a cloud of uncertainty following the springtime failure of three regional banks. However, the concerns proved unwarranted for Alkami, which reported solid growth in revenue and profitability as well as continued strength in its new business pipeline. Encouraged by the company’s outlook and its ability to sidestep such challenges, we added to our position during the quarter.
Outlook
At quarter-end, the economic softness expected in the wake of the Fed’s aggressive actions over the previous 16 months had failed to materialize. The employment picture and broader economic conditions remained relatively healthy. Inflation gauges, while still above targeted levels, have continued to moderate which has led to increased confidence in a soft landing. Despite this backdrop, overall core inflation remains high, with the Fed signaling more rate increases will be necessary to achieve their goals, potentially leading to further market volatility. We remain poised to take advantage of any market weakness and multiple contraction by adding to existing positions and building positions in new names when valuations decline to attractive levels, although we remain cognizant of the risks inherent in such a challenging environment. We remain focused on companies that have resilient business models and the ability to execute in a higher rate environment.
The Fund’s performance data represents past performance and does not guarantee future results. Current performance may be lower or higher than the performance data shown. The investment return and principal value of an investment will fluctuate so that you may have a gain or loss upon sale. You can obtain performance data current to the most recent month-end at www.arrowmarkpartners.com/meridian.
1 Listed holdings are presented to illustrate examples of the securities the Fund has bought and do not represent all of the Fund’s holdings or future investments. Information about the Fund’s holdings should not be considered investment advice. There is no guarantee that the Fund will continue to hold any one particular security or stay invested in any one particular sector. Holdings are subject to change at any time and are as of the date shown above.
2 Share classes are closed to new investors.
3 The Fund’s Index, the Russell 2000® Growth Index, measures the performance of the small-cap growth segment of the U.S. equity universe. It includes those Russell 2000 Index companies with higher price-to-value ratios and higher forecasted growth values. One cannot invest directly into an index.
4 Performance is annualized.
5 Since inception returns are calculated using the Fund’s Legacy class inception date of 12/16/13.
A Class: Prior to 7/1/15, the A Class was named Advisor Class. The historical performance shown for periods prior to inception on 12/16/13 was calculated using historical Legacy class performance as adjusted for estimated class-specific expenses, for distribution, shareholder servicing and sub-transfer agency fees, without consideration to any expense limitation or waivers. The annual gross expense ratio is 1.49% as of 12/30/22. The net expense ratio is 1.49% as of 12/30/22. If the class had been offered prior to 12/16/13, the actual performance and expenses may have differed from the amounts shown. Performance shown for class A shares with load includes the Fund’s maximum sales charge of 5.75%.
C Class: The historical performance shown for periods prior to inception on 7/1/15 was calculated using historical Legacy class performance as adjusted for estimated class-specific expenses, for distribution, shareholder servicing and sub-transfer agency fees, without consideration to any expense limitation or waivers. The annual gross expense ratio is 2.17% as of 12/30/22. The net expense ratio is 2.17% as of 12/30/22. If the class had been offered prior to 7/1/15, the actual performance and expenses may have differed from the amounts shown.
Investor Class: The historical performance shown for periods prior to inception on 12/16/13 was calculated using historical Legacy class performance as adjusted for estimated class-specific expenses for shareholder servicing and sub-transfer agency fees without consideration to any expense limitation or waivers. The annual gross expense ratio is 1.22% as of 12/30/22. The annual net expense ratio is 1.22% as of 12/30/22.
Legacy Class: The annual gross expense ratio is 1.15% as of 12/30/22. The annual net expense ratio is 1.15% as of 12/30/22. Legacy class shares of the Fund are no longer available for purchase by new investors, except under certain limited circumstances which are described in the Statement of Additional Information.
Principal Investment Risks
There are risks involved with any investment. The principal risks associated with an investment in the Fund, which could adversely affect its net asset value, yield and return, are set forth below. Please see the section “Further Information About Principal Risks” in the Prospectus for a more detailed discussion of these risks and other factors you should carefully consider before deciding to invest in the Fund. An investment in the Fund may lose money and is not a deposit of a bank or insured or guaranteed by the Federal Deposit Insurance Corporation or any other governmental agency. Investment Strategy Risk: The Investment Adviser uses the Fund’s principal investment strategies and other investment strategies to seek to achieve the Fund’s investment objective of long-term growth of capital. There is no assurance that the Investment Adviser’s investment strategies or securities selection method will achieve that investment objective. Equity Securities Risk: Equity securities fluctuate in price and value in response to many factors including historical and prospective earnings of the issuer and its financial condition, the value of its assets, general economic conditions, interest rates, investors’ perceptions and market liquidity. Market Risk: The value of the Fund’s investments will fluctuate in response to the activities of individual companies and general stock market and economic conditions. As a result, the value of your investment in the Fund may be more or less than your purchase price. Growth Securities Risk: Because growth securities typically trade at a higher multiple of earnings than other types of securities, the market values of growth securities may be more sensitive to changes in current or expected earnings than the market values of other types of securities. In addition, growth securities, at times, may not perform as well as value securities or the stock market in general, and may be out of favor with investors for varying periods of time. Small Company Risk: Generally, the smaller the capitalization of a company, the greater the risk associated with an investment in the company. The stock prices of small capitalization and newer companies tend to fluctuate more than those of larger capitalized and/or more established companies and generally have a smaller market for their shares than do large capitalization companies. Foreign Securities Risk: Investments in foreign securities may be subject to more risks than those associated with U.S. investments, including currency fluctuations, political and economic instability and differences in accounting, auditing and financial reporting standards. Foreign securities may be less liquid than domestic securities so that the Fund may, at times, be unable to sell foreign securities at desirable times or prices. In addition, emerging market securities involve greater risk and more volatility than those of companies in more developed markets. Significant levels of foreign taxes are also a risk related to foreign investments. Glossary: Amortization: Gradually writing off the initial cost of an intangible asset. Earnings Per Share: A company’s profit divided by its number of common shares outstanding. EBITDA: Earnings before interest, taxes, depreciation & amortization. Free Cash Flow: A measure of a company’s financial performance, calculated as operating cash flow minus capital expenditures. Price to Earnings: A valuation ratio of current share price compared to its per-share operating earnings over the previous four quarters. Basis Point: A common unit of measure for interest rates and other percentages in finance. One basis point is equal to 1/100th of 1%, or 0.01%, or 0.0001, and is used to denote the percentage change in a financial instrument.
ALPS Distributors, Inc., a member FINRA, is the distributor of the Meridian Mutual Funds, advised by ArrowMark Colorado Holdings, LLC. ALPS, Meridian and ArrowMark are unaffiliated.
The statements and opinions expressed in this commentary are as of the date of the commentary. All information is historical and not indicative of future results and is subject to change.
Editor's Note: The summary bullets for this article were chosen by Seeking Alpha editors.
For further details see:
Meridian Small Cap Growth Fund Q2 2023 Investment Commentary