ET - MLP Preferred Units Ranked By Quality
2023-03-30 05:00:15 ET
Summary
- Preferred MLP units offer consistent dividends and enhanced bankruptcy protections.
- The MLP preferred units evaluated pay distributions with forward yields ranging from 6.3% to 12.2%.
- Thirteen MLP Preferred Units were evaluated using a quality matrix with factors, including Forward Yield, Distribution Coverage Ratio based on free cash flow, and Distribution Coverage Ratio based on earnings.
- Based on this analysis, I recommend those investors who are interested in MLP preferred units first consider GLP.PB, GLP.PA, DCP.PB, DCP.PC, and ET.PD.
Background
Master Limited Partnerships (MLPs) often focus on midstream energy including pipelines, storage, and transport. MLPs are publicly listed limited partnerships with MLP units that trade much like stock shares. Investors who purchase MLP units become limited partners in the MLP and receive guaranteed cash distributions. Preferred MLP units offer not only consistent dividends but also, enhanced bankruptcy protections.
The MLP preferred units evaluated below pay distributions with forward yields ranging from 6.3% to 12.2%. Further, distribution coverage ratios as measured by free cash flow and earnings vary widely. Please note: many MLPs and some analysts often refer to distributable cash flow in presentations and analysis. However distributable cash flow can be calculated differently by different MLPs. Therefore, coverage ratios in the following analysis were based on free cash flow and earnings.
MLP Preferred Units Ranked by Relative Quality
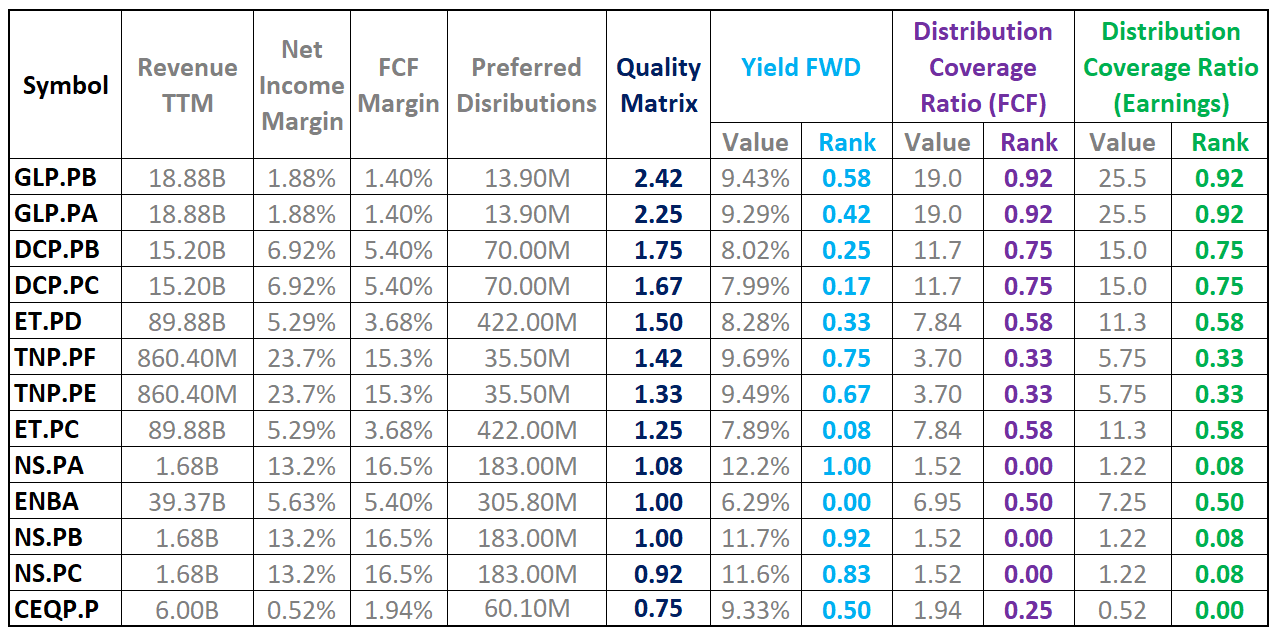
Thirteen MLP Preferred Units were evaluated using a quality matrix with factors including, Forward Yield, Distribution Coverage Ratio based on free cash flow, and Distribution Coverage Ratio based on earnings. The values for each MLP's factors were normalized by means of statistical percent ranking with relation to the group. The quality matrix was calculated as the sum of the percent ranks of the factors.
MLP Preferred Units Ranked by Quality
Author, SA Data
The above chart is sorted in descending order of the best quality (highest matrix score) to the poorest quality (lowest matrix score).
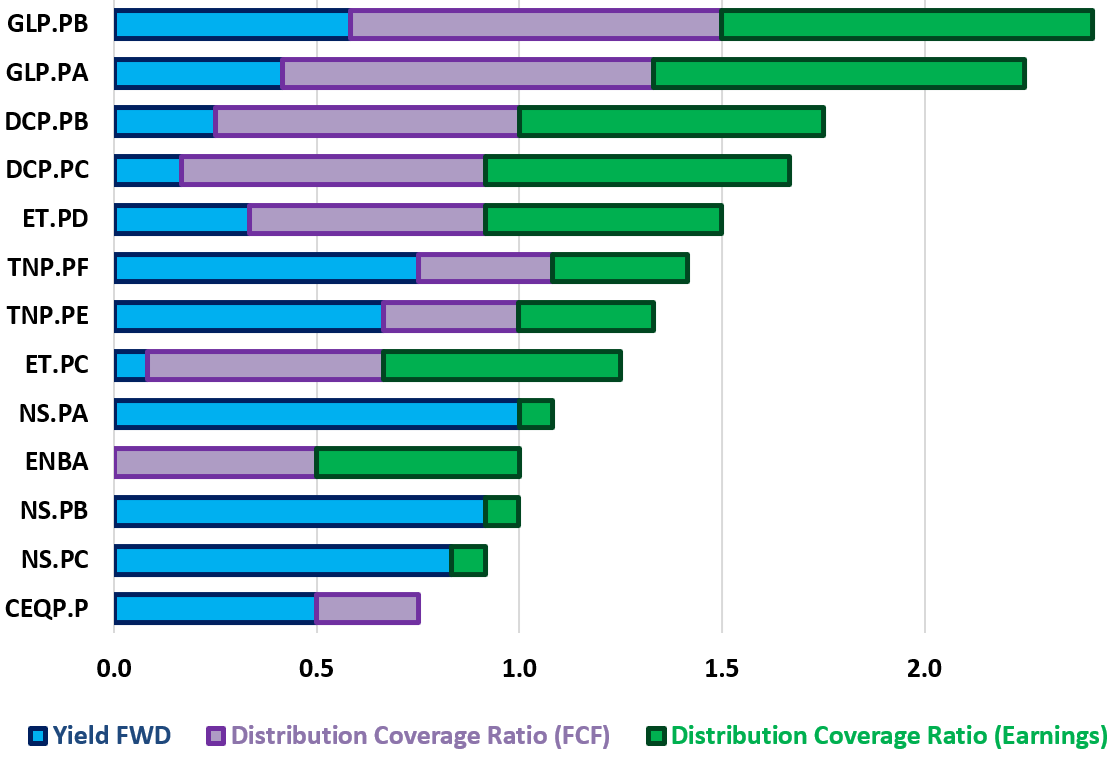
MLP Preferred Units Quality Plot
Author, SA Data
The quality matrix is presented graphically in the stacked bar chart above with cumulative inputs for each factor. Based on this analysis, the top-5 highest quality MLP Preferred Units are:
- Global Partners LP 9.50 RED PFD B ( GLP.PB )
- Global Partners LP 9.75 PFD UT SR A ( GLP.PA )
- DCP Midstream, LP 7.875 CUM RED B ( DCP.PB )
- DCP Midstream, LP 7.95 SR C PFD UT ( DCP.PC )
- Energy Transfer LP 7.625 PFD UNIT D ( ET.PD )
Based on this analysis, the poorest quality MLP Preferred Units are:
- Crestwood Equity Partners LP - Unit - Pfd Unit 9.25% ( CEQP.P )
- NuStar Energy L.P. 9.00% CUM PFD C ( NS.PC )
- NuStar Energy L.P. RED PFD SER B ( NS.PB )
Please note: I would not advise investors to sell MLP preferred units without carefully considering tax implications and/or consulting a trusted accountant or tax advisor. MLP Distributions are not taxed like dividends; distributions are considered a reduction in the cost basis in the MLP investment. The tax liability from the distributions is only realized when the MLP unit is sold.
A note on data quality and sourcing: All data were sourced from Seeking Alpha. Preferred distributions for each MLP were tabulated from the Preferred Dividend and Other Adjustments line found in the balance sheet under the Financials tab on each MLP's ticker page. Further, current free cash flow margin was not available for Tsakos Energy Navigation Limited. In this case, 2021 free cash flow margin was taken as a reasonable stand-in for current free cash flow margin. An Excel spreadsheet including all data and calculations is available here: MLP_Preferred_Units_Ranked_by_Quality.xlsx .
Quality Matrix Limitations
Investors should consider the quality matrix a screen only. The matrix and its factors, normalization method, and weights could all be adjusted and yield different results. Further, the matrix is based on the most readily available and common metrics. These metrics can change rapidly with share price or as new company reports are released. It does not include company-specific data available in quarterly reports and presentations. Every individual investment of any kind should be based on a comprehensive analysis of that investment and the investor's risk tolerance & goals.
Conclusions and Recommendations
Investors who are interested in a broader survey of midstream energy may find Midstream Energy Stocks Ranked By Quality helpful. Those who investors who are specifically interested in Crestwood Equity Partners LP can find a detailed discussion of that midstream's preferred shares here: Crestwood Equity Partners Preferreds: Sell On Limited Upside .
Based on this analysis, I recommend those investors who are interested in MLP preferred units first consider GLP.PB, GLP.PA, DCP.PB, DCP.PC, and ET.PD.
Information is a source of learning. But unless it is organized, processed, and available to the right people in a format for decision making, it is a burden, not a benefit. - William Pollard (Physicist and Theologian)
For further details see:
MLP Preferred Units Ranked By Quality