MODV - ModivCare: Notable Buying Trends In Recent Weeks Uncertainties Remain
2023-10-17 16:00:00 ET
Summary
- ModivCare Inc. shares are trading at their lowest point since mid-2013.
- The stock trades at discounted multiples compared to sector peers, but concerns remain about insufficient returns on new capital, mixed unit economics, and ongoing economic losses.
- On the balance of data, market technicals and investor positioning appear equally mixed, creating an uncertain debate moving forward.
Investment Summary
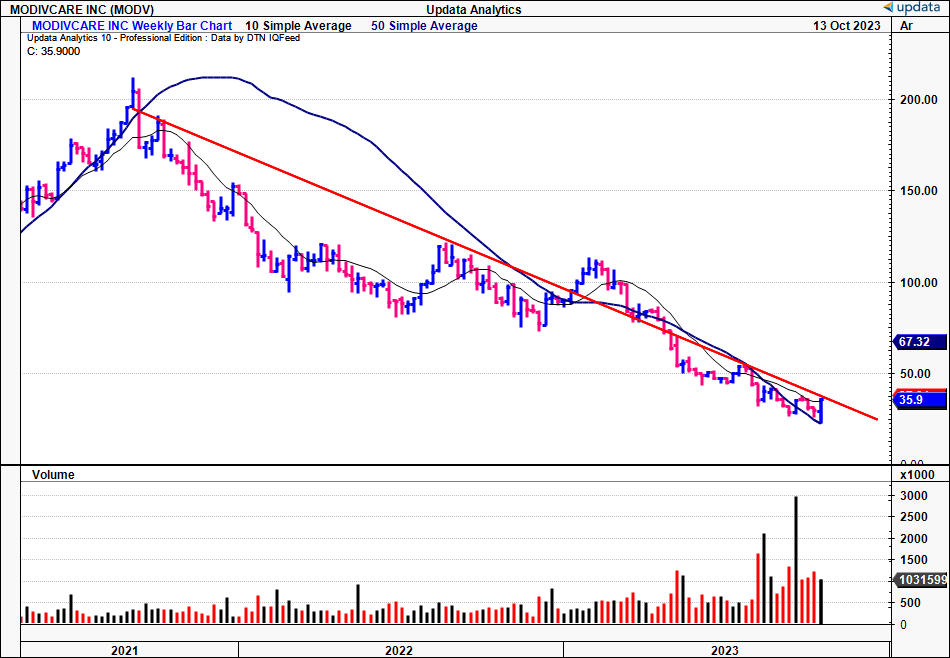
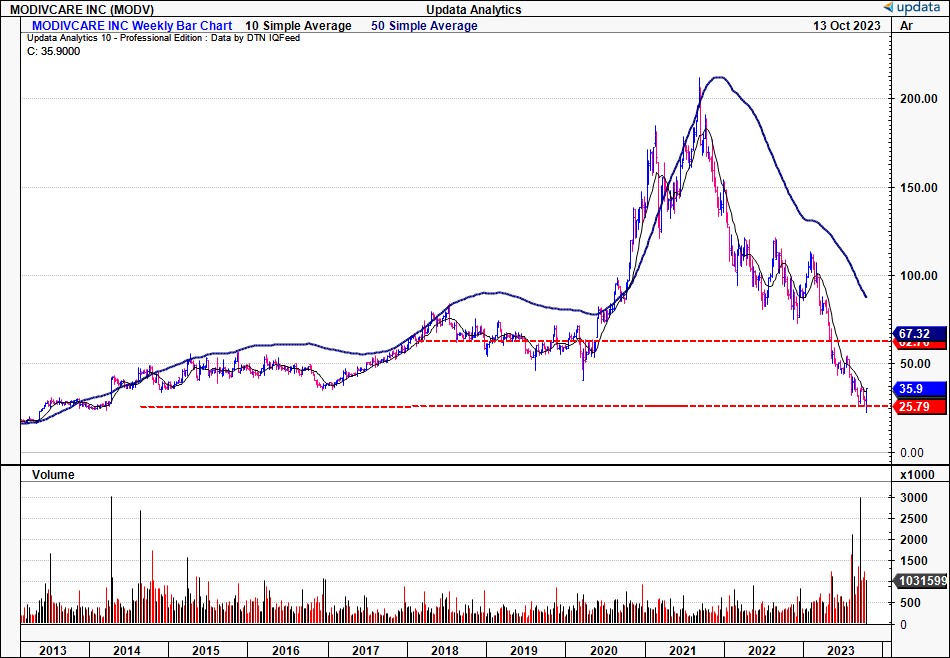
Investors have sold off shares of ModivCare Inc. (MODV) since my July publication , repricing the company ~33% further to the downside. This is in continuation of the 3-year downtrend observed in Figure 1. Moreover, with its near vertical selloff since 2021, it has erased 10 years of equity gains, now trading at its lowest point since mid-2013, as seen in Figure 1a.
Many questions arise for MODV at this point in time. Is it oversold? Is there value at its current prices? Are the market's expectations justified? Why or why not? And so on.
The stock trades at 6.4x forward earnings and 8x forward EBITDA, both respective discounts to sector peers. But compressed multiples alone are no reason to buy a company. Especially given the findings in my last two MODV publications:
- Insufficient returns on new capital deployed into the business,
- Mixed numbers in the company's unit economics,
- Forward estimates revised down (internal estimates),
- Ongoing economic losses on capital required to operate, with growth destructive to shareholder value
In the previous analyses, I have concentrated heavily on scrutinizing MODV's economic characteristics, its ability to compound shareholder value, and its fundamental value drivers. This report will rigorously analyze the market-generated data leading into MODV's upcoming earnings and gauge sentiment + investor positioning. It will incorporate the use of numerous charts to get the point across, with attention to the state of markets and how this relates to MODV.
Net-net, in my opinion, there is insufficient evidence to corroborate a change in rating, therefore I continue to rate MODV a hold.
Figure 1. MODV 3-year price evolution, weekly bars
Figure 1a. MODV-10 years of equity gains erased
Market backdrop
Markets in '23 have become a story of macroeconomics, key policy numbers and geopolitics. The rates/inflation axis continues to drive capital flows, and this is critical to the prospects of MODV. With an EV of $1.65Bn, the company is susceptible to market dynamics, arguably more sensitive than its peers of larger size.
For example, from 2016 until 2023, the equal-weight S&P 500 index tended to show an inverse relationship with US 10yr real yields, as seen below via research from JP Morgan (with the yield inverted it really shows the relationship). In 2023, yields have increased sharply, whereas the equal-weighted index has traded flat for the bulk of the year. In my opinion, the critical insight is that the index has stabilized with the rise in yields, rather than continuing its selloff from 2021-'22.
Figure 2.
Source: JP Morgan Asset Management
Short rates continue to present value on the yield front, but one major risk across '23 was clearly the depth of inversion in the yield curve, measured by the 2/10-year ratio. However, this has been steepening in recent times, with the yield curve "its least inverted in almost 12 months" , as shown by Bloomberg.
Figure 3.
Source: Bloomberg Finance LP
The question is, what does this mean for equities? Positioning in the gross order book is a valuable piece of information in this regard. As shown below, Goldman Sachs' prime book analysis of its own clients shows both short and long exposure decreasing in recent months. Specifically, long exposure to U.S. equities is in the 55th percentile since 2018, and short exposure at the 80th percentile (Figure 4).
If short bias is the prevailing theme, what does this mean for MODV? It certainly means:
(i). Less speculative positioning in the company's equity stock,
(ii). Potential risk-off attitude to more risky assets, of which MODV is included in my opinion.
Figure 4.
Source: Goldman Sachs, Daily Chartbook
Market generated data
- Positioning
Leading into earnings season (and the earnings of any selective name, for that matter) it's always wise to pay exquisite attention to the market-generated data. For MODV, critical insights are gleaned from this analysis.
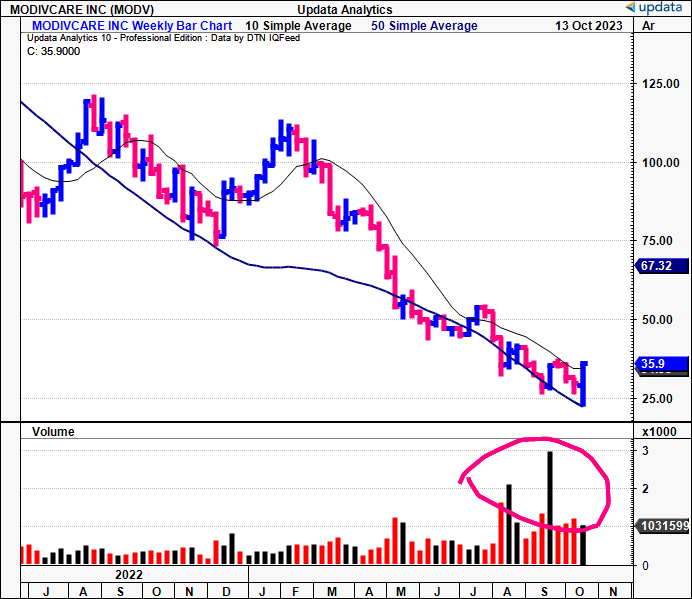
For one, Figure 5 shows two remarkable features:
(1). In the last 2 months, there have been two selective weeks of tremendous buying volume, as shown in the volume bars of the bottom pane. These are well above the 10-week average and total average of 2023.
(2). Despite the heavy volume, this wasn't reflected in the market price. In fact, price action was negligible.
This is interesting. Institutional buyers are typically mandated to buy in allotments, with each transaction capped as a percentage of the daily volume in dollar terms. Could this be evidence of the same?
Or, does it reflect the insider buying from MODV's president, Sampson Heath, back in September? Heath purchased 3,500 shares for ~$121K, according to SEC filings.
Moreover, were these long-term buyers entering the market, or short-term participants trading around value? There was no resulting imbalance in price, on both occasions. But, MODV has closed above the 50DMA for the first time since July.
Figure 5.
Analysis of the last 2 quarters' market profile in MODV's trading reveals unique insights. Critically, the long-term distribution shows the following:
- The bulk of price action has been centred around the $35-$36 region, with the value area actually centred at $36.10.
- This leaves a massive area of low usage from $35 down to $25, creating a potential vacuum whereby the market could look to fill the distribution in this area.
- This cannot be overlooked. Market's move from areas of high usage to low usage, and there is absolute scope for investors to complete the distribution in the $25-$35 region based on what we've seen in terms of MODV's price and volume action these past 2 months.
Figure 5a.
Data: Updata
On the flip side, money flows into MODV's equity stock have been positive for the last 5 weeks to date, as seen below. The last time this happened we did see some recovery in its share price. I would caution, however, these don't appear to be at striking levels, enough to cause a change in relative strength to the equity benchmarks.
Figure 6.
Data: Updata
- Trend action and sentiment
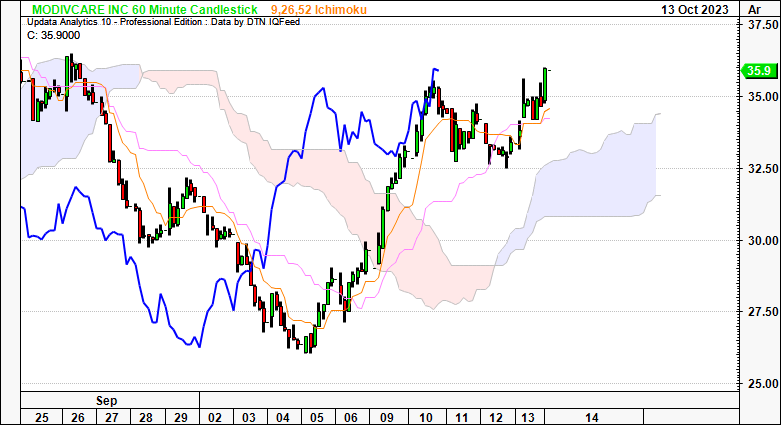
The following series of cloud charts look across hourly, daily, and weekly time frames to provide context on short-term, medium-term and long-term views, respectively.
Critically, the hourly chart crossed the cloud earlier this month, with both price and lagging lines in situ. It looks to the days ahead and corroborates what we've seen in terms of volume buying (discussed earlier). The key factors to consider:
- Does this suggest investors are buying in volume, leading into MODV's Q3 numbers?
- Or, is it a reflection of the insider buying outlined earlier?
- Is something else not known or factored in here?
Either way, this shorter-term activity is remarkable and should be considered, given that MODV's earnings are set for next month. I am watching this very closely to see the price action in the coming days + weeks.
Figure 7. Hourly chart
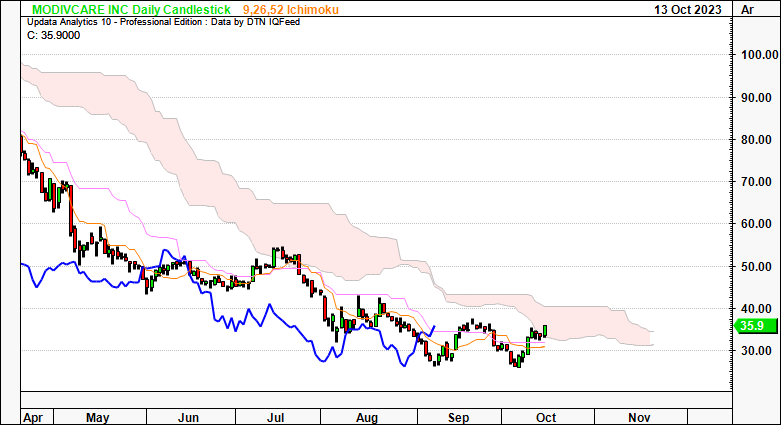
Meanwhile, the daily and weekly charts aren't as constructive. These look to the coming weeks and months, respectively. On the daily chart, price and lagging lines remain beneath the cloud, with the former testing the cloud base these past 5 days. Note this happened back in July as well, but was short-lived, and the move had no support via the lagging line. By the looks of it, a break above $40 by November/December is needed to reverse to bullish, but this isn't supported via the market profile.
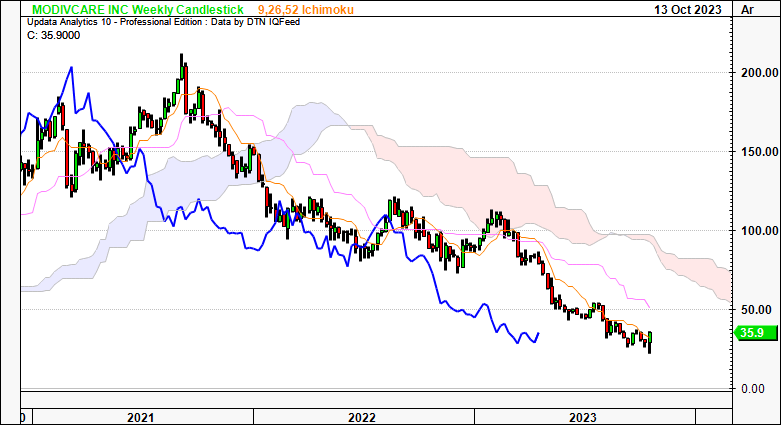
Furthermore, the long-term trend remains bearish, as seen in Figure 9. Both price and lagging lines are gapping from the cloud and there's no closure of this with the recent price action. You're looking at a break closer to $68-$80 by January-March next year to suggest the long-term trend is bullish. This is a gargantuan effort, one I'm not that confident in at this stage.
Figure 8. Daily chart
Figure 9. Weekly chart
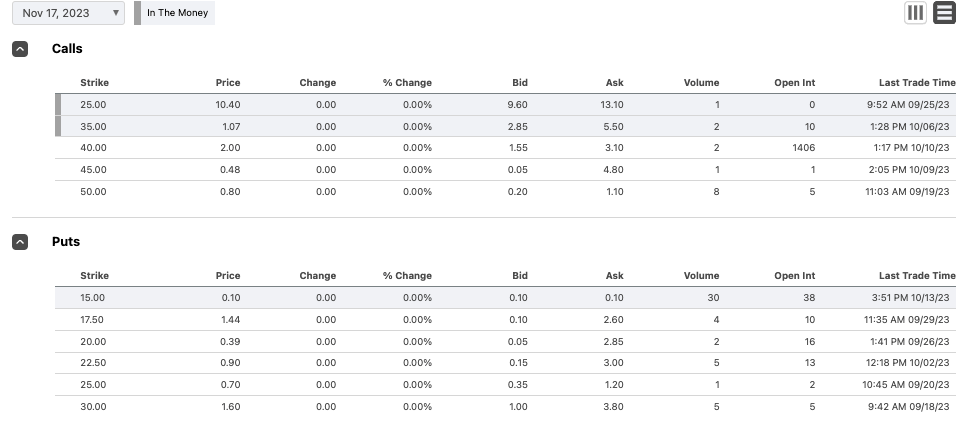
Finally, the breadth of positioning, as indicated by options-generated data is noteworthy. Investors are buying November ITM calls at the $40 strike level with strong demand, but showing little interest in strikes beneath this point on the chain. This cannot be ignored, as there is likely a decent sum of capital at risk in these contracts.
On the puts side, demand is focal around a strike depth of $15-$22.50 in a more balanced distribution. In either case, this is money at risk and suggests investors are split in their positioning on the company heading into its numbers. To me, this supports a neutral view.
Figure 10. MODV November dated contracts, ITM calls + puts
Valuation and conclusion
The stock sells at 6.4x forward earnings as mentioned. At the current market value of $35.90, this suggests investors are eyeing ~$5.60/share in FY'23 earnings.
Why the low multiples? Is this relative value on offer, or are we best served allocating capital to more selective opportunities? A few lines from MODV's last earnings call stood out to me at the time, and I think it's relevant to the discussion here:
Management said it "increased revenue guidance was primarily due to higher NEMT utilization and transportation costs driving more revenue from our shared risk contracts" , but at the same time, "lowered [its] adjusted EBITDA guidance due to the higher NEMT utilization ".
Interesting that what drove sales also lowered profitability. That's not the type of economics I'd be interested in buying, nor advocating others to do so.
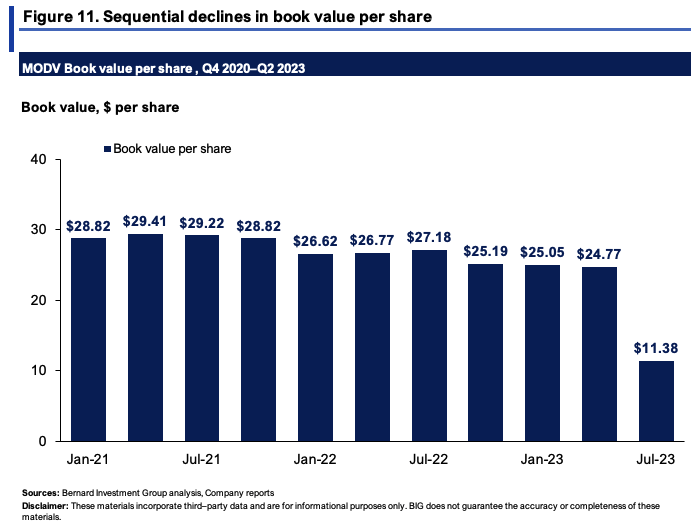
Then there's the fact MODV's book value has decreased from $411mm in 2020 to $161mm last period, to just $11.38 per share. Typically I wouldn't use book value/share as a major talking point in valuation.
But, as an investor, if:
- The value of your equity is declining,
- Profitability and returns of the business are also declining (impacting the returns on your equity),
Then the bedrock of buying the business in the first place is statistically flawed. In that vein, it of my opinion that 6.4x earnings is an appropriate value for MODV at this point in time.
In short, there is an interesting debate for MODV at this point in time. As it relates to MODV being investment grade:
- The company's economic characteristics are softening and unsupportive for the fundamentally sound investor.
- But, there has been some remarkable market activity of late, with heavy buying in 2 particular weeks, alongside short-term trends rallying.
- Options data is equally as mixed, creating further uncertainty on price visibility downstream.
The key point is that there is uncertainty in the debate. Preferably, I'd advocate for predictable cash flows, strong economics, and robust market data to back this up. Not saying MODV can't catch a bid, but it doesn't align with my own investment tenets. In that vein, I continue to rate MODV a hold.
For further details see:
ModivCare: Notable Buying Trends In Recent Weeks, Uncertainties Remain