SPGI - Morningstar: Already Struggling But Still Too Expensive
2023-07-10 22:44:34 ET
Summary
- Morningstar reported mediocre quarterly results and has already been struggling for some quarters with constantly declining margins.
- While license-based revenue is still increasing, transaction-based revenue fell off a cliff and these trends might continue in the coming quarters.
- But long-term, Morningstar should be able to continue growing with a high pace.
- I still see downside risk for Morningstar and the stock is still not a good investment in my opinion.
Morningstar, Inc. ( MORN ) is one of the major financial service companies and while it is always standing in the shadows of its peers like S&P Global Inc. ( SPGI ) or Moody’s Corporation ( MCO ), it is one of the major credit-rating agencies. At the end of September 2022, I published my last article about Morningstar and I still rated the stock as a “Hold” and explained in my conclusion:
When using a discounted cash flow calculation, Morningstar might seem almost fairly valued right now. But the stock is still trading for 40 times free cash flow and 50 times earnings. This is certainly not cheap and might indicate that the assumptions we used in the intrinsic value calculation might be too optimistic. For the long term, Morningstar has a solid, subscription-based business model which should generate stable (or increasing) cash flows – but for the next few years, the looming recession and bear market will most likely have a negative effect on the business. Morningstar stock declining further seems like a possible scenario.
Since the article was published, the stock declined further from $212 at the time of publication to about $194 at the time of writing. Compared to its previous all-time high, the stock is trading about 44% lower (and has lost already 50% of its previous value in the meantime).
And when looking at the company’s main competitors – which are not only including the other credit-rating agencies but also companies like FactSet Research Systems Inc. ( FDS ) or MSCI, Inc. ( MSCI ) – we see that Morningstar clearly underperformed. While the underperformance of a stock is not great news for investors, it might also indicate that we are looking at a potential future investment and that the stock is cheap compared to its peers. And in the following article we will try to answer the question if Morningstar is a good investment now.
Quarterly Results
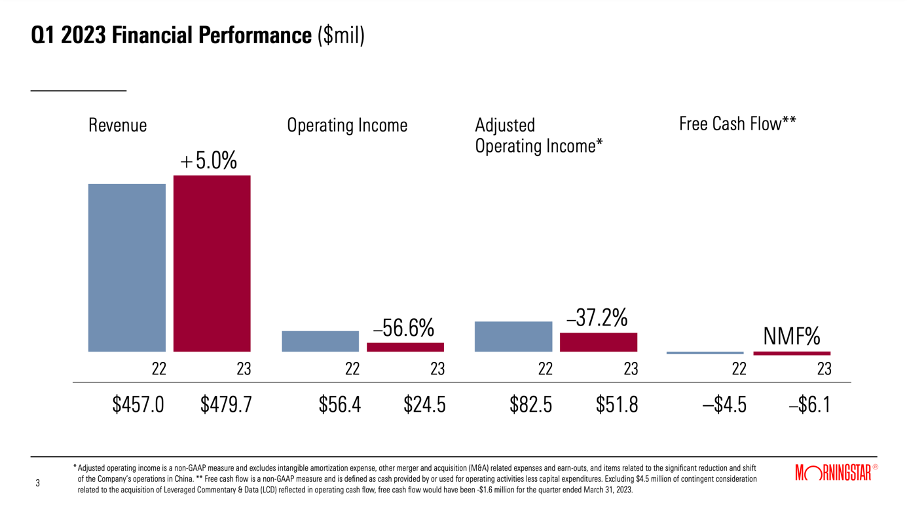
We start by looking at the results for the first quarter of fiscal 2023. Morningstar still increased its revenue year-over-year from $457.0 million in Q1/22 to $479.7 million in Q1/23 – resulting in 5.0% growth. But while the top line still increased, operating income declined steeply from $56.4 million in the same quarter last year to $24.5 million this quarter – reflecting a decline of 56.6% year-over-year. The main reason were the increasing “costs of revenue” as well as the higher expenses for sales and marketing. And not only operating income declined – instead of a diluted net income per share of $1.06 in Q1/22, the company had to report a diluted loss per share of $0.18 this quarter. Free cash flow was once again negative - $6.1 million this quarter compared to a negative free cash flow of $4.5 million in the same quarter last year.
Morningstar Q1/23 Presentation
Morningstar is Struggling
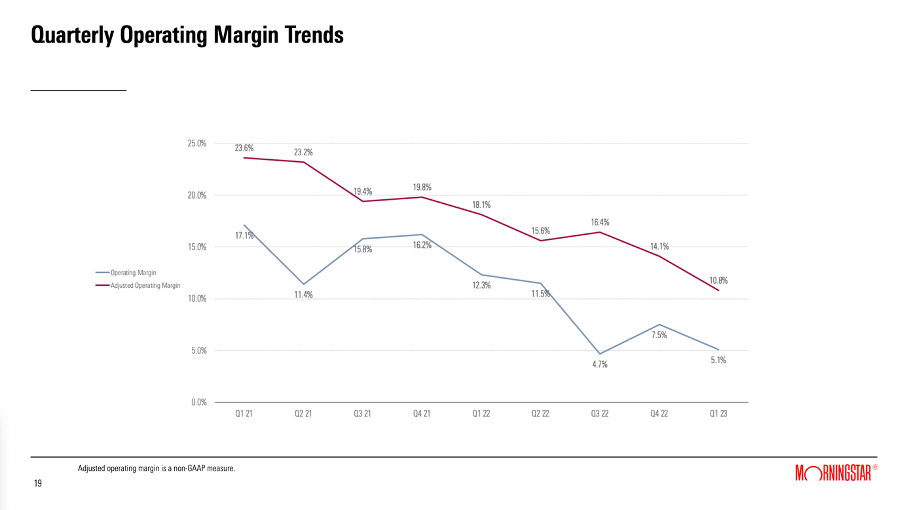
And Morningstar is continuing to struggle and had not only to report declining numbers in the first quarter of fiscal 2023. Results were already far from perfect in the last few quarters as we are seeing constantly lower margins. Operating margin is declining over time and especially gross margin is constantly lower from quarter to quarter. And this is certainly not a good sign as a constantly declining gross margin is indicating missing pricing power of a company and indicating that a business has no economic moat.
Morningstar Q1/23 Presentation
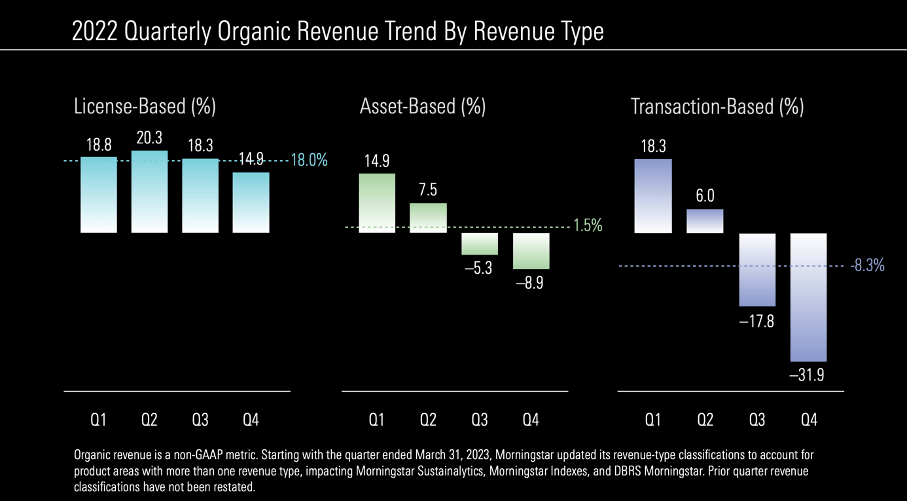
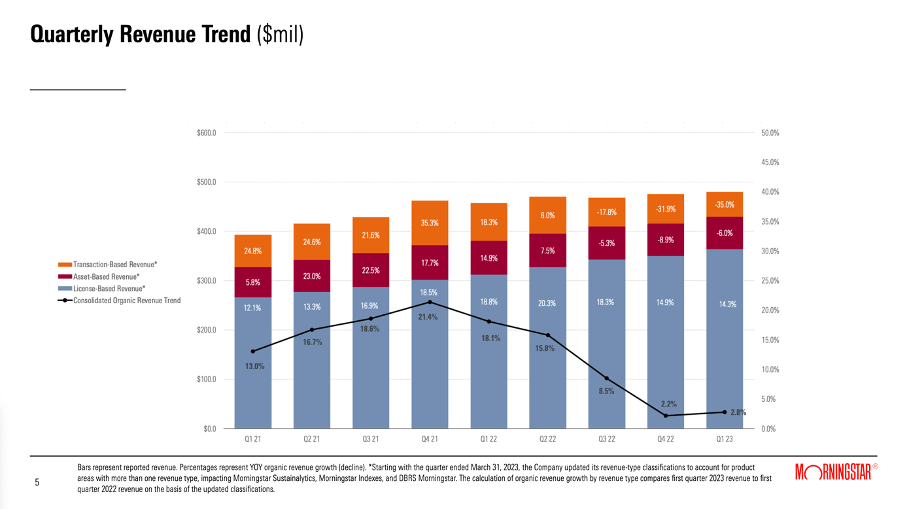
When looking at the results in more detail, we can see some revenue trends that have already been existing for several quarters. While license-based revenue had to report lower growth rates in the last few quarters, it is still reporting double digit growth. The other two revenue types – asset-based revenue as well as transaction-based revenue – already had to report declining revenue year-over-year in Q3/22 and Q4/22.
Morningstar 2023 Shareholder Meeting Presentation
And in the first quarter of fiscal 2023, the picture is similar. License-based revenue, which is responsible for the biggest part of revenue, could report 16.7% year-over-year growth (organic growth was 14.3%) and increased to $364 million. Asset-based revenue declined 4.7% year-over-year to $65.3 million and transaction-based revenue declined 34.2% YoY to $50.4 million.
Morningstar 2023 Shareholder Meeting Presentation
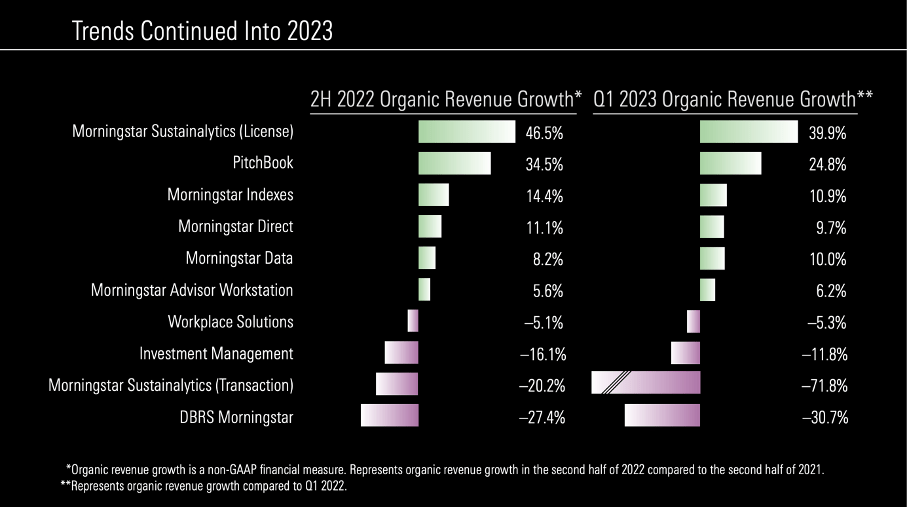
When looking at the different products and services, we see especially DBRS Morningstar declining. In Q1/23 revenue declined 32.4% (and 30.7% on an organic basis). Morningstar is citing weak credit issuance activity which is the result of high volatility in the credit markets and a higher level of macroeconomic uncertainty.
And just to provide some context, Moody’s Corporation also saw its revenue for the MIS segment (Moody’s Investor Services, which is offering the ratings) declining – from $827 million to $733 million. In case of S&P Global , revenue from ratings declined from $868 million in Q1/22 to $824 million in Q1/23. But this is not such a steep decline as Morningstar had to report and the company clearly underperformed its two major peers – at least for the ratings revenue and these are transaction-based revenues that declined the most.
Asset-based revenues (including Investment Management and Workplace Solutions) also had to report a decline, but not such a steep decline as licensed-based revenue. For Investment Management, reported assets under management were flat year-over-year and revenue declined 3.9% (11.8% on an organic basis).
While these two were declining, licensed-based revenues were increasing – this is especially including Pitchbook and Morningstar Sustainability with high growth rates, but it is also including Morningstar Data and Morningstar Direct, which could also report growth. In my first article about Morningstar , I described the switching costs that arise for licensed-based revenue products:
These switching costs mostly stem from steep learning costs, which most companies and clients are trying to avoid. After a company or investor has learned to use PitchBook or Morningstar Direct and employees or investors have gained knowledge and experience in working with these platforms, they don’t switch. And often, it takes a lot of time to understand the functionality of a platform. And especially smaller companies don’t have the time and financial resource to double a recently made investment by switching to a competitor. Additionally, the provided data might also be embedded in other applications or software the company uses, and this embeddedness is creating high switching cost, as it would take a lot of time to “fix” this. So, even if another company comes along with a slightly better or cheaper product, many customers won’t switch, as the process of switching costs a lot more than the company would save by switching.
Morningstar Q1/23 Presentation
In my opinion, these trends will continue. In the last few months, the stock market performed quite well, and this might have increased asset under management again, but over the next one or two years I am expecting further declining stock prices, and this will lead to people pulling assets and therefore to asset-based revenue remaining under pressure. And with the economy potentially heading for a recession I also assume that company will continue to issue less debt decreasing the demand for ratings and therefore transaction-based revenue might also decline further.
Licensed-based revenue is the most stable and can still report growth. This is also not surprising as we are often dealing with subscription-based revenue models here and we have a certain “stickiness” and rather high switching costs leading to stable revenue for Morningstar.
Long-term Growth
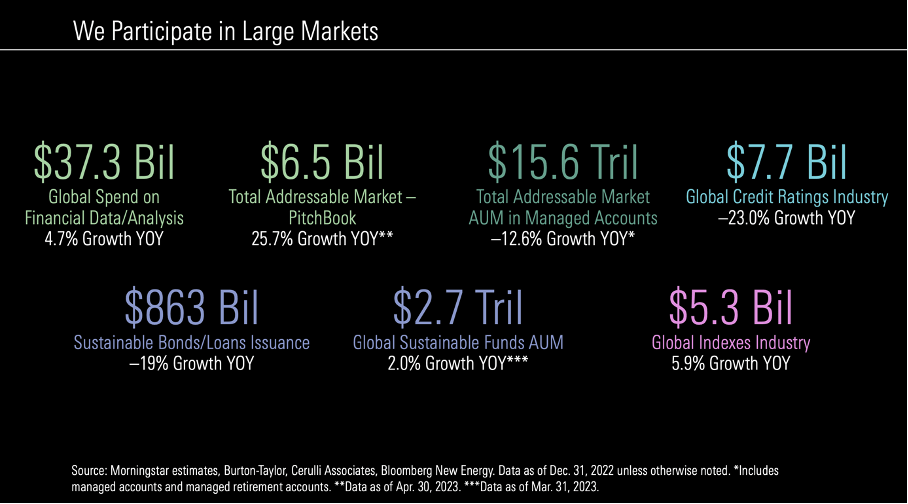
And while I am expecting difficulties for Morningstar in the coming quarters (and maybe even next few years), I would remain optimistic over the long run. As management pointed out again during the 2023 Annual Shareholder Meeting , the total addressable market is gigantic, and Morningstar is operating in many different markets that offer growth potential.
Morningstar 2023 Shareholder Meeting Presentation
And although the wide economic moat – especially the switching costs – lead to some stability and consistency, Morningstar is a rather cyclical business, and the performance is somehow linked to the performance of the overall stock market. I have already written in previous articles that I expect rather low growth rates in the years following a potential recession and bear market and it might take some time before Morningstar can report similar high growth rates as in the last few years again (but these growth rates are possible – at least in theory).
Morningstar 2023 Shareholder Meeting Presentation
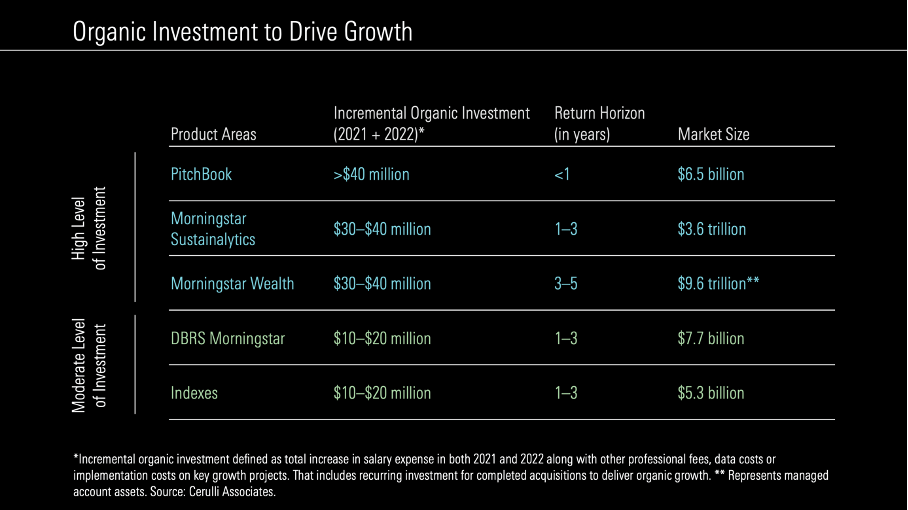
And Morningstar is investing constantly to drive organic growth in the years to come. Especially Pitchbook, Morningstar Sustainalytics, Morningstar Wealth, DBRS Morningstar or the Indexes are those with the highest growth potential and a huge market size.
Intrinsic Value Calculation
The question remaining at this point is if Morningstar is already fairly valued. Can we buy the stock already and is Morningstar already a good investment at current prices? To answer this question, we can once again compare Morningstar to its competitors and a good starting point might be the simple valuation metrics as these metrics make it rather easy to compare different stocks.
We might start by looking at the price-earnings ratio. However, Morningstar is trading for almost 500 times earnings – not because the stock is so extremely overvalued but due to steeply declining earnings per share. And with a P/E ratio of 500, Morningstar seems more expensive than almost every other peer. Instead of using the P/E ratio, we can use the price-free-cash-flow ratio (which is the much better metric anyway).
When looking again at the five companies from above – Morningstar is not only the stock that performed worst but also seems to be the most expensive stock. While S&P Global as well as Moody’s are trading for a similar P/FCF ratio, MSCI and especially FactSet seem to be much cheaper. But we also must point out that Morningstar, S&P Global as well as Moody’s Corporation already saw its free cash flow declining while MSCI and FactSet are reporting record free cash flows (leading to a lower P/FCF ratio).
It seems like Morningstar is not really cheap at this point, but in the end, we should calculate an intrinsic value by using a discount cash flow analysis. As basis for our calculation, we take 42.8 million outstanding shares and take once again a discount rate of 10% (as always). Now let’s calculate with rather cautious assumptions and assume a free cash flow of only $166 million for 2023 and 2024. Then we assume it will take until 2026 before Morningstar can reach its pre-crisis free cash flow again. In the following years, we assume 6% growth till perpetuity. This is resulting in an intrinsic value of $164.72 for Morningstar. Of course, we can also make more optimistic assumptions, but at this point I would be rather cautious as the bull market of the last few years might be an exception and a performance, we most likely won’t see again in the foreseeable future (maybe we are talking about decades – but that is only speculation).
Conclusion
In my last article, I identified several support levels – a first strong support level is between $150 and $165, and second support level would be between $85 and $100. And while I don’t know if the stock will drop steep enough to reach the second support level, I see further downside risk for Morningstar in the short term. Overall, I would remain “Neutral” about Morningstar as the stock is not a “Buy” for me. The stock is still trading for rather high valuation multiples, and I see declining fundamentals in the next few quarters and as a result also a declining stock price.
For further details see:
Morningstar: Already Struggling But Still Too Expensive