WBA - My Best Dividend Aristocrats For March 2023
Summary
- NOBL started the year off with a gain of 3.23% in January; it is thus far not faring as well in February, but the ETF is still positive year-to-date.
- I present 3 strategies that can theoretically beat the dividend aristocrat index in the long term.
- After nearly 19 months, all 3 buy-and-hold portfolios continue to generate alpha over NOBL and SPY.
2023 Review
The ProShares S&P 500 Dividend Aristocrats ETF (NOBL) returned 3.23% in January and started the new year on a positive note. After posting its worst annual return in 2022 I look forward to a more optimistic 2023. The new year did start out better, however much of the gains we saw in January have been given up in February. Through February 24th the ETF is down 2.25%, leaving it with a very modest 0.91% gain year-to-date.
V.F. Corporation (VFC) announced a dividend cut earlier this year and is scheduled to be kicked off the dividend aristocrat list at its next rebalancing in 2024. To maintain aristocrat status a company must maintain a consecutive 25 year dividend growth streak measured by comparing annual dividend payouts. Therefore if VF Corporation were to raise its dividend payouts during the latter part of 2023 and payout a larger dividend this year than in the prior year it could retain its status. The likelihood of this happening is not great, especially given that the dividend rate was cut by more than 40%.
The company will remain as a holding in my buy-and-hold portfolios even if it is ultimately removed from the dividend aristocrat list. One portfolio also has a position in Leggett & Platt (LEG) that is no longer an aristocrat. And all three portfolios have a position in AT&T ( T ) that has also lost its aristocrat status.
Not all of the dividend aristocrats contributed equally to NOBL's bright start in 2023; 28 dividend aristocrats beat NOBL during the month, and only 43 posted positive total returns. These aristocrats are outpacing NOBL after January:
- Albemarle ( ALB ) +29.78%
- Nucor ( NUE ) +28.23%
- Pentair ( PNR ) +23.69%
- Stanley Black & Decker ( SWK ) +18.89%
- A.O. Smith ( AOS ) +18.87%
- Franklin Resources ( BEN ) +18.27%
- Target ( TGT ) +15.50%
- Dover Corp. ( DOV ) +12.13%
- VF Corporation ( VFC ) +12.06%
- S&P Global ( SPGI ) +11.94%
- Cincinnati Financial ( CINF ) +10.51%
- Federal Realty Trust ( FRT ) +10.38%
- C.H. Robinson ( CHRW ) +9.40%
- Medtronic ( MDT ) +7.68%
- Realty Income ( O ) +7.33%
- Illinois Tool Works ( ITW ) +7.14%
- T. Rowe Price ( TROW ) +6.79%
- Essex Property Trust ( ESS ) +6.68%
- Ecolab ( ECL ) +6.37%
- Grainger ( GWW ) +5.97%
- Caterpillar ( CAT ) +5.83%
- Exxon Mobil ( XOM ) +5.18%
- Lowe's ( LOW ) +5.05%
- Atmos Energy ( ATO ) +4.88%
- Air Products and Chemicals ( APD ) +3.97%
- Clorox ( CLX ) +3.97%
- PPG Industries ( PPG ) +3.66%
The S&P 500, as measured by SPY , returned 6.29% in January but is down 2.48% through February 24th. NOBL beat SPY in 2022 with a loss of 6.5% compared to a loss of 21.65%. SPY started 2023 on stronger footing beating NOBL by 3.06% in January, it has given up some of this lead in February as the lead has shrunk to 2.74% as of February 24th. The dividend aristocrat ETF's 13 month winning streak over SPY came to a sharp end as the new year kicked off. The dividend aristocrats are not known to consistently beat the S&P 500 index, in fact, the dividend aristocrat index underperformed the S&P 500 index for 6 out of the last 8 full calendar years.
However, if you look further back in history, the dividend aristocrat index is outperforming the S&P 500 index by about 2.18% per year between 1990 and 2022. A significant portion of this long-term outperformance is attributable to the dot com bubble and the financial crisis as well as the immediate years following each market crash. This pattern was broken with the 2020 market crash, perhaps the much shorter duration of the crash and recovery are the reason. The dot com bubble and the financial crisis both extended for multiple years while the 2020 market crash was fully recovered in a matter of months. 2022 also proved to be a strong year for the aristocrats as they earned 15.15% of alpha on the S&P, making up for 3 years of underperformance.
Even though the dividend aristocrats have trailed the S&P for the better part of the last 8 years, long-term investors can rest assured that based on history, over a much longer time period, the dividend aristocrats can hold their own. There are currently 67 companies in the dividend aristocrat index but strong historical returns for the index can be attributed to only a handful of them. As an investor, I am always curious how to identify these drivers of outperformance.
I want to present 3 strategies that theoretically could identify winning aristocrats and lead to better performance than the dividend aristocrat index. These strategies work best with a buy and hold long-term investing approach as will be evidenced by the results. They are based on quantitative models that do not consider qualitative data, therefore it is prudent that further due diligence is performed on all chosen stocks.
The Most Undervalued Strategy
Strategy number 1 is a focus on valuation and more specifically it targets the potentially most undervalued dividend aristocrats. In theory, this is a long-term strategy since it may take some time to fully see the reward of leveraging a valuation approach. My preferred method for valuation is dividend yield theory, mainly for its simplicity. Unlike other valuation methods, dividend yield theory does not require making assumptions aside from assuming that a given stock will revert back to its long-term trailing dividend yield.
This valuation technique works best for mature businesses with long histories of dividend growth, making the dividend aristocrats an ideal pool of companies to value using this technique.
Selecting the 10 most undervalued dividend aristocrats each month and adopting a buy and hold investing approach can lead to long-term outperformance when/if the targeted stocks return to fair valuation. It may take a few months or even years to see if this strategy actually pays off. I predict that it will underperform NOBL for the first few months while we wait for bargain stocks to return to fair value.
| Month |
| Most Undervalued |
| NOBL |
| SPY |
| Aug 21 |
| 0.49% |
| 1.87% |
| 2.98% |
| Sep 21 |
| -2.99% |
| -5.69% |
| -4.66% |
| Oct 21 |
| 3.63% |
| 5.95% |
| 7.02% |
| Nov 21 |
| -2.19% |
| -1.76% |
| -0.80% |
| Dec 21 |
| 10.37% |
| 6.54% |
| 4.63% |
| Jan 22 |
| 1.04% |
| -4.08% |
| -5.27% |
| Feb 22 |
| -1.94% |
| -2.59% |
| -2.95% |
| Mar 22 |
| 3.40% |
| 3.86% |
| 3.76% |
| Apr 22 |
| -2.14% |
| -3.42% |
| -8.78% |
| May 22 |
| 3.11% |
| 0.31% |
| 0.23% |
| Jun 22 |
| -7.30% |
| -6.73% |
| -8.25% |
| Jul 22 |
| 5.00% |
| 6.56% |
| 4.55% |
| Aug 22 |
| -3.25% |
| -2.78% |
| -4.08% |
| Sep 22 |
| -11.39% |
| -9.15% |
| -9.24% |
| Oct 22 |
| 10.07% |
| 10.31% |
| 8.13% |
| Nov 22 |
| 6.99% |
| 7.12% |
| 5.56% |
| Dec 22 |
| -5.41% |
| -4.12% |
| -5.76% |
| Jan 23 |
| 4.83% |
| 3.23% |
| 6.29% |
| Feb 23 |
| -3.48% |
| -2.25% |
| -2.48% |
| 2021 Partial |
| 9.05% |
| 6.54% |
| 9.06% |
| 2022 |
| -3.91% |
| -6.50% |
| -21.65% |
| 2023 |
| 1.19% |
| 0.91% |
| 3.65% |
| TOTAL |
| 6.02% |
| 0.52% |
| -11.44% |
| Alpha over NOBL |
| 5.50% |
| Alpha over SPY |
| 17.46% |
The table above shows the monthly and annual returns for the buy-and-hold portfolio of the most undervalued strategy.
The portfolio beat NOBL in January, picking up 1.6% of alpha, it did however trail SPY by 1.46%. February is thus far not looking as good, through the 24th the portfolio is down 3.48% compared to a loss of 2.25% for NOBL and a loss of 2.48% for SPY. Year-to-date the portfolio maintains its lead over NOBL but falls further behind SPY. Since inception this portfolio has generated 5.50% of alpha over NOBL and 17.46% of alpha over SPY.
The largest contributor to the underperformance in February is the large exposure to VFC that, following its recent dividend cut announcement, has plunged more than 20% month-to-date.
The portfolio consists of 34 unique present and former dividend aristocrats. I track this portfolio by investing $1,000 each month equally split among the 10 chosen aristocrats for that month. The positions are never trimmed or sold and all dividends are reinvested back into the issuing stock. Here are all of the positions, the current market value, capital invested, total return and allocation as of February 24th.
| TICKER |
| MARKET VALUE |
| CAPITAL INVESTED |
| TOTAL RETURN |
| CURRENT ALLOCATION |
| ABBV |
| 150.31 |
| 100 |
| 50.31% |
| 0.78% |
| AFL |
| 362.25 |
| 300 |
| 20.75% |
| 1.89% |
| AMCR |
| 299.60 |
| 300 |
| -0.13% |
| 1.56% |
| AOS |
| 223.38 |
| 200 |
| 11.69% |
| 1.17% |
| APD |
| 116.32 |
| 100 |
| 16.32% |
| 0.61% |
| ATO |
| 968.40 |
| 800 |
| 21.05% |
| 5.05% |
| BDX |
| 104.62 |
| 100 |
| 4.62% |
| 0.55% |
| BEN |
| 906.65 |
| 800 |
| 13.33% |
| 4.73% |
| CAH |
| 654.90 |
| 400 |
| 63.72% |
| 3.42% |
| CLX |
| 1,543.70 |
| 1500 |
| 2.91% |
| 8.05% |
| CVX |
| 513.23 |
| 300 |
| 71.08% |
| 2.68% |
| ECL |
| 1,201.41 |
| 1200 |
| 0.12% |
| 6.27% |
| ED |
| 515.09 |
| 400 |
| 28.77% |
| 2.69% |
| ESS |
| 314.98 |
| 300 |
| 4.99% |
| 1.64% |
| GD |
| 243.38 |
| 200 |
| 21.69% |
| 1.27% |
| HRL |
| 734.61 |
| 700 |
| 4.94% |
| 3.83% |
| IBM |
| 227.67 |
| 200 |
| 13.84% |
| 1.19% |
| KMB |
| 105.24 |
| 100 |
| 5.24% |
| 0.55% |
| LEG |
| 87.67 |
| 100 |
| -12.33% |
| 0.46% |
| LOW |
| 741.66 |
| 700 |
| 5.95% |
| 3.87% |
| MDT |
| 1,045.83 |
| 1100 |
| -4.92% |
| 5.46% |
| MKC |
| 291.11 |
| 300 |
| -2.96% |
| 1.52% |
| MMM |
| 1,137.20 |
| 1400 |
| -18.77% |
| 5.93% |
| PNR |
| 123.80 |
| 100 |
| 23.80% |
| 0.65% |
| PPG |
| 203.31 |
| 200 |
| 1.66% |
| 1.06% |
| ROP |
| 97.77 |
| 100 |
| -2.23% |
| 0.51% |
| SHW |
| 300.17 |
| 300 |
| 0.06% |
| 1.57% |
| SWK |
| 1,011.80 |
| 1100 |
| -8.02% |
| 5.28% |
| T |
| 766.04 |
| 700 |
| 9.43% |
| 4.00% |
| TGT |
| 325.16 |
| 300 |
| 8.39% |
| 1.70% |
| TROW |
| 1,027.05 |
| 1100 |
| -6.63% |
| 5.36% |
| VFC |
| 915.47 |
| 1600 |
| -42.78% |
| 4.78% |
| WBA |
| 1,486.43 |
| 1700 |
| -12.56% |
| 7.76% |
| XOM |
| 419.90 |
| 200 |
| 109.95% |
| 2.19% |
Here are the 10 most undervalued dividend aristocrats chosen for the month of March 2023. The table below shows potential undervaluation (column Valuation) for each of the 10 chosen aristocrats. The data is from February 24th so the current dividend yield may differ slightly from the stated yield.
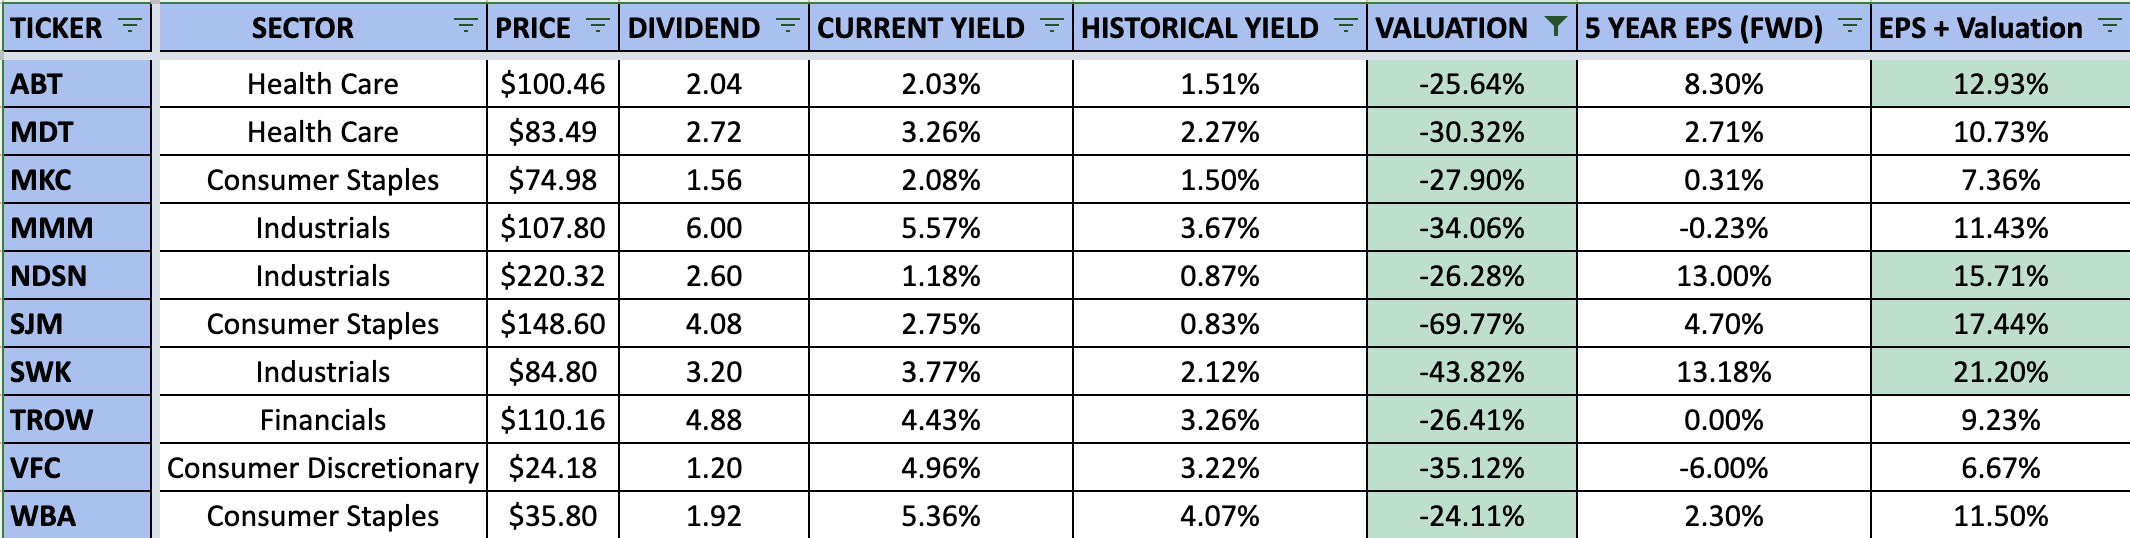
The Fastest Expected Growth Strategy
Strategy number 2 is a focus on dividend aristocrats that are expected to grow the fastest in the near future. Historically, there has been a correlation between earnings per share growth and share price appreciation. Companies that have grown their earnings faster have also seen higher total returns. One way to gauge how fast earnings for a company will grow is to leverage analyst forecasts. For this strategy, I decided to use a discounted five-year EPS growth forecast combined with a return to fair valuation and the dividend yield to identify the 10 best aristocrats poised for the best total return in the future.
| Month |
| Fastest Growth |
| NOBL |
| SPY |
| Aug 21 |
| 5.12% |
| 1.87% |
| 2.98% |
| Sep 21 |
| -4.42% |
| -5.69% |
| -4.66% |
| Oct 21 |
| 5.92% |
| 5.95% |
| 7.02% |
| Nov 21 |
| -2.06% |
| -1.76% |
| -0.80% |
| Dec 21 |
| 7.09% |
| 6.54% |
| 4.63% |
| Jan 22 |
| -4.42% |
| -4.08% |
| -5.27% |
| Feb 22 |
| -0.10% |
| -2.59% |
| -2.95% |
| Mar 22 |
| 3.71% |
| 3.86% |
| 3.76% |
| Apr 22 |
| -2.19% |
| -3.42% |
| -8.78% |
| May 22 |
| 0.12% |
| 0.31% |
| 0.23% |
| Jun 22 |
| -8.94% |
| -6.73% |
| -8.25% |
| Jul 22 |
| 6.09% |
| 6.56% |
| 4.55% |
| Aug 22 |
| -2.69% |
| -2.78% |
| -4.08% |
| Sep 22 |
| -11.37% |
| -9.15% |
| -9.24% |
| Oct 22 |
| 13.68% |
| 10.31% |
| 8.13% |
| Nov 22 |
| 6.14% |
| 7.12% |
| 5.56% |
| Dec 22 |
| -7.53% |
| -4.12% |
| -5.76% |
| Jan 23 |
| 9.41% |
| 3.23% |
| 6.29% |
| Feb 23 |
| -3.92% |
| -2.25% |
| -2.48% |
| 2021 Partial |
| 11.62% |
| 6.54% |
| 9.06% |
| 2022 |
| -9.86% |
| -6.50% |
| -21.65% |
| 2023 |
| 5.12% |
| 0.91% |
| 3.65% |
| TOTAL |
| 5.77% |
| 0.52% |
| -11.44% |
| Alpha over NOBL |
| 5.25% |
| Alpha over SPY |
| 17.20% |
The table above shows the monthly and annual returns for the buy-and-hold portfolio of the fastest expected growth strategy.
The portfolio got off to an excellent start in 2023 picking up a gain of 9.41% in January, far outpacing NOBL +3.23% and SPY +6.29%. Similar to the most undervalued portfolio February is not looking so great, through the 24th the portfolio is down 3.92%. However, given the above average return in January the portfolio maintains a comfortable lead over NOBL and SPY year-to-date. Since inception, this portfolio has generated 5.25% of alpha over NOBL and 17.20% of alpha over SPY.
The portfolio consists of 30 unique present and former dividend aristocrats. I track this portfolio by investing $1,000 each month equally split amongst the 10 chosen aristocrats for that month. The positions are never trimmed or sold and all dividends are reinvested back into the issuing stock. People's United (PBCT) was removed from the portfolio in April, as the company was acquired by M&T Bank ( MTB ); the value of the position was reinvested equally amongst the 10 chosen aristocrats for April. Here are all of the positions, the current market value, capital invested, total return and allocation as of February 24th.
| TICKER |
| MARKET VALUE |
| CAPITAL INVESTED |
| TOTAL RETURN |
| CURRENT ALLOCATION |
| ADP |
| 98.13 |
| 100 |
| -1.87% |
| 0.51% |
| ALB |
| 1,143.19 |
| 1100 |
| 3.93% |
| 5.93% |
| APD |
| 114.58 |
| 100 |
| 14.58% |
| 0.59% |
| CAT |
| 1,335.14 |
| 1100 |
| 21.38% |
| 6.92% |
| CB |
| 1,153.40 |
| 1000 |
| 15.34% |
| 5.98% |
| CINF |
| 126.96 |
| 100 |
| 26.96% |
| 0.66% |
| CLX |
| 427.97 |
| 400 |
| 6.99% |
| 2.22% |
| CVX |
| 100.82 |
| 100 |
| 0.82% |
| 0.52% |
| ECL |
| 623.40 |
| 700 |
| -10.94% |
| 3.23% |
| ESS |
| 314.98 |
| 300 |
| 4.99% |
| 1.63% |
| GWW |
| 478.29 |
| 400 |
| 19.57% |
| 2.48% |
| IBM |
| 1,088.57 |
| 1000 |
| 8.86% |
| 5.65% |
| ITW |
| 221.33 |
| 200 |
| 10.67% |
| 1.15% |
| LIN |
| 324.22 |
| 300 |
| 8.07% |
| 1.68% |
| LOW |
| 701.29 |
| 700 |
| 0.18% |
| 3.64% |
| MCD |
| 764.08 |
| 700 |
| 9.15% |
| 3.96% |
| MDT |
| 566.93 |
| 600 |
| -5.51% |
| 2.94% |
| MMM |
| 245.77 |
| 300 |
| -18.08% |
| 1.27% |
| NUE |
| 2,381.42 |
| 1700 |
| 40.08% |
| 12.35% |
| O |
| 408.00 |
| 400 |
| 2.00% |
| 2.12% |
| PPG |
| 615.22 |
| 600 |
| 2.54% |
| 3.19% |
| PBCT |
| 200 |
| -100.00% |
| 0.00% |
| SHW |
| 95.49 |
| 100 |
| -4.51% |
| 0.50% |
| SWK |
| 893.95 |
| 1000 |
| -10.60% |
| 4.64% |
| SYY |
| 1,863.75 |
| 1900 |
| -1.91% |
| 9.67% |
| T |
| 107.62 |
| 100 |
| 7.62% |
| 0.56% |
| TGT |
| 543.31 |
| 500 |
| 8.66% |
| 2.82% |
| TROW |
| 745.70 |
| 800 |
| -6.79% |
| 3.87% |
| VFC |
| 1,039.05 |
| 1900 |
| -45.31% |
| 5.39% |
| WST |
| 642.77 |
| 500 |
| 28.55% |
| 3.33% |
| XOM |
| 116.27 |
| 100 |
| 16.27% |
| 0.60% |
Here are the 10 dividend aristocrats poised for the best total return right now. The table below shows the expected growth rate (column EPS + Valuation) for each of the 10 chosen aristocrats. The data is from February 24th so the current dividend yield may differ slightly from the stated yield.
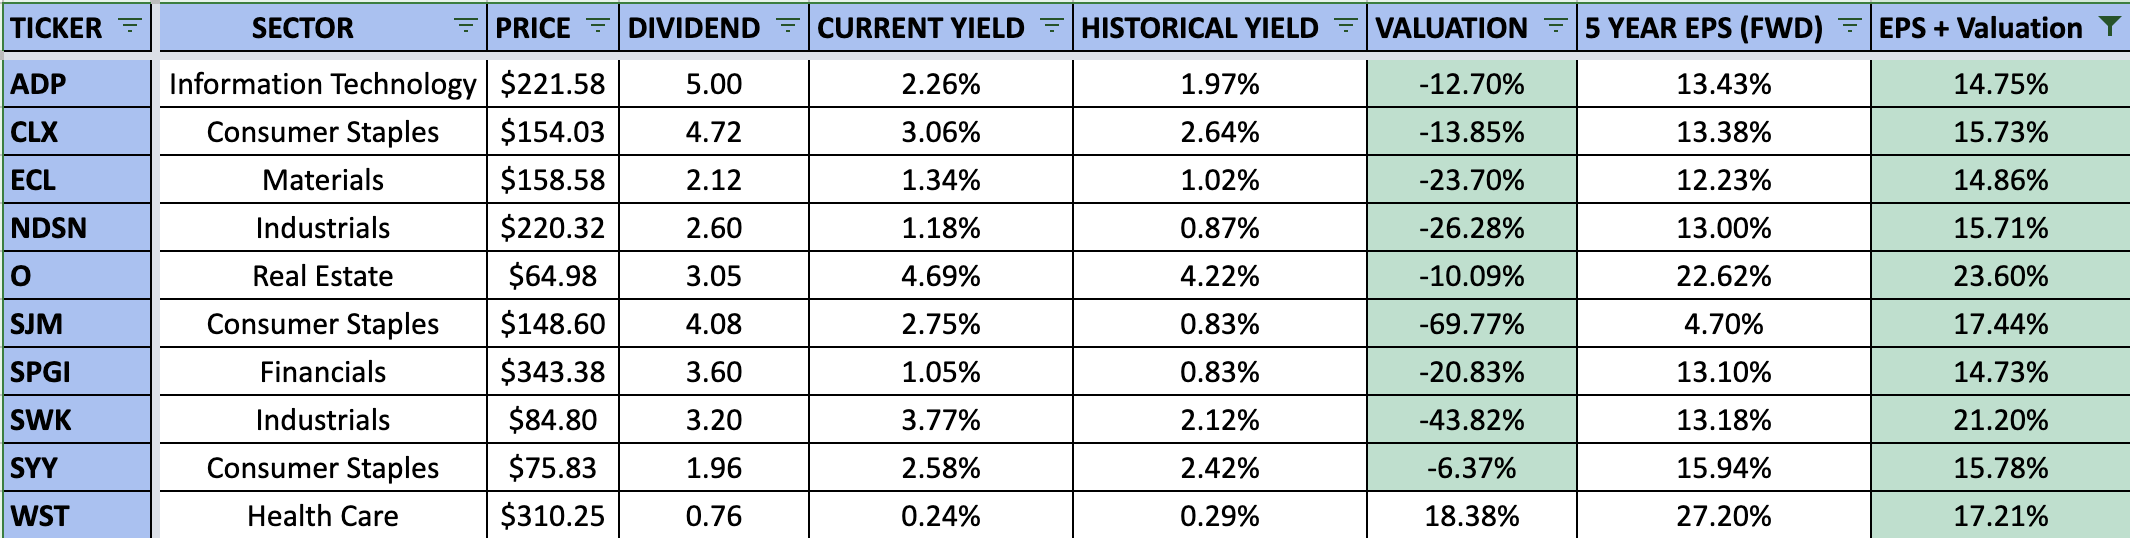
The Blended Strategy
Strategy 3 is a blend of the first two strategies, with a focus on the fastest expected growth but applied only to undervalued aristocrats. A blend of undervaluation and expected growth could narrow down the best aristocrats between the two strategies. The most undervalued aristocrats may not necessarily be poised for the fastest growth. Additionally targeting only undervalued aristocrats can offer a margin of safety in that securities are purchased for fair or better prices.
| Month |
| Blended |
| NOBL |
| SPY |
| Aug 21 |
| 2.64% |
| 1.87% |
| 2.98% |
| Sep 21 |
| -3.42% |
| -5.69% |
| -4.66% |
| Oct 21 |
| 2.70% |
| 5.95% |
| 7.02% |
| Nov 21 |
| -2.56% |
| -1.76% |
| -0.80% |
| Dec 21 |
| 10.07% |
| 6.54% |
| 4.63% |
| Jan 22 |
| -0.71% |
| -4.08% |
| -5.27% |
| Feb 22 |
| 0.49% |
| -2.59% |
| -2.95% |
| Mar 22 |
| 3.48% |
| 3.86% |
| 3.76% |
| Apr 22 |
| -5.04% |
| -3.42% |
| -8.78% |
| May 22 |
| 1.28% |
| 0.31% |
| 0.23% |
| Jun 22 |
| -6.23% |
| -6.73% |
| -8.25% |
| Jul 22 |
| 4.56% |
| 6.56% |
| 4.55% |
| Aug 22 |
| -3.29% |
| -2.78% |
| -4.08% |
| Sep 22 |
| -10.88% |
| -9.15% |
| -9.24% |
| Oct 22 |
| 9.97% |
| 10.31% |
| 8.13% |
| Nov 22 |
| 6.38% |
| 7.12% |
| 5.56% |
| Dec 22 |
| -5.32% |
| -4.12% |
| -5.76% |
| Jan 23 |
| 4.15% |
| 3.23% |
| 6.29% |
| Feb 23 |
| -3.65% |
| -2.25% |
| -2.48% |
| 2021 Partial |
| 9.18% |
| 6.54% |
| 9.06% |
| 2022 |
| -7.04% |
| -6.50% |
| -21.65% |
| 2023 |
| 0.35% |
| 0.91% |
| 3.65% |
| TOTAL |
| 1.86% |
| 0.52% |
| -11.44% |
| Alpha over NOBL |
| 1.34% |
| Alpha over SPY |
| 13.29% |
The table above shows the monthly and annual returns for the buy-and-hold portfolio of the fastest expected growth strategy.
The portfolio gained 4.15% in January, beating NOBL but trailing SPY. Similar to the prior two portfolios it is struggling in February, down 3.65% through the 24th. Since inception, this portfolio has generated alpha of 1.34% over NOBL and 13.29% over SPY. The lead over NOBL has been shrinking for a few months now and may not hold out much longer unless the portfolio starts to generate more generous total returns.
The portfolio consists of 36 unique present and former dividend aristocrats. I track this portfolio by investing $1,000 each month equally split amongst the 10 chosen aristocrats for that month. The positions are never trimmed or sold and all dividends are reinvested back into the issuing stock. People's United (PBCT) was removed from the portfolio in April as the company was acquired by M&T Bank; the value of the position was reinvested equally amongst the 10 chosen aristocrats for April. Here are all of the positions: the current market value; capital invested; total return; and allocation as of February 24th.
| TICKER |
| MARKET VALUE |
| CAPITAL INVESTED |
| TOTAL RETURN |
| CURRENT ALLOCATION |
| ABT |
| 101.99 |
| 100 |
| 1.99% |
| 0.55% |
| ADP |
| 190.90 |
| 200 |
| -4.55% |
| 1.02% |
| AMCR |
| 299.60 |
| 300 |
| -0.13% |
| 1.61% |
| AOS |
| 201.06 |
| 200 |
| 0.53% |
| 1.08% |
| APD |
| 588.25 |
| 500 |
| 17.65% |
| 3.15% |
| ATO |
| 750.46 |
| 600 |
| 25.08% |
| 4.02% |
| BDX |
| 407.43 |
| 400 |
| 1.86% |
| 2.18% |
| BEN |
| 202.03 |
| 200 |
| 1.01% |
| 1.08% |
| CAH |
| 499.33 |
| 300 |
| 66.44% |
| 2.68% |
| CAT |
| 135.18 |
| 100 |
| 35.18% |
| 0.72% |
| CINF |
| 263.45 |
| 200 |
| 31.72% |
| 1.41% |
| CLX |
| 427.97 |
| 400 |
| 6.99% |
| 2.29% |
| CTAS |
| 259.54 |
| 200 |
| 29.77% |
| 1.39% |
| ECL |
| 1,309.29 |
| 1300 |
| 0.71% |
| 7.02% |
| ESS |
| 314.98 |
| 300 |
| 4.99% |
| 1.69% |
| GD |
| 608.25 |
| 500 |
| 21.65% |
| 3.26% |
| HRL |
| 636.89 |
| 600 |
| 6.15% |
| 3.41% |
| IBM |
| 1,293.79 |
| 1100 |
| 17.62% |
| 6.93% |
| ITW |
| 120.40 |
| 100 |
| 20.40% |
| 0.65% |
| KMB |
| 131.97 |
| 100 |
| 31.97% |
| 0.71% |
| LOW |
| 624.48 |
| 600 |
| 4.08% |
| 3.35% |
| MDT |
| 1,098.52 |
| 1200 |
| -8.46% |
| 5.89% |
| MMM |
| 922.59 |
| 1300 |
| -29.03% |
| 4.94% |
| O |
| 521.39 |
| 500 |
| 4.28% |
| 2.79% |
| PBCT |
| 200 |
| -100.00% |
| 0.00% |
| PPG |
| 533.30 |
| 500 |
| 6.66% |
| 2.86% |
| ROP |
| 98.59 |
| 100 |
| -1.41% |
| 0.53% |
| SHW |
| 778.34 |
| 800 |
| -2.71% |
| 4.17% |
| SWK |
| 947.66 |
| 1100 |
| -13.85% |
| 5.08% |
| SYY |
| 803.96 |
| 800 |
| 0.50% |
| 4.31% |
| T |
| 107.62 |
| 100 |
| 7.62% |
| 0.58% |
| TGT |
| 543.31 |
| 500 |
| 8.66% |
| 2.91% |
| TROW |
| 820.02 |
| 900 |
| -8.89% |
| 4.40% |
| VFC |
| 926.71 |
| 1600 |
| -42.08% |
| 4.97% |
| WBA |
| 503.63 |
| 600 |
| -16.06% |
| 2.70% |
| WST |
| 264.40 |
| 200 |
| 32.20% |
| 1.42% |
| XOM |
| 419.90 |
| 200 |
| 109.95% |
| 2.25% |
Here are the 10 dividend aristocrats chosen for the blended strategy for March 2023. The table below shows potential undervaluation (column Valuation) and the expected growth rate (column EPS + Valuation) for each of the 10 chosen aristocrats. The data is from February 24th, so the current dividend yield may differ slightly from the stated yield.
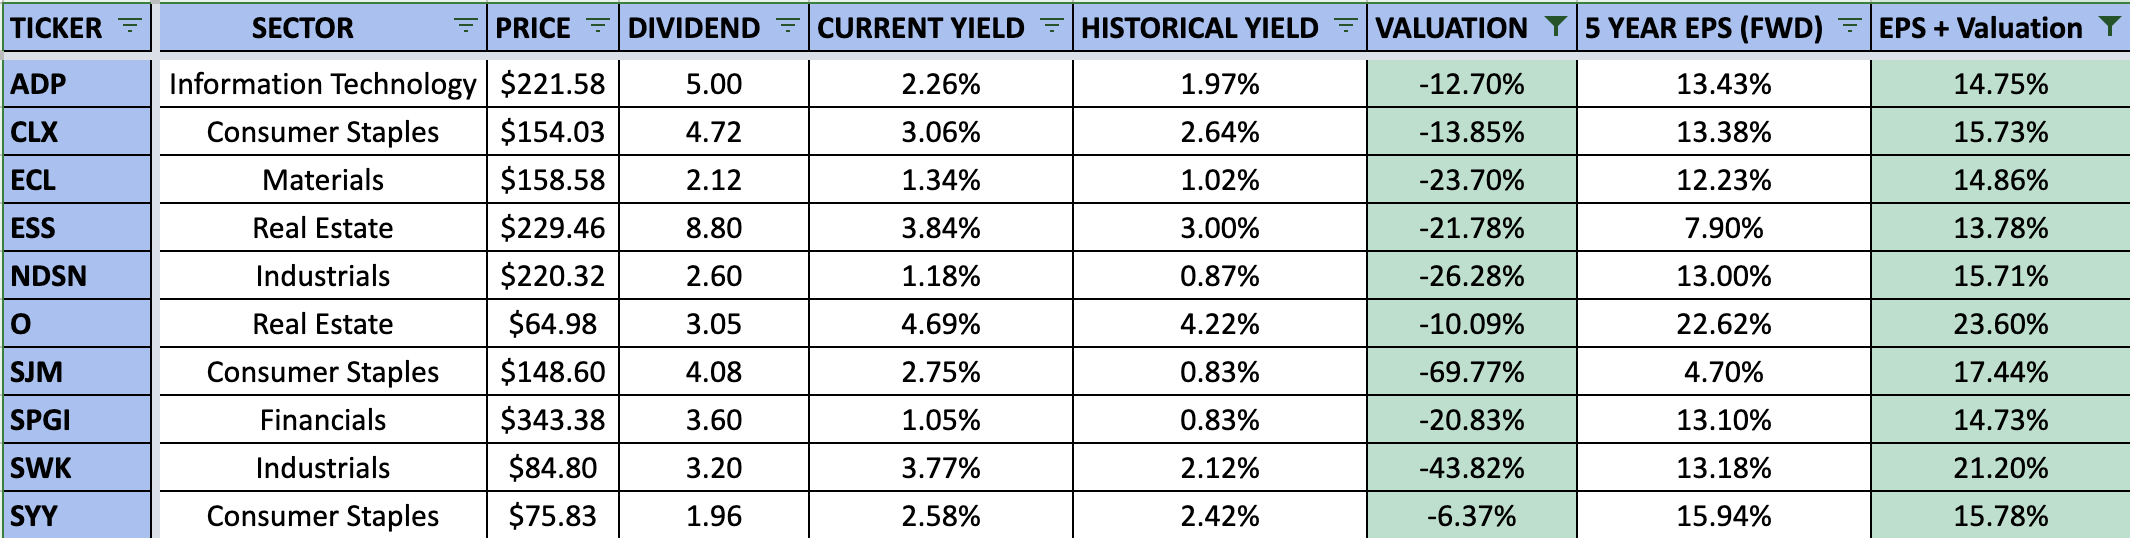
Performance Review
The 10 chosen aristocrats for the most undervalued strategy are down 4.46% in February and trailing NOBL by 2.21%. The fastest expected growth strategy selections are up 0.43% and beating NOBL by 2.68%. The blend strategy is down 2.94% and trailing NOBL by 0.69%. The fastest expected growth strategy is off to the best start this year seeing positive gains in both months thus far. The individual selections are also fairing much better than the long term buy-and-hold portfolios. However, I still believe that a buy-and-hold approach is the optimal investing path to take with these strategies.
Here is a comparison of the buy-and-hold portfolios and the individual monthly selections for each strategy. As you can see the buy-and-hold portfolios are still performing much better than if we bought and sold the 10 chosen aristocrats each month. A buy-and-hold approach is also a much more tax friendly investing strategy.
| Type |
| Most Undervalued |
| Fastest Growth |
| Blended |
| NOBL |
| Individual |
| -6.18% |
| 4.20% |
| 0.65% |
| 0.52% |
| Buy-and-Hold |
| 6.02% |
| 5.77% |
| 1.86% |
| 0.52% |
| O/U |
| 12.20% |
| 1.57% |
| 1.21% |
| 0.00% |
Final Thoughts
I personally believe each of the 3 strategies outlined above can theoretically beat the dividend aristocrat index over a long period of time. These strategies are based on simple principles of valuation and expected returns, and they are easy to understand and implement. Investors should keep in mind that selecting individual stocks carries more risk than investing in an index. The simplest and possibly the safest way to invest in the dividend aristocrats is to purchase shares of NOBL. The fund finished 2021 with a fantastic return, performed much better than the S&P in 2022 and has an annualized rate of return of 10.90% since inception.
The dividend aristocrat data in the images of this article came from my live Google spreadsheet that tracks all of the current dividend aristocrats. Because this data is updated continuously throughout the day, you may notice slightly different data for the same company across the images.
For further details see:
My Best Dividend Aristocrats For March 2023