SPGI - My Best Dividend Aristocrats For May 2023
2023-04-26 12:45:19 ET
Summary
- NOBL mustered a comeback in March finishing the month up 0.99%, the ETF is up 1.79% after Q1 2023.
- Q2 is off to a good start as NOBL is up 1.52% through April 25th.
- I present 3 strategies that I believe can theoretically beat the dividend aristocrat index in the long term.
- After nearly 21 months all 3 buy-and-hold portfolios continue to generate alpha over NOBL and SPY.
2023 Review
The ProShares S&P 500 Dividend Aristocrats ETF ( NOBL ) finished Q1 strong, gaining 0.99% in March and being up 1.79% over the past 3 months. Q2 got off to a good start with the ETF picking up an additional gain of 1.52% through April 25th. This pushes NOBL to a 3.34% gain year-to-date.
Not all of the dividend aristocrats contributed equally to NOBL's return in 2023; 26 dividend aristocrats are beating NOBL through month-end March, and 35 are generating positive total returns. These aristocrats are outpacing NOBL after March:
- West Pharma ( WST ) +47.33%
- Grainger ( GWW ) +24.15%
- Pentair ( PNR ) +23.44%
- A.O. Smith ( AOS ) +21.41%
- Nucor ( NUE ) +17.59%
- Ecolab ( ECL ) +14.11%
- Clorox ( CLX ) +13.71%
- Dover Corp. ( DOV ) +12.59%
- Target ( TGT ) +11.83%
- Illinois Tool Works ( ITW ) +11.10%
- Cincinnati Financial ( CINF ) +10.21%
- Church & Dwight ( CHD ) +10.04%
- Linde plc ( LIN ) +9.39%
- C.H. Robinson ( CHRW ) +9.18%
- Stanley Black & Decker ( SWK ) +8.28%
- PPG Industries ( PPG ) +6.75%
- McDonald's ( MCD ) +6.71%
- T. Rowe Price ( TROW ) +4.70%
- Medtronic ( MDT ) +4.64%
- Walmart ( WMT ) +4.42%
- Franklin Resources ( BEN ) +3.29%
- S&P Global ( SPGI ) +3.21%
- Cintas ( CTAS ) +2.72%
- Expeditors Int'l ( EXPD ) +2.41%
- Roper Technologies ( ROP ) +2.15%
- Albemarle ( ALB ) +2.12%
The S&P 500, as measured by SPY , was up 3.71% in March and is up another 0.79% through April 25th. NOBL beat SPY in 2022 with a loss of 6.5% compared to a loss of 21.65%. SPY started 2023 on stronger footing beating NOBL by 3.06% in January, it gave up some of this lead in February as the lead has shrunk to 2.83%. In March however, SPY crushed NOBL extending its lead on the year to 5.67%. NOBL is outpacing SPY in April thus far and should see this gap shrink by a bit. The dividend aristocrats are not known to consistently beat the S&P 500 index, in fact, the dividend aristocrat index underperformed the S&P 500 index for 6 out of the last 8 full calendar years.
However, if you look further back in history, the dividend aristocrat index is outperforming the S&P 500 index by about 2.18% per year between 1990 and 2022. A significant portion of this long-term outperformance is attributable to the dot com bubble and the financial crisis as well as the immediate years following each market crash. This pattern was broken with the 2020 market crash, perhaps the much shorter duration of the crash and recovery are the reason. The dot com bubble and the financial crisis both extended for multiple years while the 2020 market crash was fully recovered in a matter of months. 2022 also proved to be a strong year for the aristocrats as they earned 15.15% of alpha on the S&P, making up for 3 years of underperformance.
Even though the dividend aristocrats have trailed the S&P for the better part of the last 8 years, long-term investors can rest assured that based on history, over a much longer time period, the dividend aristocrats can hold their own. There are currently 67 companies in the dividend aristocrat index but strong historical returns for the index can be attributed to only a handful of them. As an investor, I am always curious how to identify these drivers of outperformance.
I want to present 3 strategies that theoretically could identify winning aristocrats and lead to better performance than the dividend aristocrat index. These strategies work best with a buy and hold long-term investing approach as will be evidenced by the results. They are based on quantitative models that do not consider qualitative data, therefore it is prudent that further due diligence is performed on all chosen stocks.
The Most Undervalued Strategy
Strategy number 1 is a focus on valuation and more specifically it targets the potentially most undervalued dividend aristocrats. In theory, this is a long-term strategy since it may take some time to fully see the reward of leveraging a valuation approach. My preferred method for valuation is dividend yield theory, mainly for its simplicity. Unlike other valuation methods, dividend yield theory does not require making assumptions aside from assuming that a given stock will revert back to its long-term trailing dividend yield.
This valuation technique works best for mature businesses with long histories of dividend growth, making the dividend aristocrats an ideal pool of companies to value using this technique.
Selecting the 10 most undervalued dividend aristocrats each month and adopting a buy and hold investing approach can lead to long-term outperformance when/if the targeted stocks return to fair valuation. It may take a few months or even years to see if this strategy actually pays off. I predict that it will underperform NOBL for the first few months while we wait for bargain stocks to return to fair value.
| Month |
| Most Undervalued |
| NOBL |
| SPY |
| Aug 21 |
| 0.49% |
| 1.87% |
| 2.98% |
| Sep 21 |
| -2.99% |
| -5.69% |
| -4.66% |
| Oct 21 |
| 3.63% |
| 5.95% |
| 7.02% |
| Nov 21 |
| -2.19% |
| -1.76% |
| -0.80% |
| Dec 21 |
| 10.37% |
| 6.54% |
| 4.63% |
| Jan 22 |
| 1.04% |
| -4.08% |
| -5.27% |
| Feb 22 |
| -1.94% |
| -2.59% |
| -2.95% |
| Mar 22 |
| 3.40% |
| 3.86% |
| 3.76% |
| Apr 22 |
| -2.14% |
| -3.42% |
| -8.78% |
| May 22 |
| 3.11% |
| 0.31% |
| 0.23% |
| Jun 22 |
| -7.30% |
| -6.73% |
| -8.25% |
| Jul 22 |
| 5.00% |
| 6.56% |
| 4.55% |
| Aug 22 |
| -3.25% |
| -2.78% |
| -4.08% |
| Sep 22 |
| -11.39% |
| -9.15% |
| -9.24% |
| Oct 22 |
| 10.07% |
| 10.31% |
| 8.13% |
| Nov 22 |
| 6.99% |
| 7.12% |
| 5.56% |
| Dec 22 |
| -5.41% |
| -4.12% |
| -5.76% |
| Jan 23 |
| 4.83% |
| 3.23% |
| 6.29% |
| Feb 23 |
| -3.33% |
| -2.36% |
| -2.51% |
| Mar 23 |
| -0.86% |
| 0.99% |
| 3.71% |
| Apr 23 |
| 2.25% |
| 1.52% |
| 0.79% |
| 2021 Partial |
| 9.05% |
| 6.54% |
| 9.06% |
| 2022 |
| -3.91% |
| -6.50% |
| -21.65% |
| 2023 |
| 2.73% |
| 3.34% |
| 8.32% |
| TOTAL |
| 7.64% |
| 2.95% |
| -7.45% |
| Alpha over NOBL |
| 4.69% |
| Alpha over SPY |
| 15.08% |
The table above shows the monthly and annual returns for the buy-and-hold portfolio of the most undervalued strategy.
The portfolio lost to both NOBL and SPY in March, trailing by 1.85% and 4.57% respectively. March is looking better thus far, through the 25th the portfolio is up 2.25% compared to 1.52% for NOBL and 0.79% for SPY. Year-to-date the portfolio now trails both NOBL and SPY. Since inception, this portfolio has generated 4.69% of alpha over NOBL and 15.08% of alpha over SPY. One terrible month wasn't enough to erase the long-term alpha.
The portfolio consists of 37 unique present and former dividend aristocrats. I track this portfolio by investing $1,000 each month equally split among the 10 chosen aristocrats for that month. The positions are never trimmed or sold and all dividends are reinvested back into the issuing stock.
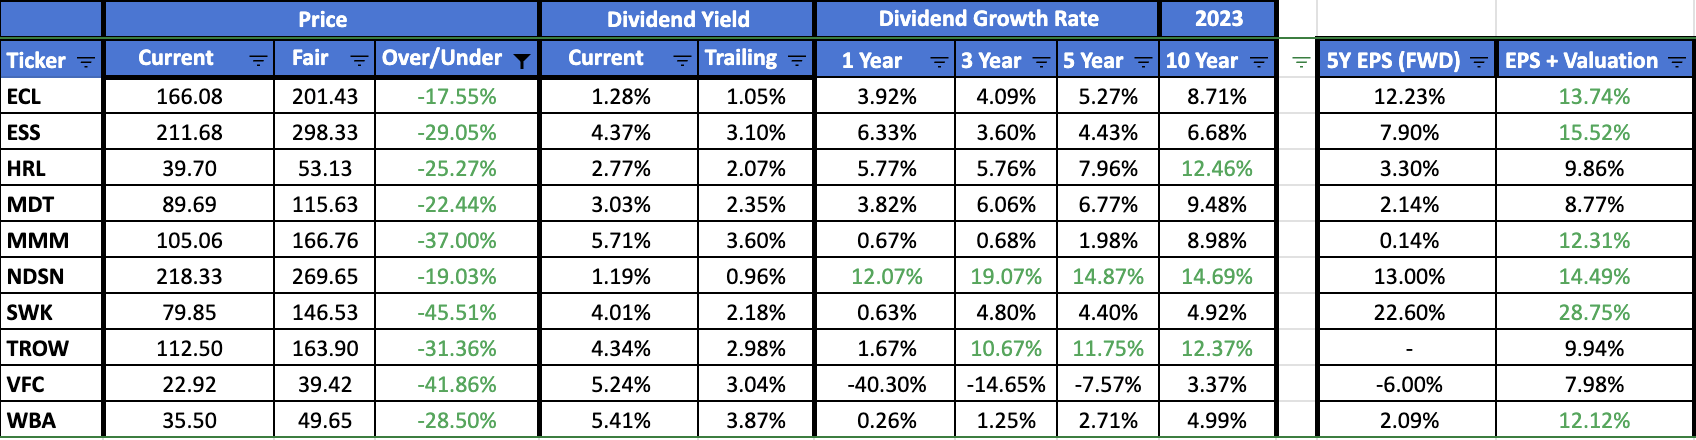
Here are the 10 most undervalued dividend aristocrats chosen for the month of May 2023. The table below shows potential undervaluation (column Over/Under) for each of the 10 chosen aristocrats. The image below is taken from a new spreadsheet I recently created where I am self-computing the 5-year trailing dividend yield. Previously I used Seeking Alpha as a source for the historical yield.
Here is a deeper look at 3 of the most undervalued aristocrats from the table above.
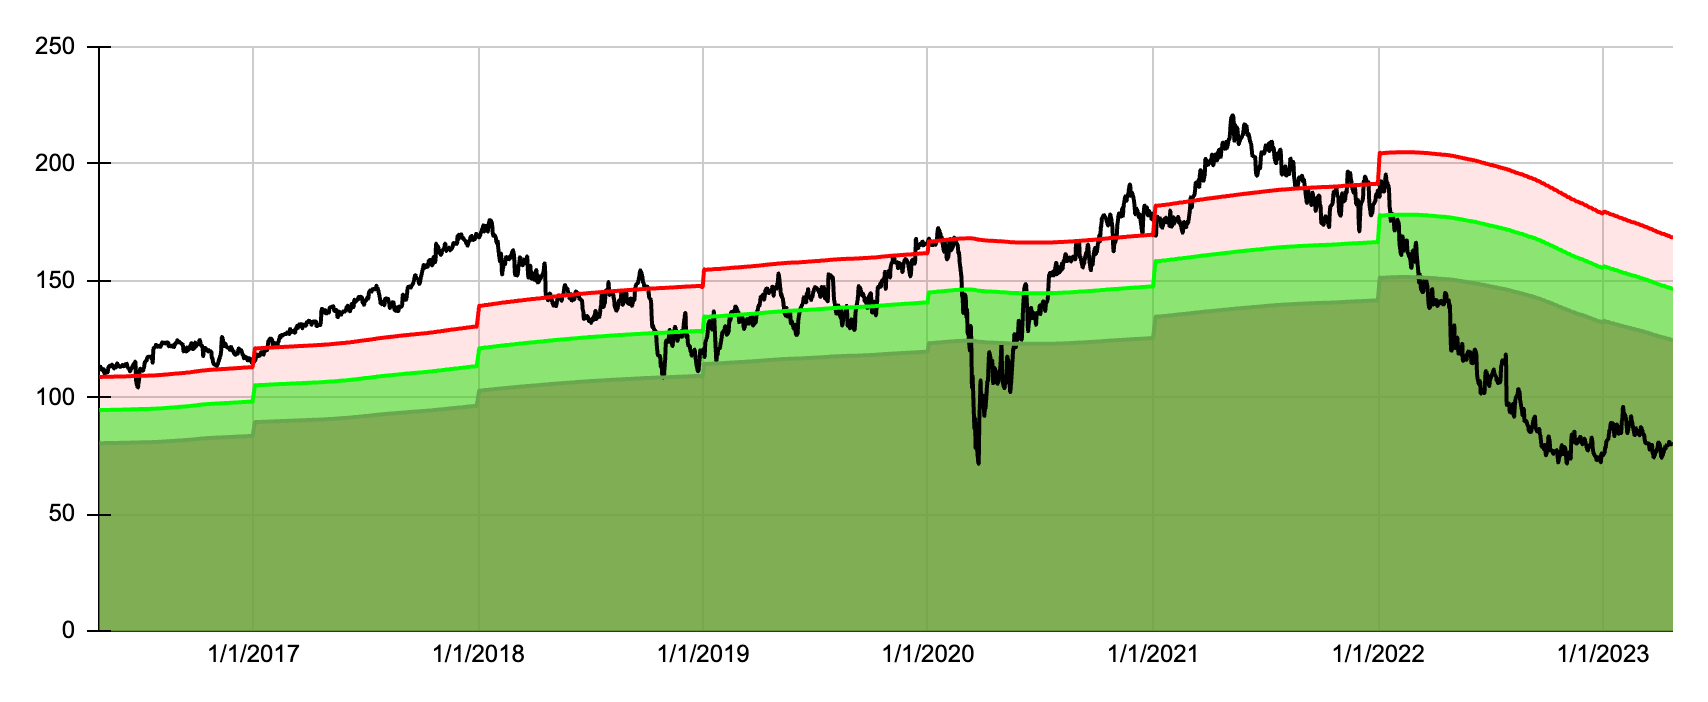
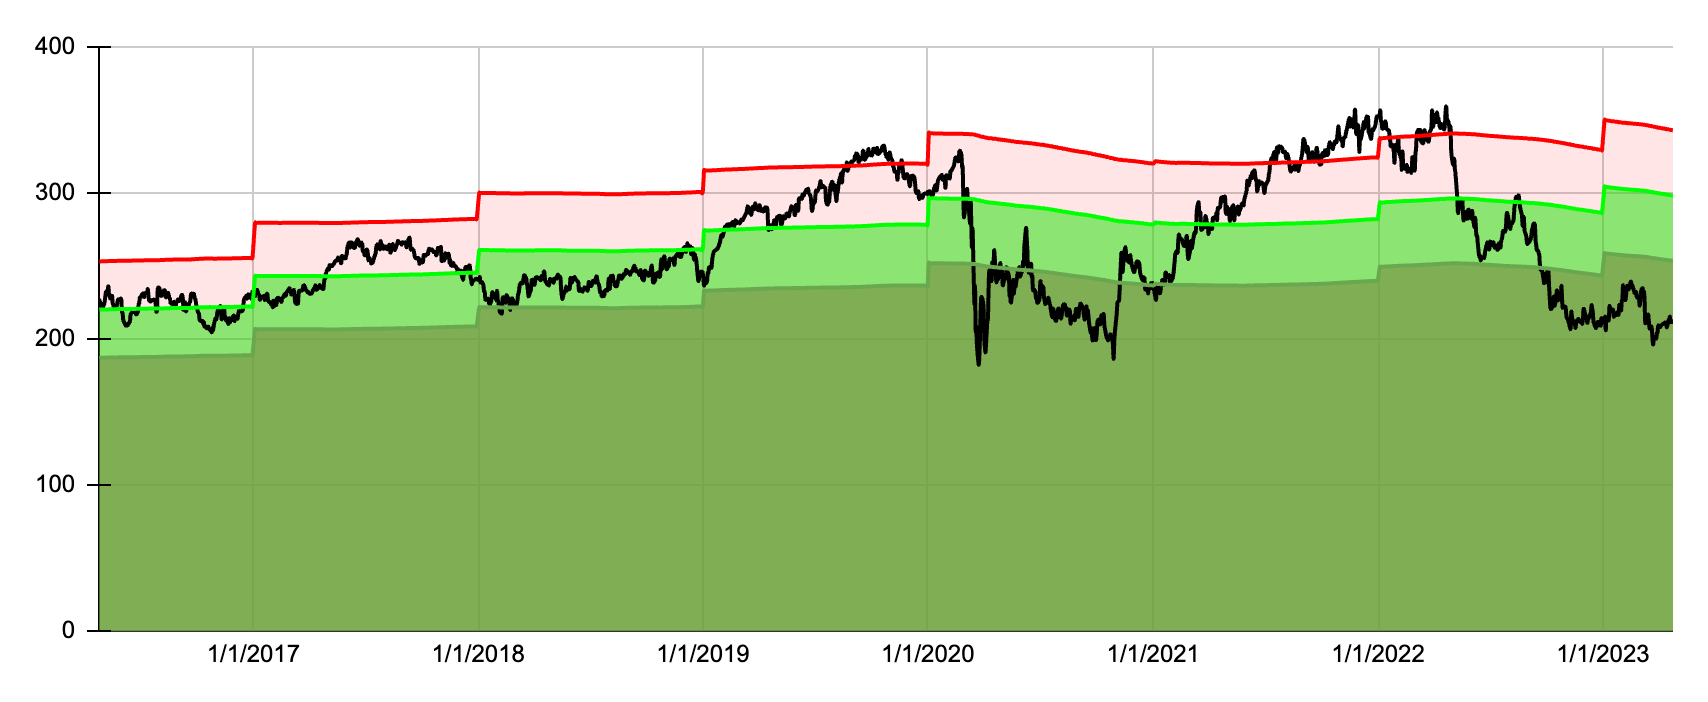
Stanley Black and Decker ( SWK ) currently looks to be approximately 45% undervalued. In the image below the black line is the actual price of SWK since April of 2016. The light green shaded area represents a 0 to 15% undervalued zone. The dark green area represents undervaluation in excess of 15%. The light red shaded area represents a 0 to 15% overvalued zone.
An estimated daily return test for the period March 2016 through March 2022 yielded positive results in the application of dividend yield theory as a valuation tool. The average return of investing in the stock on all days when the stock appeared to be undervalued was -15.74%. The average return of investing in the stock on all days regardless of valuation was -15.99%. And the average return of investing in the stock on all days when it appeared overvalued was -16.05%. SWK has fallen quite a bit since mid to late 2021 and the historical returns reflect that decline adequately.
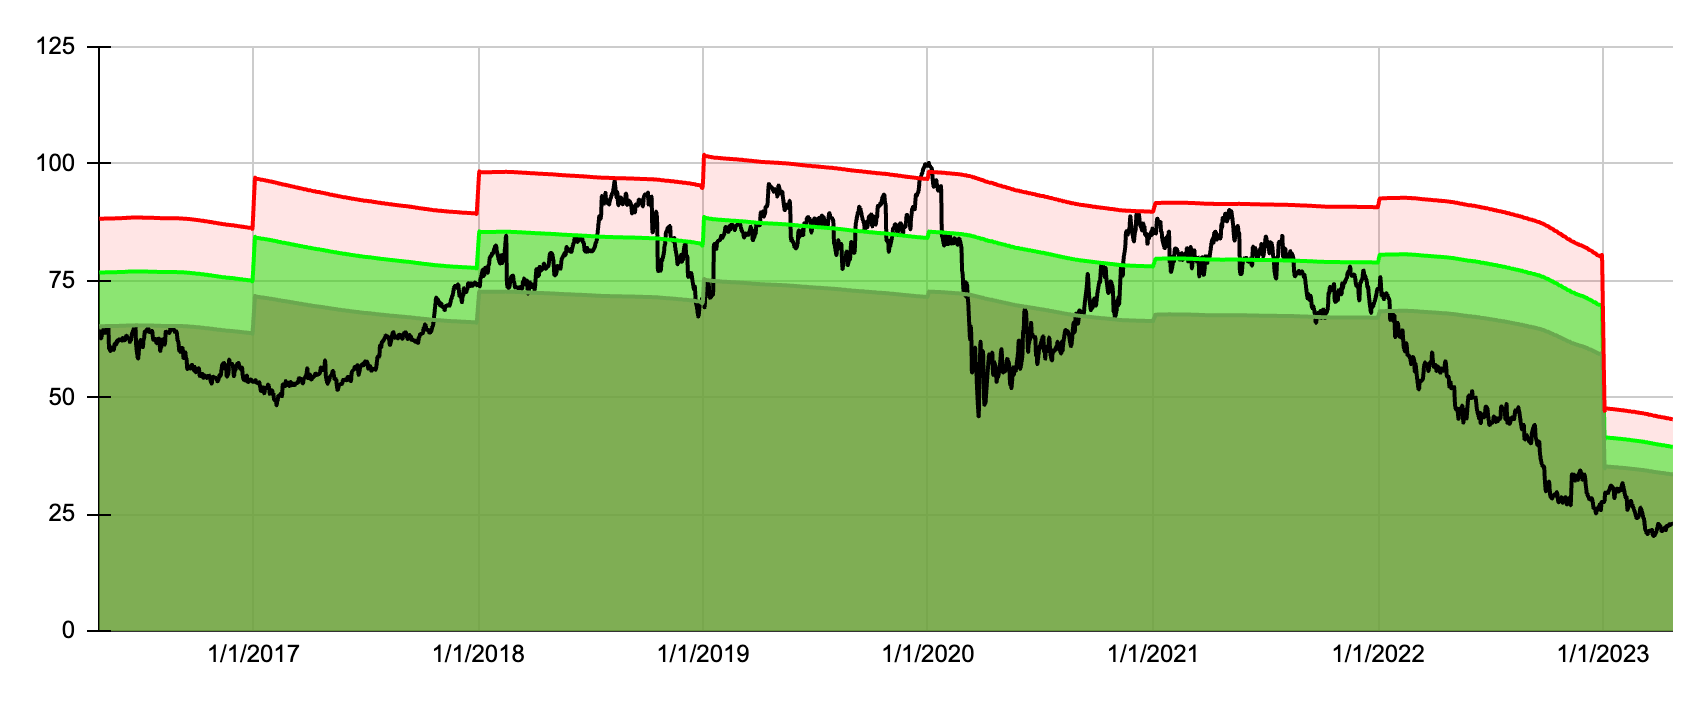
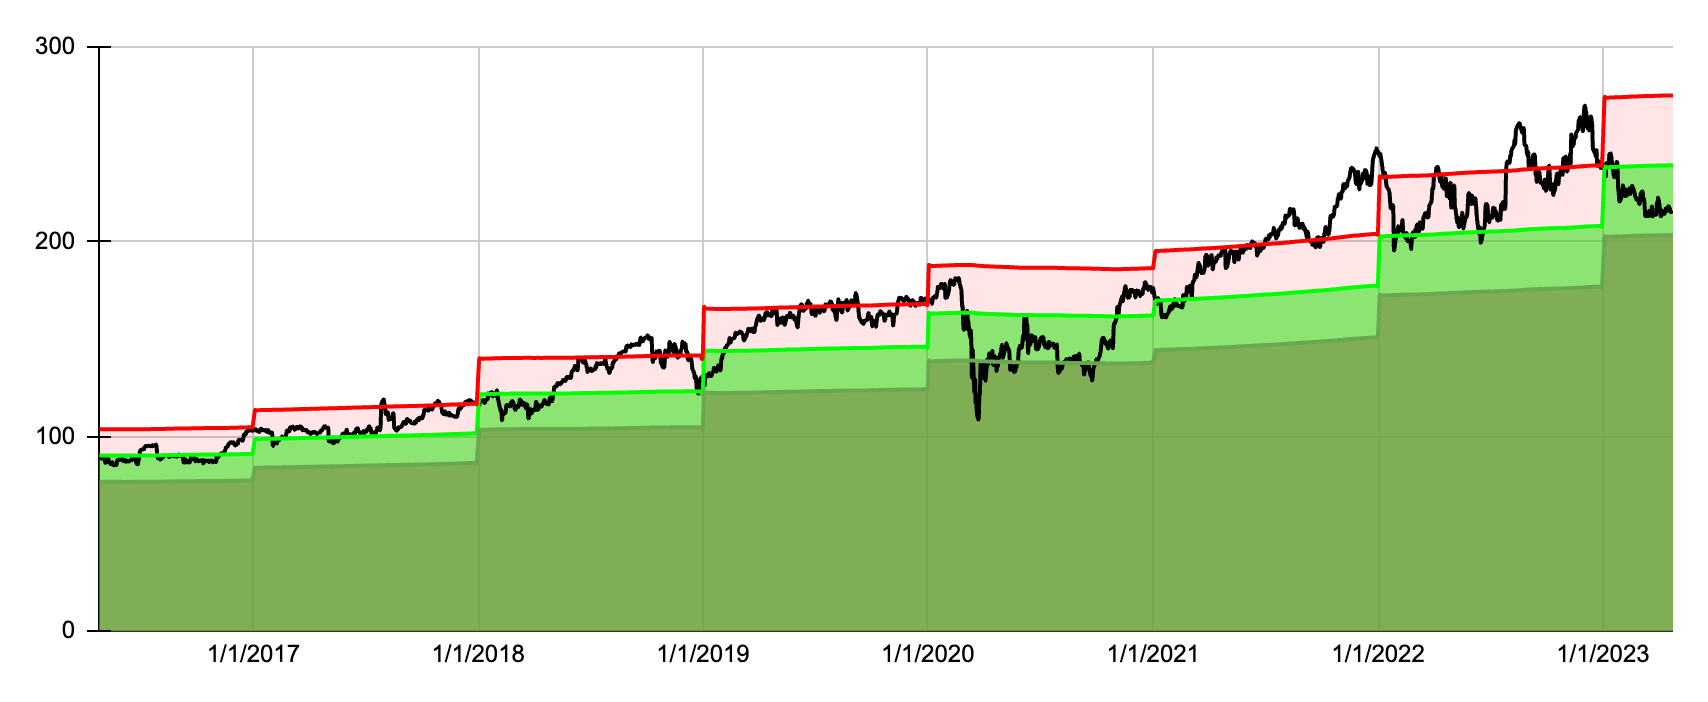
Here is a dividend yield theory chart for V.F. Corporation (VFC).
The average return of investing in the stock on all days when it appeared to be undervalued was -22.27%. The average return of investing in the stock on all days regardless of valuation was -24.74%. And the average return of investing in the stock on all days when it appeared overvalued was -31.92%. VFC is another stock that has been beaten up recently and the dividend cut earlier this year did not help.
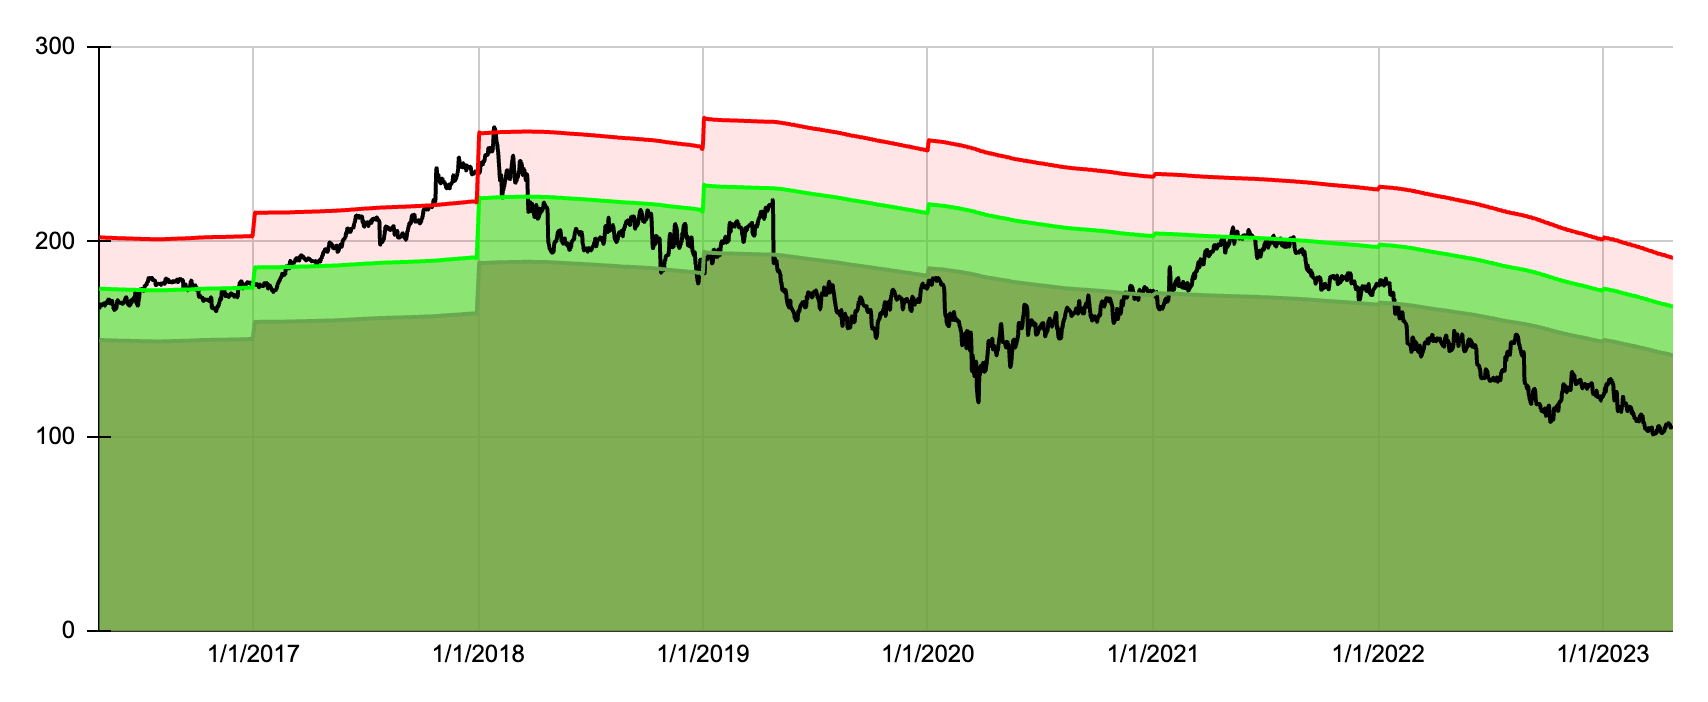
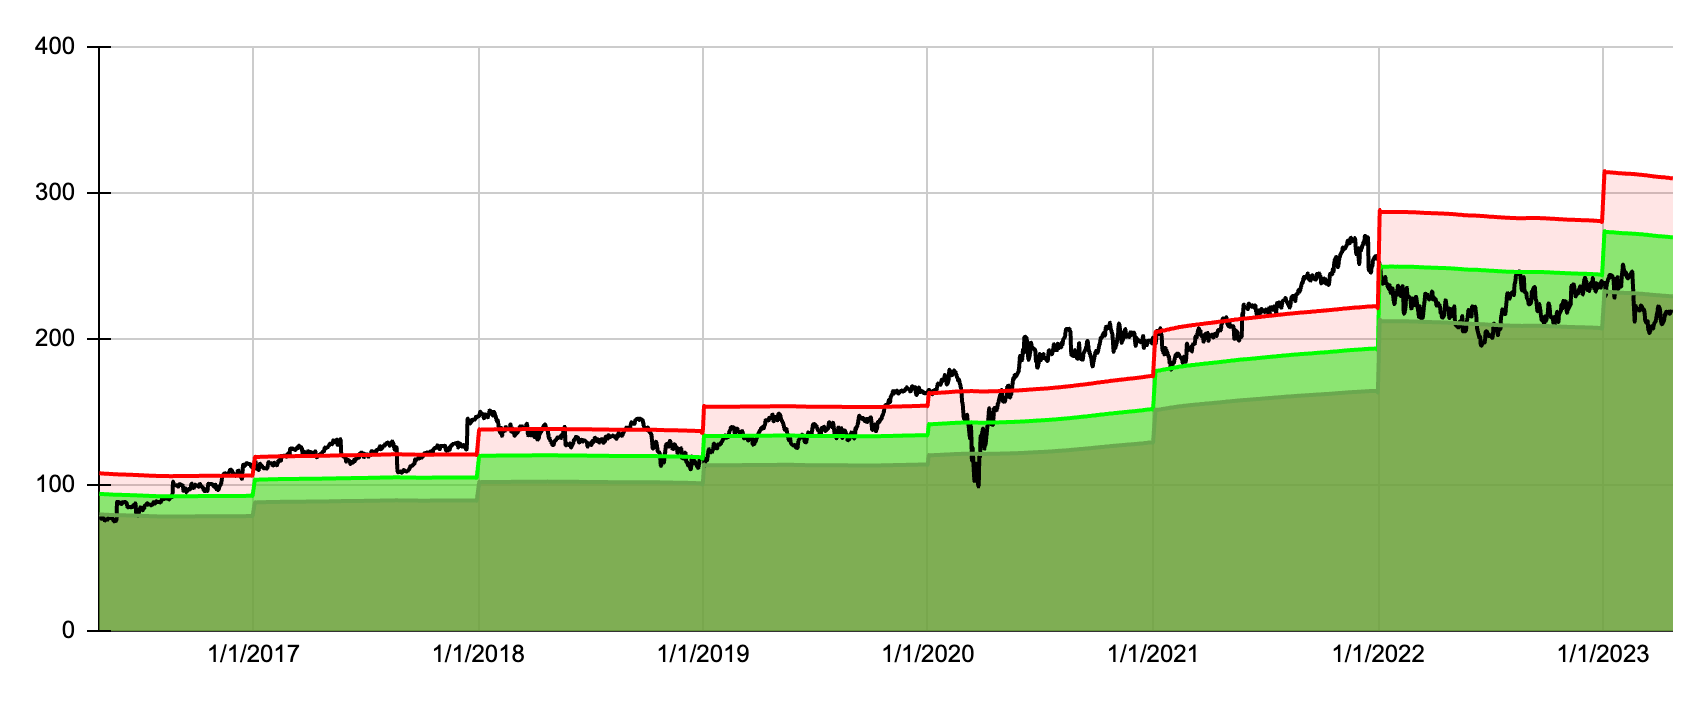
Here is a dividend yield theory chart for 3M Company ( MMM ).
The average return of investing in the stock on all days when it appeared to be undervalued was -12.62%. The average return of investing in the stock on all days regardless of valuation was -11.59%. And the average return of investing in the stock on all days when it appeared overvalued was -8.45%. MMM is one of the few instances where dividend yield theory has not been a profitable strategy to apply during the last 7 years. The stock has primarily appeared undervalued as its price has continued to slowly sink lower.
The Fastest Expected Growth Strategy
Strategy number 2 is a focus on dividend aristocrats that are expected to grow the fastest in the near future. Historically, there has been a correlation between earnings per share growth and share price appreciation. Companies that have grown their earnings faster have also seen higher total returns. One way to gauge how fast earnings for a company will grow is to leverage analyst forecasts. For this strategy, I decided to use a discounted five-year EPS growth forecast combined with a return to fair valuation and the dividend yield to identify the 10 best aristocrats poised for the best total return in the future.
| Month |
| Fastest Growth |
| NOBL |
| SPY |
| Aug 21 |
| 5.12% |
| 1.87% |
| 2.98% |
| Sep 21 |
| -4.42% |
| -5.69% |
| -4.66% |
| Oct 21 |
| 5.92% |
| 5.95% |
| 7.02% |
| Nov 21 |
| -2.06% |
| -1.76% |
| -0.80% |
| Dec 21 |
| 7.09% |
| 6.54% |
| 4.63% |
| Jan 22 |
| -4.42% |
| -4.08% |
| -5.27% |
| Feb 22 |
| -0.10% |
| -2.59% |
| -2.95% |
| Mar 22 |
| 3.71% |
| 3.86% |
| 3.76% |
| Apr 22 |
| -2.19% |
| -3.42% |
| -8.78% |
| May 22 |
| 0.12% |
| 0.31% |
| 0.23% |
| Jun 22 |
| -8.94% |
| -6.73% |
| -8.25% |
| Jul 22 |
| 6.09% |
| 6.56% |
| 4.55% |
| Aug 22 |
| -2.69% |
| -2.78% |
| -4.08% |
| Sep 22 |
| -11.37% |
| -9.15% |
| -9.24% |
| Oct 22 |
| 13.68% |
| 10.31% |
| 8.13% |
| Nov 22 |
| 6.14% |
| 7.12% |
| 5.56% |
| Dec 22 |
| -7.53% |
| -4.12% |
| -5.76% |
| Jan 23 |
| 9.41% |
| 3.23% |
| 6.29% |
| Feb 23 |
| -3.01% |
| -2.36% |
| -2.51% |
| Mar 23 |
| -1.79% |
| 0.99% |
| 3.71% |
| Apr 23 |
| 0.15% |
| 1.52% |
| 0.79% |
| 2021 Partial |
| 11.62% |
| 6.54% |
| 9.06% |
| 2022 |
| -9.86% |
| -6.50% |
| -21.65% |
| 2023 |
| 4.37% |
| 3.34% |
| 8.32% |
| TOTAL |
| 5.01% |
| 2.95% |
| -7.45% |
| Alpha over NOBL |
| 2.07% |
| Alpha over SPY |
| 12.46% |
The table above shows the monthly and annual returns for the buy-and-hold portfolio of the fastest expected growth strategy.
After a great start to the year in January, it's been a rough ride for this strategy. It underperformed in March falling 1.79% while NOBL posted a gain of 0.99% and SPY 3.71%. April is not looking much better as this strategy is up only 0.15% through April 25th, compared to 1.52% for NOBL and 0.79% for SPY. However, given the above average return in January, the portfolio maintains a comfortable lead over NOBL but finds itself trailing SPY year-to-date. Since inception, this portfolio has generated 2.07% of alpha over NOBL and 12.46% of alpha over SPY.
The portfolio consists of 34 unique present and former dividend aristocrats. I track this portfolio by investing $1,000 each month equally split amongst the 10 chosen aristocrats for that month. The positions are never trimmed or sold and all dividends are reinvested back into the issuing stock. People's United was removed from the portfolio in April, as the company was acquired by M&T Bank ( MTB ); the value of the position was reinvested equally amongst the 10 chosen aristocrats for April.
Here are the 10 dividend aristocrats poised for the best total return for the month of May 2023. The table below shows the expected growth rate (column EPS + Valuation) for each of the 10 chosen aristocrats.
Here is a deeper look at 3 of the fastest expected growth dividend aristocrats chosen for May 2023, omitting those already shown for the most undervalued strategy.
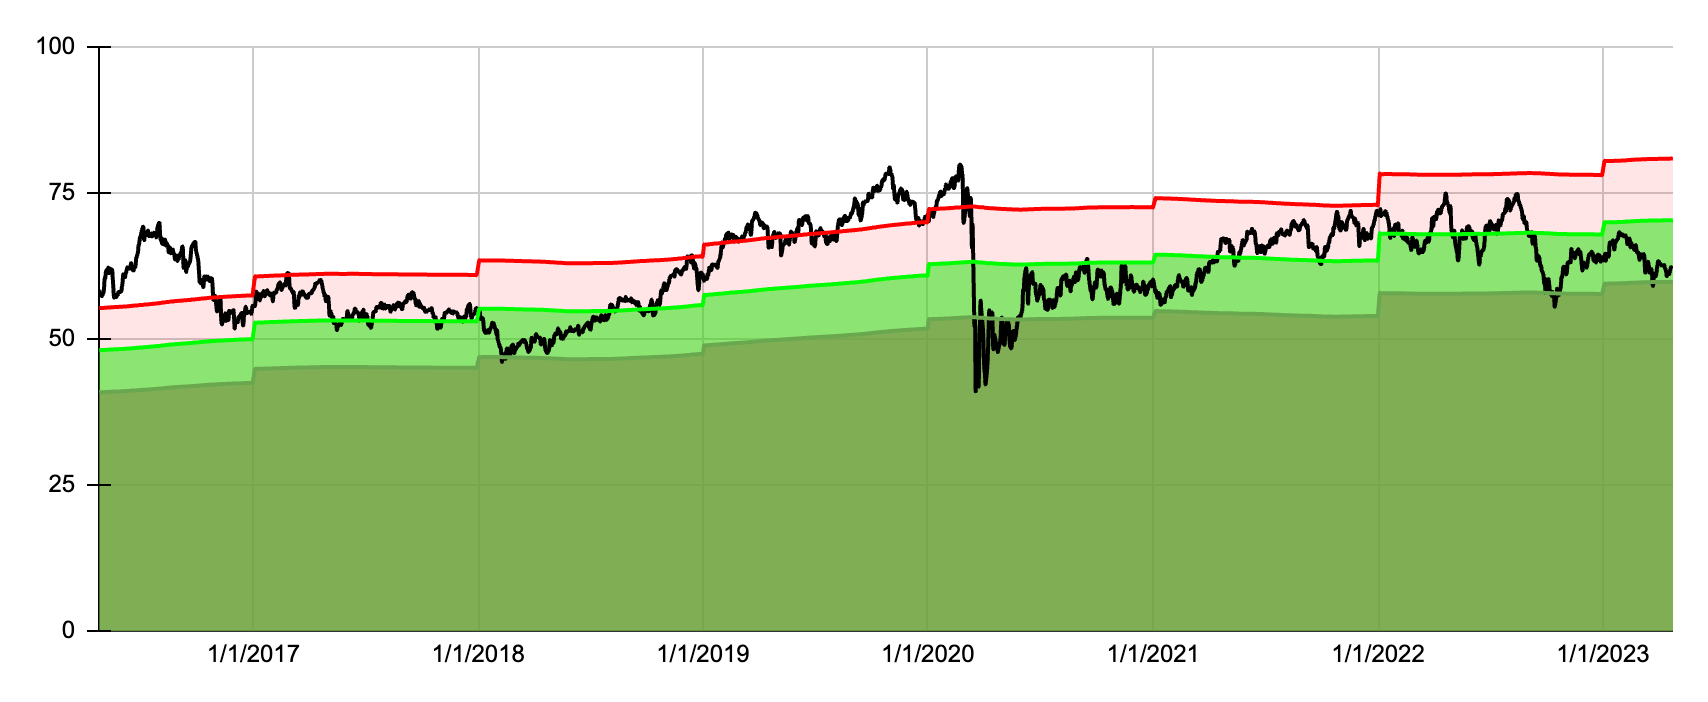
Here is a dividend yield theory chart for Realty Income ( O ).
The average return of investing in the stock on all days when it appeared to be undervalued was 6.64%. The average return of investing in the stock on all days regardless of valuation was 3.48%. And the average return of investing in the stock on all days when it appeared overvalued was 1.92%.
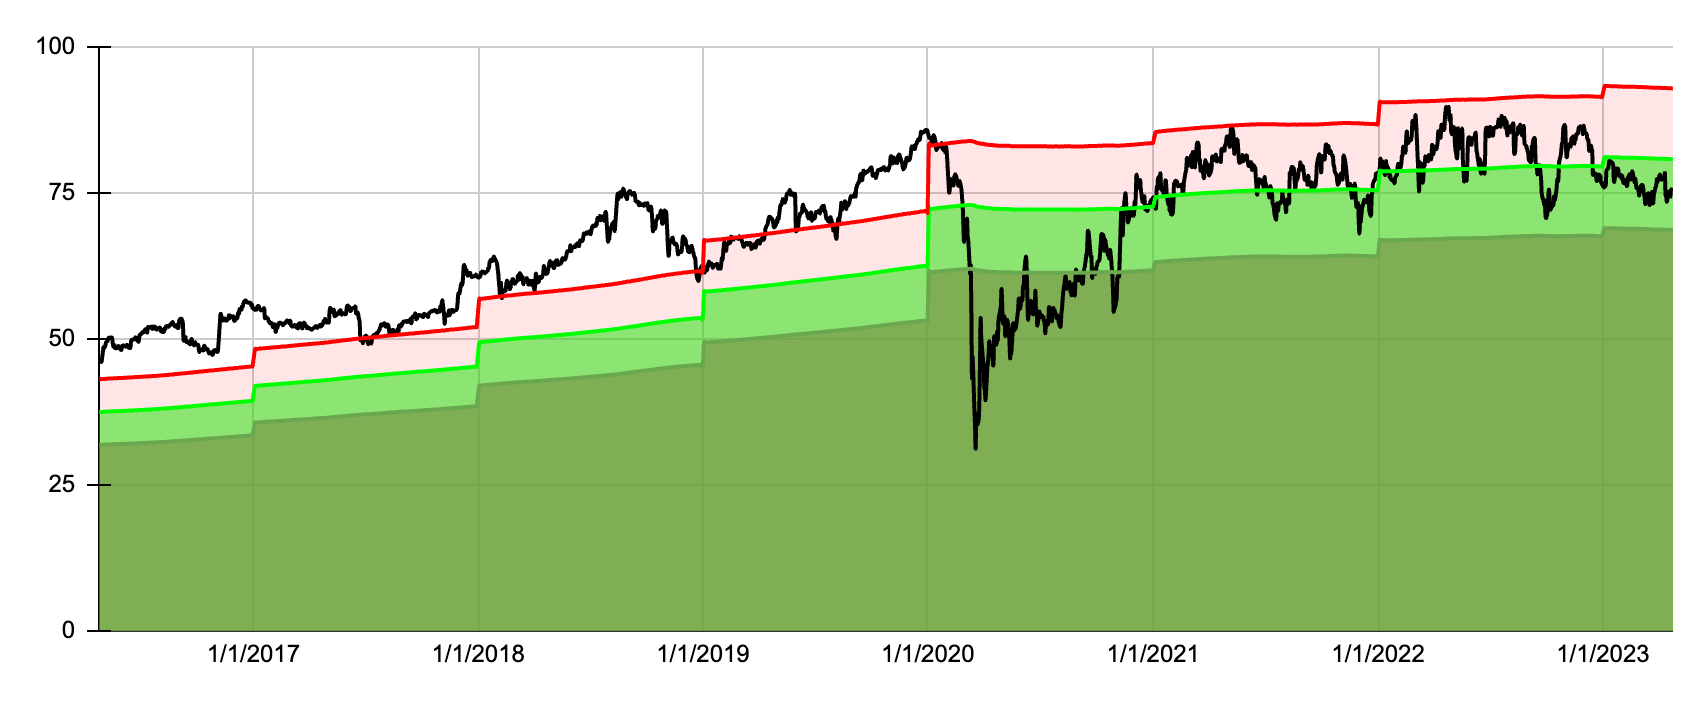
Here is a dividend yield theory chart for Cincinnati Financial ( CINF ).
The average return of investing in the stock on all days when it appeared to be undervalued was 15.70%. The average return of investing in the stock on all days regardless of valuation was 5.94%. And the average return of investing in the stock on all days when it appeared overvalued was 4.14%.
Here is a dividend yield theory chart for Sysco ( SYY ).
The average return of investing in the stock on all days when it appeared to be undervalued was 10.39%. The average return of investing in the stock on all days regardless of valuation was 5.21%. And the average return of investing in the stock on all days when it appeared overvalued was 4.10%.
The Blended Strategy
Strategy 3 is a blend of the first two strategies, with a focus on the fastest expected growth but applied only to undervalued aristocrats. A blend of undervaluation and expected growth could narrow down the best aristocrats between the two strategies. The most undervalued aristocrats may not necessarily be poised for the fastest growth. Additionally targeting only undervalued aristocrats can offer a margin of safety in that securities are purchased for fair or better prices.
| Month |
| Blended |
| NOBL |
| SPY |
| Aug 21 |
| 2.64% |
| 1.87% |
| 2.98% |
| Sep 21 |
| -3.42% |
| -5.69% |
| -4.66% |
| Oct 21 |
| 2.70% |
| 5.95% |
| 7.02% |
| Nov 21 |
| -2.56% |
| -1.76% |
| -0.80% |
| Dec 21 |
| 10.07% |
| 6.54% |
| 4.63% |
| Jan 22 |
| -0.71% |
| -4.08% |
| -5.27% |
| Feb 22 |
| 0.49% |
| -2.59% |
| -2.95% |
| Mar 22 |
| 3.48% |
| 3.86% |
| 3.76% |
| Apr 22 |
| -5.04% |
| -3.42% |
| -8.78% |
| May 22 |
| 1.28% |
| 0.31% |
| 0.23% |
| Jun 22 |
| -6.23% |
| -6.73% |
| -8.25% |
| Jul 22 |
| 4.56% |
| 6.56% |
| 4.55% |
| Aug 22 |
| -3.29% |
| -2.78% |
| -4.08% |
| Sep 22 |
| -10.88% |
| -9.15% |
| -9.24% |
| Oct 22 |
| 9.97% |
| 10.31% |
| 8.13% |
| Nov 22 |
| 6.38% |
| 7.12% |
| 5.56% |
| Dec 22 |
| -5.32% |
| -4.12% |
| -5.76% |
| Jan 23 |
| 4.15% |
| 3.23% |
| 6.29% |
| Feb 23 |
| -3.45% |
| -2.36% |
| -2.51% |
| Mar 23 |
| -0.31% |
| 0.99% |
| 3.71% |
| Apr 23 |
| 1.53% |
| 1.52% |
| 0.79% |
| 2021 Partial |
| 9.18% |
| 6.54% |
| 9.06% |
| 2022 |
| -7.04% |
| -6.50% |
| -21.65% |
| 2023 |
| 1.78% |
| 3.34% |
| 8.32% |
| TOTAL |
| 3.30% |
| 2.95% |
| -7.45% |
| Alpha over NOBL |
| 0.36% |
| Alpha over SPY |
| 10.75% |
The table above shows the monthly and annual returns for the buy-and-hold portfolio of the fastest expected growth strategy.
The portfolio underperformed in March, trailing NOBL by 1.30% and SPY by 4.02%. April is looking better thus far with the portfolio outpacing NOBL by 0.01% and SPY by 0.74% through April 25th. Since inception, this portfolio has generated alpha of 0.36% over NOBL and 10.75% over SPY. The lead over NOBL has been shrinking this year and we may see the portfolio fall behind very soon unless it can return back to favor.
The portfolio consists of 39 unique present and former dividend aristocrats. I track this portfolio by investing $1,000 each month equally split amongst the 10 chosen aristocrats for that month. The positions are never trimmed or sold and all dividends are reinvested back into the issuing stock. People's United was removed from the portfolio in April as the company was acquired by M&T Bank; the value of the position was reinvested equally amongst the 10 chosen aristocrats for April.
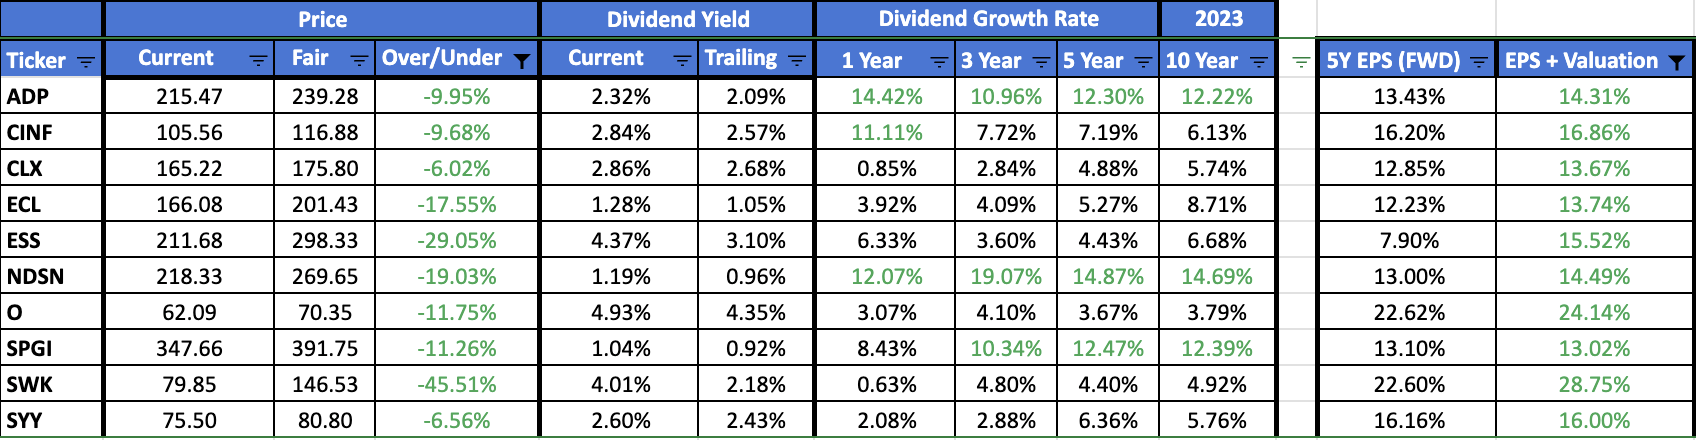
Here are the 10 dividend aristocrats chosen for the blended strategy for May 2023. The table below shows potential undervaluation (column Over/Under) and the expected growth rate (column EPS + Valuation) for each of the 10 chosen aristocrats.
Here is a deeper look at 3 of the dividend aristocrats chosen for May 2023 in the blended strategy.
Here is a dividend yield theory chart for Essex Property Trust ( ESS ).
The average return of investing in the stock on all days when it appeared to be undervalued was 0.47%. The average return of investing in the stock on all days regardless of valuation was -4.89%. And the average return of investing in the stock on all days when it appeared overvalued was -9.59%.
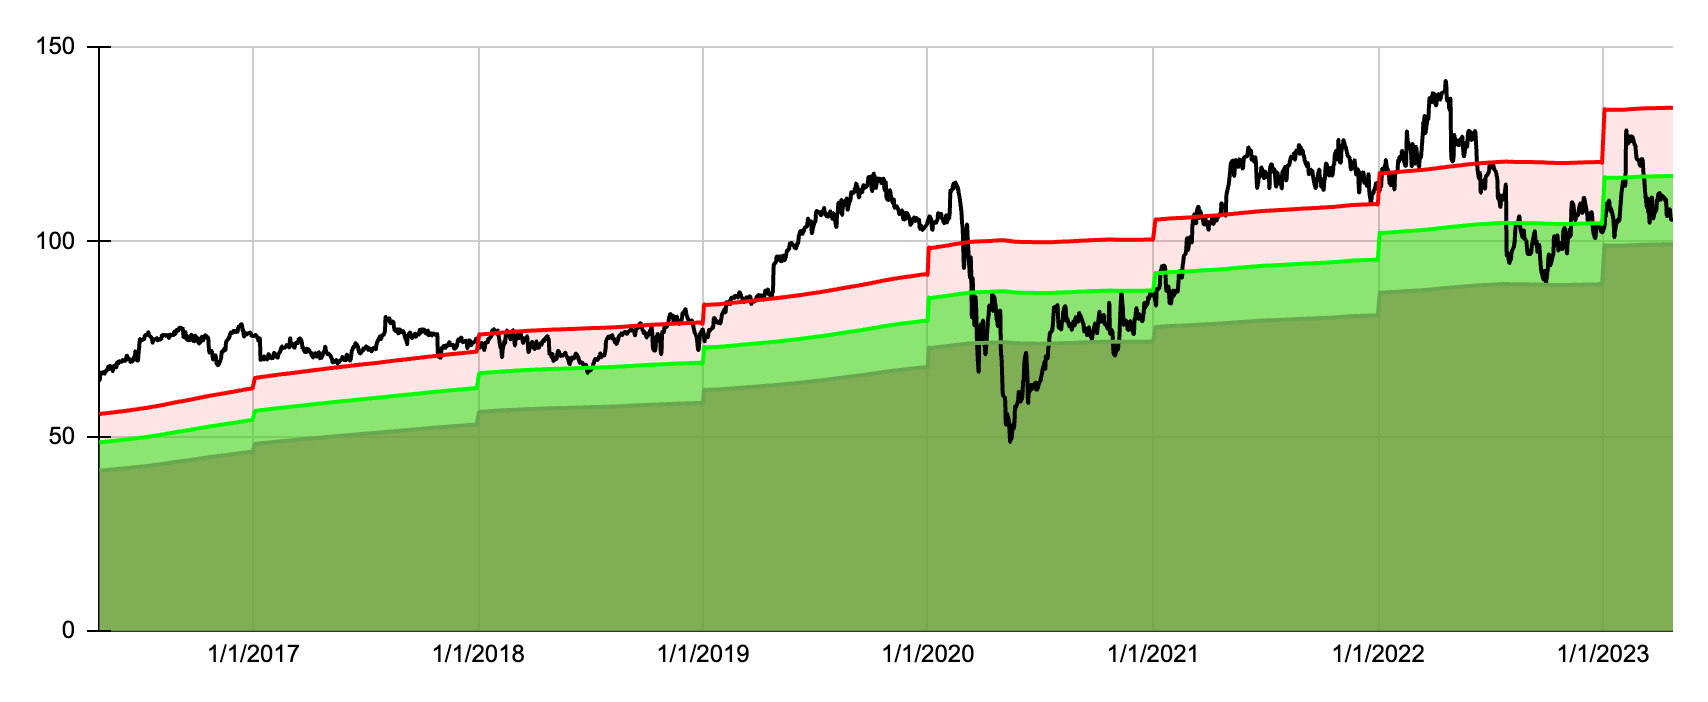
Here is a dividend yield theory chart for Automatic Data Processing ( ADP ).
The average return of investing in the stock on all days when it appeared to be undervalued was 16.07%. The average return of investing in the stock on all days regardless of valuation was 11.51%. And the average return of investing in the stock on all days when it appeared overvalued was 9.56%.
Here is a dividend yield theory chart for Nordson ( NDSN ).
The average return of investing in the stock on all days when it appeared to be undervalued was 11.04%. The average return of investing in the stock on all days regardless of valuation was 8.75%. And the average return of investing in the stock on all days when it appeared overvalued was 8.23%.
Performance Review
The 10 chosen aristocrats for the most undervalued strategy are up 2.96% in April and beating NOBL by 1.44%. The fastest expected growth strategy selections are up 0.90% and trailing NOBL by 0.63%. The blend strategy is up 0.20% and trailing NOBL by 1.32%. The fastest expected growth strategy is off to the best start this year seeing positive gains in all 4 months thus far. The individual selections are also fairing much better than the long-term buy-and-hold portfolios. However, I still believe that a buy-and-hold approach is the optimal investing path to take with these strategies.
Here is a comparison of the buy-and-hold portfolios and the individual monthly selections for each strategy. As you can see the buy-and-hold portfolios are still performing much better than if we bought and sold the 10 chosen aristocrats each month. A buy-and-hold approach is also a much more tax friendly investing strategy.
| Type |
| Most Undervalued |
| Fastest Growth |
| Blended |
| NOBL |
| Individual |
| -2.87% |
| 8.30% |
| 1.96% |
| 2.95% |
| Buy-and-Hold |
| 7.64% |
| 5.01% |
| 3.30% |
| 2.95% |
| O/U |
| 10.51% |
| -3.28% |
| 1.35% |
| 0.00% |
Final Thoughts
I personally believe each of the 3 strategies outlined above can theoretically beat the dividend aristocrat index over a long period of time. These strategies are based on simple principles of valuation and expected returns, and they are easy to understand and implement. Investors should keep in mind that selecting individual stocks carries more risk than investing in an index. The simplest and possibly the safest way to invest in the dividend aristocrats is to purchase shares of NOBL. The fund finished 2021 with a fantastic return, performed much better than the S&P in 2022 and has an annualized rate of return of 10.53% since inception.
The dividend aristocrat data in the images of this article came from my live Google spreadsheet that tracks all of the current dividend aristocrats. Because this data is updated continuously throughout the day, you may notice slightly different data for the same company across the images.
For further details see:
My Best Dividend Aristocrats For May 2023