XOM - My Best Dividend Aristocrats For November 2023
2023-10-31 03:55:15 ET
Summary
- The ProShares S&P 500 Dividend Aristocrats ETF has experienced three consecutive months of negative returns, declining 11.6% since August 2023.
- I present 3 strategies that can theoretically beat the dividend aristocrat index in the long term.
- After 27 months of tracking these strategies, only 1 strategy is beating NOBL but all 3 continue to outperform SPY.
2023 Review
The Dividend Aristocrats have not been a safe haven from the recent market selloff. The ProShares S&P 500 Dividend Aristocrats ETF ( NOBL ) has posted 3 consecutive months of negative returns, inclusive of partial October, declining 11.6% since August 1, 2023. The ETF posted a loss of 2.34% in August, a loss of 5.72% in September and is thus far down 3.99% in October. When will the pain end? Historically November has been the best month for this ETF since its launch in 2013. Out of the past ten Novembers only one ended with a negative return, that was in 2021. On average, the ETF has gained 4.17% during Thanksgiving month, posting its best gains in two of the last three years (obviously not 2021). Obviously just because the dividend aristocrats have historically fared well during November does not mean this year will be the same. Past trends, not based on any fundamental principles, are only true until history breaks them. I don't know what's in store for NOBL in the last two months of 2023, but as of right now the ETF is on pace to have its worst annual return, and for the first time in its short history have two consecutive years of negative returns.
Not all of the dividend aristocrats are sharing the same fate as NOBL. Let's take a look at which individual aristocrats are driving the return in 2023; 32 dividend aristocrats beat NOBL year-to-date through month-end September, and the same number of aristocrats are generating positive total returns this year. These aristocrats are outpacing NOBL after September:
- West Pharmaceutical ( WST ) +59.72%
- Pentair ( PNR ) +45.70%
- W.W. Grainger ( GWW ) +25.36%
- Brown & Brown ( BRO ) +23.25%
- Nucor Corp. ( NUE ) +19.78%
- Ecolab ( ECL ) +17.48%
- A. O. Smith ( AOS ) +17.10%
- Caterpillar ( CAT ) +15.72%
- Linde plc ( LIN ) +15.39%
- Church & Dwight ( CHD ) +14.70%
- Stanley Black & Decker ( SWK ) +14.40%
- Cardinal Health ( CAH ) +14.28%
- Walmart ( WMT ) +14.10%
- Roper Technologies ( ROP ) +12.60%
- S&P Global ( SPGI ) +9.82%
- Exxon Mobil ( XOM ) +9.27%
- Aflac ( AFL ) +8.64%
- Sherwin-Williams ( SHW ) +8.29%
- Cintas ( CTAS ) +7.35%
- Expeditors International of Washington ( EXPD ) +7.27%
- Illinois Tool Works ( ITW ) +6.30%
- Lowe's ( LOW ) +5.89%
- PPG Industries ( PPG ) +4.68%
- Dover Corp. ( DOV ) +4.12%
- Medtronic ( MDT ) +3.39%
- International Business Machines ( IBM ) +3.37%
- Essex Property Trust ( ESS ) +3.33%
- Becton, Dickinson ( BDX ) +2.77%
- Automatic Data Processing ( ADP ) +2.41%
- Emerson Electric ( EMR ) +2.34%
- Cincinnati Financial ( CINF ) +2.04%
- McDonald's ( MCD ) +1.60%
The S&P 500, as measured by SPDR® S&P 500 ETF Trust ( SPY ), was down 4.74% in September, outperforming NOBL during the month. Month-to-date through October 27th SPY is down 3.89%, slightly ahead of NOBL. NOBL beat SPY in 2022 with a loss of 6.5% compared to a loss of 21.65%. SPY started 2023 on stronger footing and is beating NOBL by 12.75% year-to-date. The dividend aristocrats are not known to consistently beat the S&P 500 index, in fact, the dividend aristocrat index underperformed the S&P 500 index for 6 out of the last 8 full calendar years.
However, if you look further back in history, the dividend aristocrat index is outperforming the S&P 500 index by about 2.18% per year between 1990 and 2022. A significant portion of this long-term outperformance is attributable to the dot com bubble and the financial crisis as well as the immediate years following each market crash. This pattern was broken with the 2020 market crash, perhaps the much shorter duration of the crash and recovery are the reason. The dot com bubble and the financial crisis both extended for multiple years while the 2020 market crash was fully recovered in a matter of months. 2022 also proved to be a strong year for the aristocrats as they earned 15.15% of alpha on the S&P, making up for 3 years of underperformance.
Even though the dividend aristocrats have trailed the S&P for the better part of the last 8 years, long-term investors can rest assured that based on history, over a much longer time period, the dividend aristocrats can hold their own. There are currently 67 companies in the dividend aristocrat index but strong historical returns for the index can be attributed to only a handful of them. As an investor, I am always curious how to identify these drivers of outperformance.
I want to present 3 strategies that theoretically could identify winning aristocrats and lead to better performance than the dividend aristocrat index. These strategies work best with a buy and hold long-term investing approach as will be evidenced by the results. They are based on quantitative models that do not consider qualitative data; therefore it is prudent that further due diligence is performed on all chosen stocks.
The Most Undervalued Strategy
Strategy number 1 is a focus on valuation and more specifically it targets the potentially most undervalued dividend aristocrats. In theory, this is a long-term strategy since it may take some time to fully see the reward of leveraging a valuation approach. My preferred method for valuation is dividend yield theory, mainly for its simplicity. Unlike other valuation methods, dividend yield theory does not require making assumptions aside from assuming that a given stock will revert back to its long-term trailing dividend yield.
This valuation technique works best for mature businesses with long histories of dividend growth, making the dividend aristocrats an ideal pool of companies to value using this technique.
Selecting the 10 most undervalued dividend aristocrats each month and adopting a buy and hold investing approach can lead to long-term outperformance when/if the targeted stocks return to fair valuation. It may take a few months or even years to see if this strategy actually pays off. I predict that it will underperform NOBL for the first few months while we wait for bargain stocks to return to fair value.
| Month |
| Most Undervalued |
| NOBL |
| SPY |
| Aug 21 |
| 0.49% |
| 1.87% |
| 2.98% |
| Sep 21 |
| -2.99% |
| -5.69% |
| -4.66% |
| Oct 21 |
| 3.63% |
| 5.95% |
| 7.02% |
| Nov 21 |
| -2.19% |
| -1.76% |
| -0.80% |
| Dec 21 |
| 10.37% |
| 6.54% |
| 4.63% |
| Jan 22 |
| 1.04% |
| -4.08% |
| -5.27% |
| Feb 22 |
| -1.94% |
| -2.59% |
| -2.95% |
| Mar 22 |
| 3.40% |
| 3.86% |
| 3.76% |
| Apr 22 |
| -2.14% |
| -3.42% |
| -8.78% |
| May 22 |
| 3.11% |
| 0.31% |
| 0.23% |
| Jun 22 |
| -7.30% |
| -6.73% |
| -8.25% |
| Jul 22 |
| 5.00% |
| 6.56% |
| 4.55% |
| Aug 22 |
| -3.25% |
| -2.78% |
| -4.08% |
| Sep 22 |
| -11.39% |
| -9.15% |
| -9.24% |
| Oct 22 |
| 10.07% |
| 10.31% |
| 8.13% |
| Nov 22 |
| 6.99% |
| 7.12% |
| 5.56% |
| Dec 22 |
| -5.41% |
| -4.12% |
| -5.76% |
| Jan 23 |
| 4.83% |
| 3.23% |
| 6.29% |
| Feb 23 |
| -3.33% |
| -2.36% |
| -2.51% |
| Mar 23 |
| -0.86% |
| 0.99% |
| 3.71% |
| Apr 23 |
| 3.06% |
| 2.12% |
| 1.60% |
| May 23 |
| -7.87% |
| -5.90% |
| 0.46% |
| Jun 23 |
| 7.17% |
| 8.08% |
| 6.48% |
| Jul 23 |
| 3.27% |
| 2.59% |
| 3.27% |
| Aug 23 |
| -3.82% |
| -2.34% |
| -1.63% |
| Sep 23 |
| -7.37% |
| -5.72% |
| -4.74% |
| Oct 23 |
| -5.07% |
| -3.99% |
| -3.89% |
| 2021 Partial |
| 9.05% |
| 6.54% |
| 9.06% |
| 2022 |
| -3.91% |
| -6.50% |
| -21.65% |
| 2023 |
| -10.71% |
| -4.12% |
| 8.63% |
| TOTAL |
| -6.45% |
| -4.49% |
| -7.18% |
| Alpha over NOBL |
| -1.96% |
| Alpha over SPY |
| 0.73% |
The table above shows the monthly and annual returns for the buy-and-hold portfolio of the most undervalued strategy.
The portfolio trailed NOBL in September by 1.65% and SPY by 2.63%. October thus far is looking just as bad. The portfolio is down 5.07% (price return only) through October 27th, while NOBL is down 3.99% and SPY is down 3.89%. Year-to-date the portfolio is grossly underperforming both NOBL and SPY as the strategy has fallen out of favor this year. Since inception the portfolio trails NOBL by 1.96% but remains ahead of SPY by 0.73%. Not too long ago this portfolio was outperforming both NOBL and SPY by a wide margin.
To be honest I'm not surprised to see this portfolio underperforming currently. The expectation of investing in undervalued aristocrats comes with short-term underperformance as the strategy targets out of favor aristocrats. I still believe that in due time this portfolio will deliver better than average returns and outperform NOBL, while remaining competitive with SPY. During the past few months this strategy has focused on dividend aristocrats that have fallen further and continue to decline faster than the broad market, hence it finds itself underperforming compared to NOBL and SPY.
At its peak, this strategy was ahead of both NOBL and SPY by double digit gains. While such outperformance is not something I am expecting out of this strategy, it has shown merit when stock valuations revert back to historical means.
The portfolio consists of 41 unique present and former dividend aristocrats. I track this portfolio by investing $1,000 each month equally split among the 10 chosen aristocrats for that month. The positions are never trimmed or sold and all dividends are reinvested back into the issuing stock.
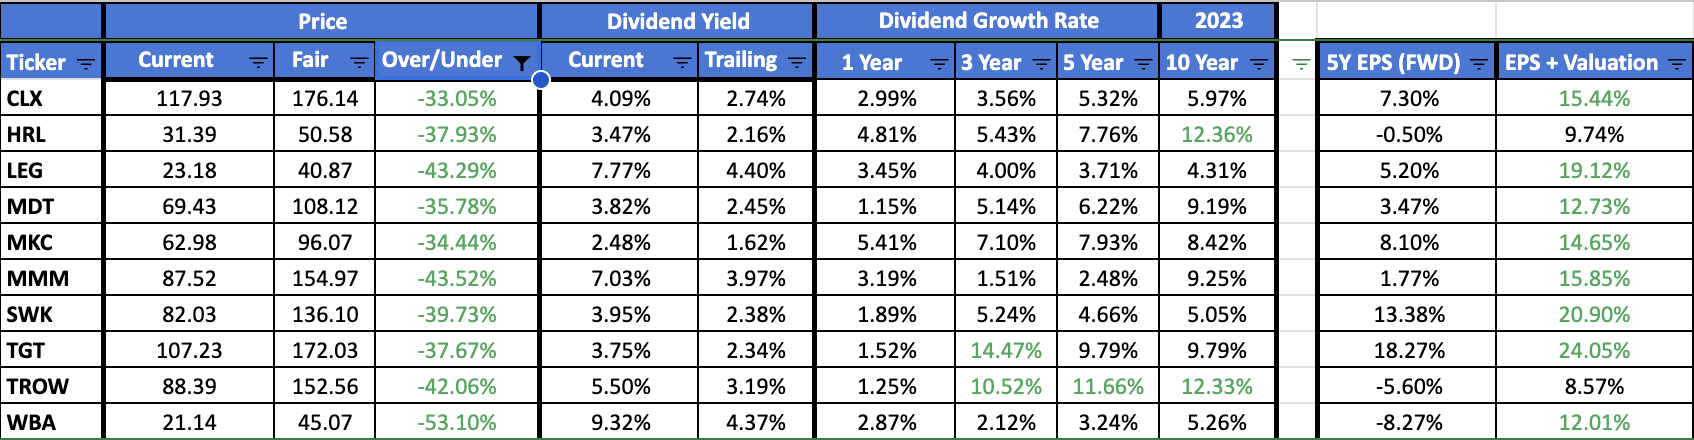
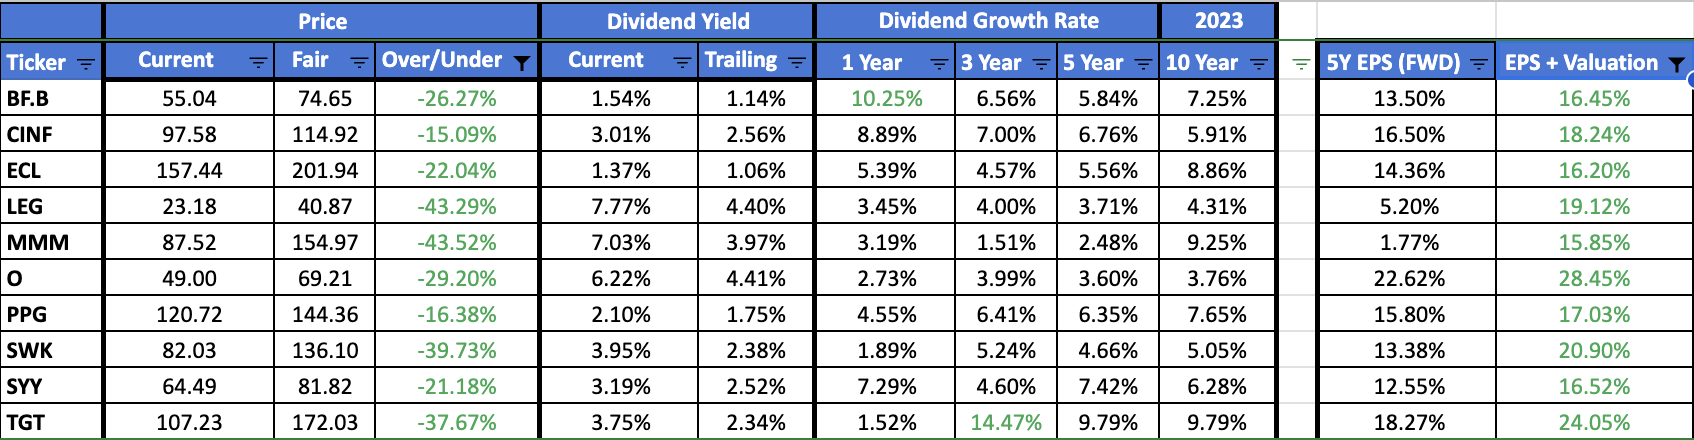
Here are the 10 most undervalued dividend aristocrats chosen for the month of November 2023. The table below shows potential undervaluation (column Over/Under) for each of the 10 chosen aristocrats. The image below is taken from a new spreadsheet I recently created where I am self-computing the 5-year trailing dividend yield. Previously I used Seeking Alpha as a source for the historical yield.
The top 10 list has two changes compared to the prior month. Essex Property Trust ( ESS ) and Realty Income ( O ) drop off and are replaced by Leggett & Platt ( LEG ) and McCormick & Co. ( MKC ).
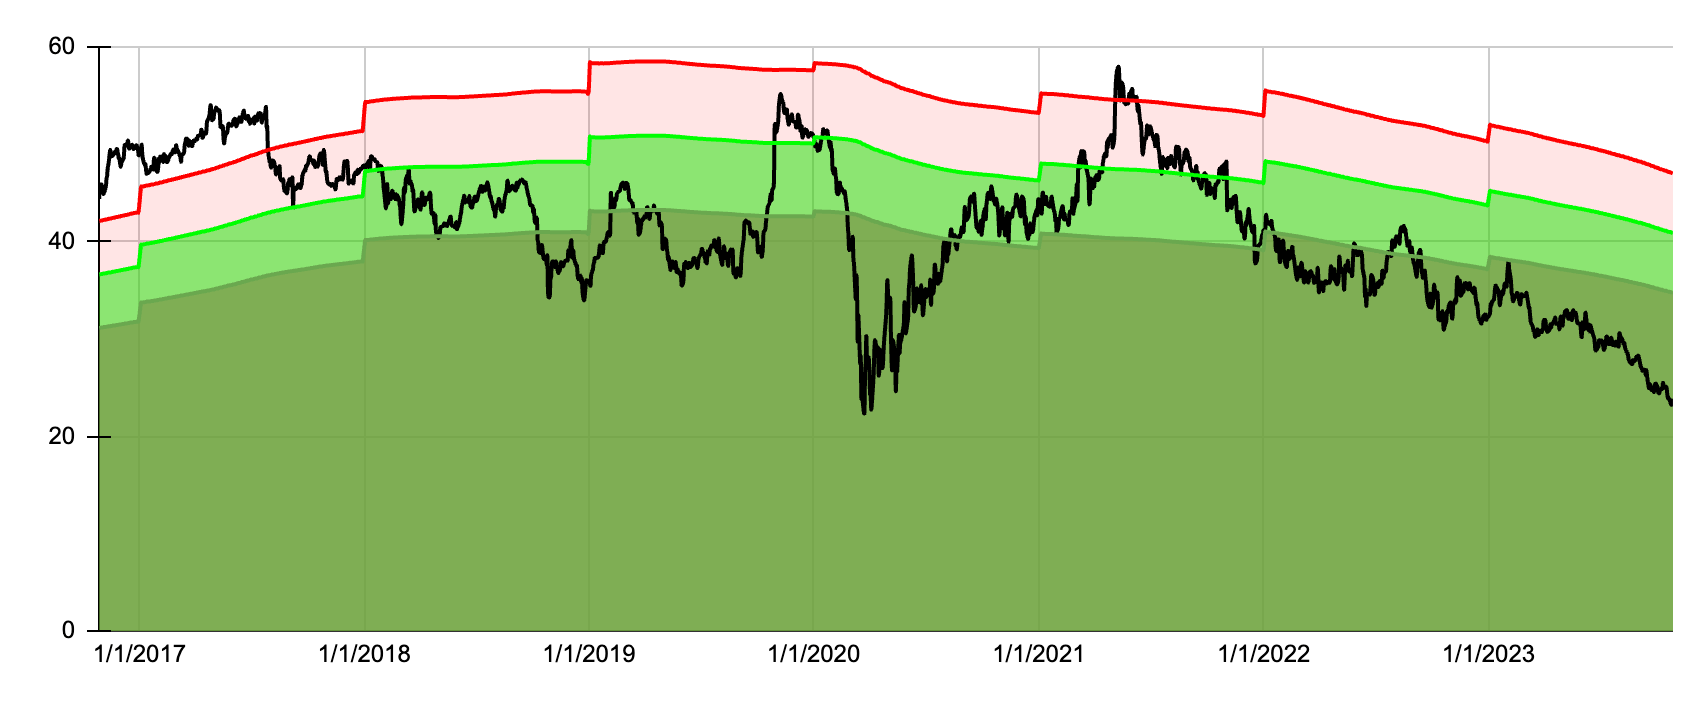
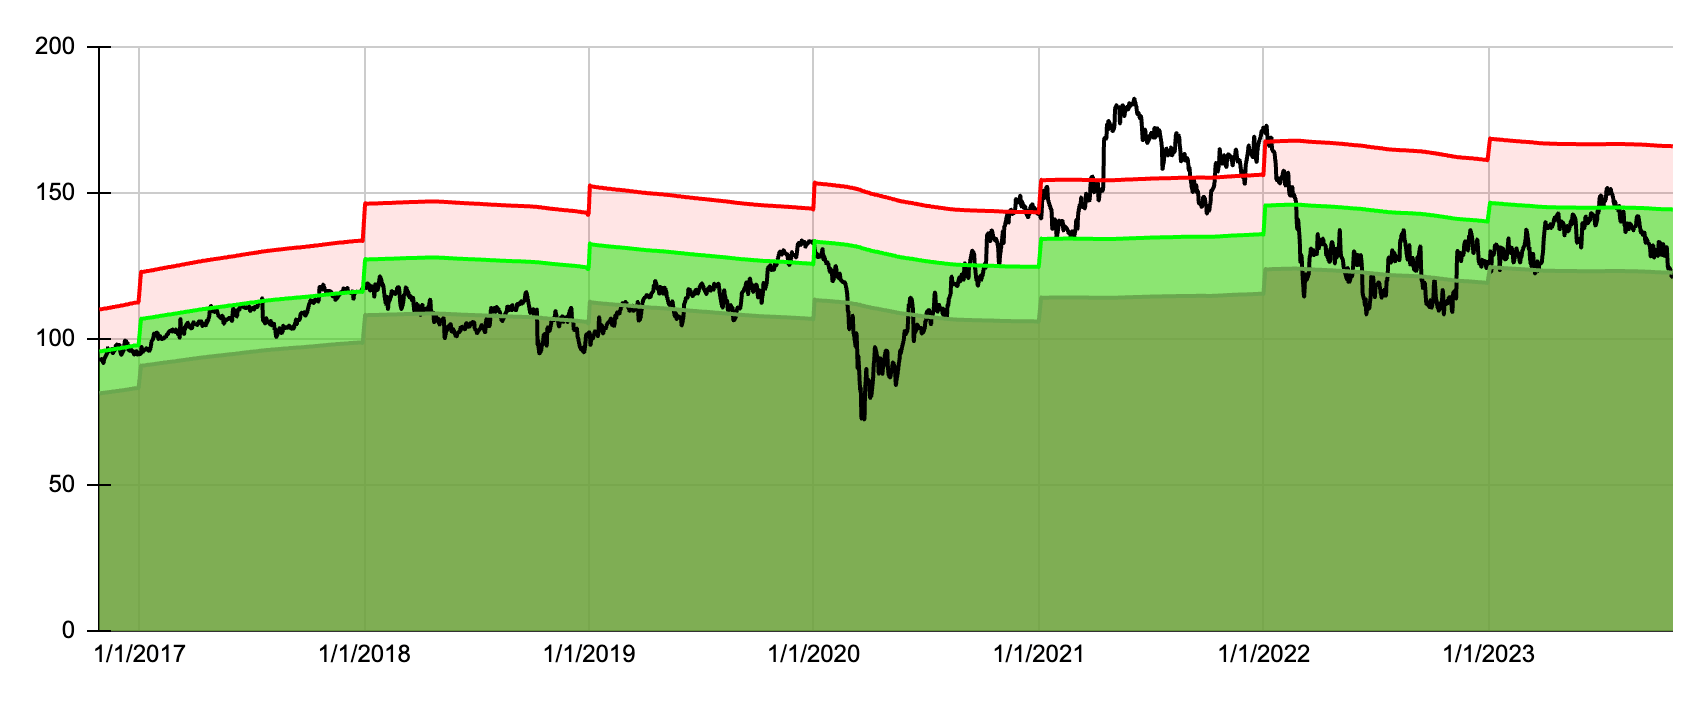
Here is a closer look at Leggett & Platt that looks approximately 43% undervalued.
In the image below the black line is the actual price since September of 2016. The light green shaded area represents a 0 to 15% undervalued zone. The dark green area represents an undervaluation in excess of 15%. The light red shaded area represents a 0 to 15% overvalued zone.
Leggett & Platt has had a rough past three years with the share price declining more than 50%, and currently sitting near its 2020 pandemic crash lows. On the other hand the company has continued to pay and increase its dividend and the dividend yield has progressively inched higher, to a cool 7.77% today. I don't know if the stock has reached its bottom but I think it deserves to be considered if you are a fan of dividend aristocrats.
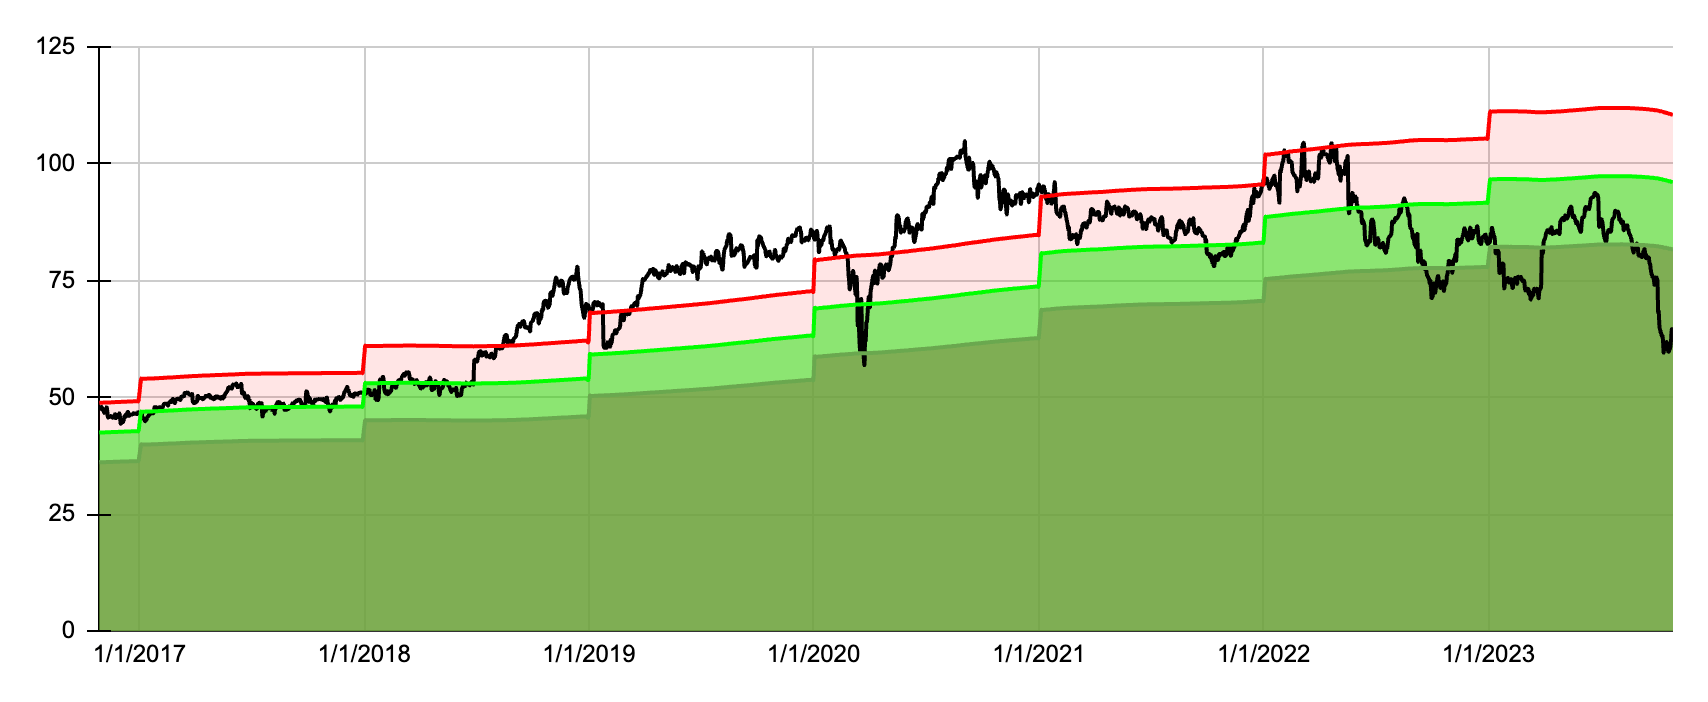
Here is a closer look at McCormick & Co. that looks approximately 34% undervalued.
McCormick & Co. has fallen by about 29% during the last 3 months, significantly more than the average dividend aristocrat. And hence it finds itself amongst the most undervalued aristocrats today. During the last 7 years the stock has trended pretty well along its dividend yield theory chart and only more recently have we seen a divergence from this valuation technique. Similar to Leggett & Platt, McCormick & Co. has continued to pay and increase its dividend and with the latest share price decline its dividend yield has crept up to 2.48%. During the last 7 years McCormick has rarely paid a dividend yield above 2%, today its yield sits very close to its 7-year all time high.
The Fastest Expected Growth Strategy
Strategy number 2 is a focus on dividend aristocrats that are expected to grow the fastest in the near future. Historically, there has been a correlation between earnings per share growth and share price appreciation. Companies that have grown their earnings faster have also seen higher total returns. One way to gauge how fast earnings for a company will grow is to leverage analyst forecasts. For this strategy, I decided to use a discounted five-year EPS growth forecast combined with a return to fair valuation and the dividend yield to identify the 10 best aristocrats poised for the best total return in the future.
| Month |
| Fastest Growth |
| NOBL |
| SPY |
| Aug 21 |
| 5.12% |
| 1.87% |
| 2.98% |
| Sep 21 |
| -4.42% |
| -5.69% |
| -4.66% |
| Oct 21 |
| 5.92% |
| 5.95% |
| 7.02% |
| Nov 21 |
| -2.06% |
| -1.76% |
| -0.80% |
| Dec 21 |
| 7.09% |
| 6.54% |
| 4.63% |
| Jan 22 |
| -4.42% |
| -4.08% |
| -5.27% |
| Feb 22 |
| -0.10% |
| -2.59% |
| -2.95% |
| Mar 22 |
| 3.71% |
| 3.86% |
| 3.76% |
| Apr 22 |
| -2.19% |
| -3.42% |
| -8.78% |
| May 22 |
| 0.12% |
| 0.31% |
| 0.23% |
| Jun 22 |
| -8.94% |
| -6.73% |
| -8.25% |
| Jul 22 |
| 6.09% |
| 6.56% |
| 4.55% |
| Aug 22 |
| -2.69% |
| -2.78% |
| -4.08% |
| Sep 22 |
| -11.37% |
| -9.15% |
| -9.24% |
| Oct 22 |
| 13.68% |
| 10.31% |
| 8.13% |
| Nov 22 |
| 6.14% |
| 7.12% |
| 5.56% |
| Dec 22 |
| -7.53% |
| -4.12% |
| -5.76% |
| Jan 23 |
| 9.41% |
| 3.23% |
| 6.29% |
| Feb 23 |
| -3.01% |
| -2.36% |
| -2.51% |
| Mar 23 |
| -1.79% |
| 0.99% |
| 3.71% |
| Apr 23 |
| 0.37% |
| 2.12% |
| 1.60% |
| May 23 |
| -7.21% |
| -5.90% |
| 0.46% |
| Jun 23 |
| 11.17% |
| 8.08% |
| 6.48% |
| Jul 23 |
| 3.00% |
| 2.59% |
| 3.27% |
| Aug 23 |
| -1.86% |
| -2.34% |
| -1.63% |
| Sep 23 |
| -7.33% |
| -5.72% |
| -4.74% |
| Oct 23 |
| -4.59% |
| -3.99% |
| -3.89% |
| -1.65% |
| -2.63% |
| 2021 Partial |
| 11.62% |
| 6.54% |
| 9.06% |
| 2022 |
| -9.86% |
| -6.50% |
| -21.65% |
| 2023 |
| -3.56% |
| -4.12% |
| 8.63% |
| TOTAL |
| -2.97% |
| -4.49% |
| -7.18% |
| Alpha over NOBL |
| 1.52% |
| Alpha over SPY |
| 4.21% |
The table above shows the monthly and annual returns for the buy-and-hold portfolio of the fastest expected growth strategy.
The portfolio underperformed NOBL by 1.61% in September and SPY by 2.59%. October thus far is looking just as bad, through October 27th the portfolio is down 4.59% (price return only) while NOBL is down 3.99% and SPY is down 3.89%. Year-to-date the portfolio remains ahead of NOBL by 0.56% but trails SPY by more than 12%. However, since inception, the portfolio maintains a modest level of alpha over both, 1.52% over NOBL and 4.21% over SPY.
The fastest expected growth portfolio is currently the best performing of the 3 strategies. At one point it was trailing the most undervalued strategy by a wide margin but 2023 has seen market trends shift in favor of growth stocks. Although a more growth oriented focus doesn't always fair well when the entire market is crashing.
The portfolio consists of 35 unique present and former dividend aristocrats. I track this portfolio by investing $1,000 each month equally split amongst the 10 chosen aristocrats for that month. The positions are never trimmed or sold and all dividends are reinvested back into the issuing stock. People's United was removed from the portfolio in April 2022, as the company was acquired by M&T Bank ( MTB ); the value of the position was reinvested equally amongst the 10 chosen aristocrats for April.
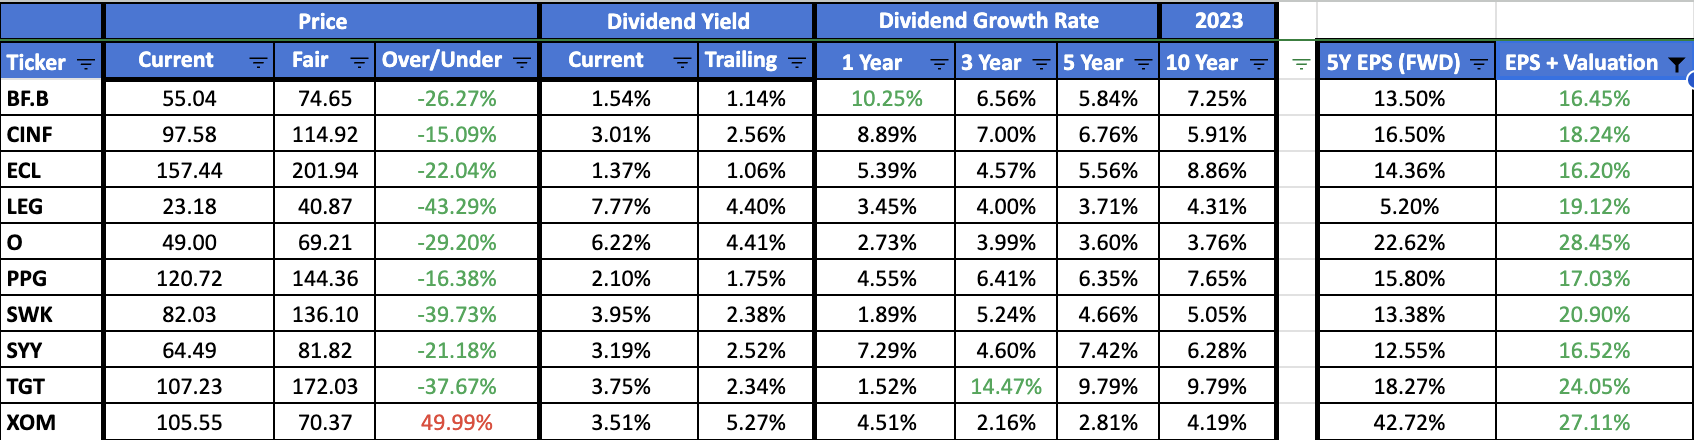
Here are the 10 dividend aristocrats poised for the best total return for the month of November 2023. The table below shows the expected growth rate (column EPS + Valuation) for each of the 10 chosen aristocrats.
The top 10 list has three changes compared to the prior month. Clorox ( CLX ), Essex Property Trust and Walgreens ( WBA ) drop off and are replaced by Leggett & Platt, PPG Industries ( PPG ) and Exxon Mobil ( XOM ).
Here is a closer look at PPG Industries that currently looks approximately 16% undervalued.
The stock has traded sideways since early 2022 with some volatility here and there. Not the ideal price shift for long term investors but on the bright side PPG is faring better than the average aristocrat in 2023. Its current dividend yield of 2.1% is much more favorable compared to the 1.75% average yield it offered during the last 5 years.
Here is a closer look at Exxon Mobil that appears to be about 50% overvalued. Remember this strategy focuses on aristocrats that have the potential to deliver the best returns going forward, not the ones that present the best valuation today.
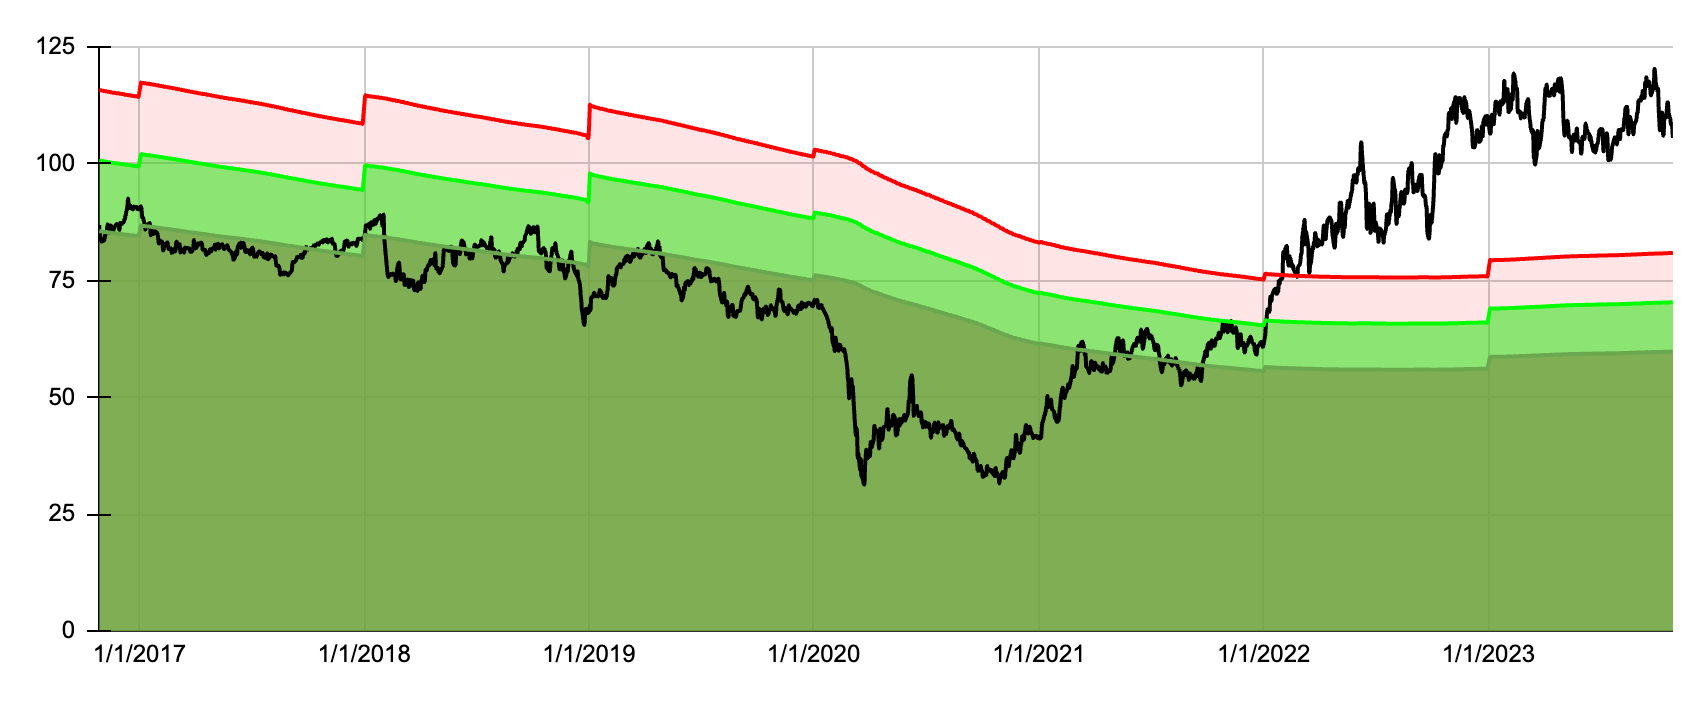
Post pandemic shares of Exxon took off for the moon and they haven't come back to earth yet. More recently the stock has traded sideways but current events in the middle east may present another favorable movement for oil companies. Exxon currently has a dividend yield of 3.51%, which without context looks pretty attractive, but it's actually one of the lowest yields the stock has offered during the last 7 years.
The Blended Strategy
Strategy 3 is a blend of the first two strategies, with a focus on the fastest expected growth but applied only to undervalued aristocrats. A blend of undervaluation and expected growth could narrow down the best aristocrats between the two strategies. The most undervalued aristocrats may not necessarily be poised for the fastest growth. Additionally targeting only undervalued aristocrats can offer a margin of safety in that securities are purchased for fair or better prices.
| Month |
| Blended |
| NOBL |
| SPY |
| Aug 21 |
| 2.64% |
| 1.87% |
| 2.98% |
| Sep 21 |
| -3.42% |
| -5.69% |
| -4.66% |
| Oct 21 |
| 2.70% |
| 5.95% |
| 7.02% |
| Nov 21 |
| -2.56% |
| -1.76% |
| -0.80% |
| Dec 21 |
| 10.07% |
| 6.54% |
| 4.63% |
| Jan 22 |
| -0.71% |
| -4.08% |
| -5.27% |
| Feb 22 |
| 0.49% |
| -2.59% |
| -2.95% |
| Mar 22 |
| 3.48% |
| 3.86% |
| 3.76% |
| Apr 22 |
| -5.04% |
| -3.42% |
| -8.78% |
| May 22 |
| 1.28% |
| 0.31% |
| 0.23% |
| Jun 22 |
| -6.23% |
| -6.73% |
| -8.25% |
| Jul 22 |
| 4.56% |
| 6.56% |
| 4.55% |
| Aug 22 |
| -3.29% |
| -2.78% |
| -4.08% |
| Sep 22 |
| -10.88% |
| -9.15% |
| -9.24% |
| Oct 22 |
| 9.97% |
| 10.31% |
| 8.13% |
| Nov 22 |
| 6.38% |
| 7.12% |
| 5.56% |
| Dec 22 |
| -5.32% |
| -4.12% |
| -5.76% |
| Jan 23 |
| 4.15% |
| 3.23% |
| 6.29% |
| Feb 23 |
| -3.45% |
| -2.36% |
| -2.51% |
| Mar 23 |
| -0.31% |
| 0.99% |
| 3.71% |
| Apr 23 |
| 2.31% |
| 2.12% |
| 1.60% |
| May 23 |
| -6.64% |
| -5.90% |
| 0.46% |
| Jun 23 |
| 8.48% |
| 8.08% |
| 6.48% |
| Jul 23 |
| 3.38% |
| 2.59% |
| 3.27% |
| Aug 23 |
| -2.63% |
| -2.34% |
| -1.63% |
| Sep 23 |
| -7.33% |
| -5.72% |
| -4.74% |
| Oct 23 |
| -3.63% |
| -3.99% |
| -3.89% |
| -1.61% |
| -2.59% |
| 2021 Partial |
| 9.18% |
| 6.54% |
| 9.06% |
| 2022 |
| -7.04% |
| -6.50% |
| -21.65% |
| 2023 |
| -6.63% |
| -4.12% |
| 8.63% |
| TOTAL |
| -5.23% |
| -4.49% |
| -7.18% |
| Alpha over NOBL |
| -0.74% |
| Alpha over SPY |
| 1.95% |
The table above shows the monthly and annual returns for the buy-and-hold portfolio of the blended strategy.
The portfolio trailed NOBL in September by 1.61% and SPY by 2.59%. October thus far is looking a little better, the portfolio is down 3.63% through October 27th while NOBL is down 3.99% and SPY is down 3.89%. Year-to-date the portfolio is down 6.63% and underperforming both NOBL and SPY. Since inception, the portfolio trails NOBL by 0.74%, but remains ahead of SPY by 1.95%.
The blended strategy was an attempt to merge the best of the most undervalued and fastest expected growth strategies. However, thus far it has not shown any promise as it has trailed both strategies pretty much since inception. Perhaps the favorable return in October will be a turning point for this strategy.
The portfolio consists of 40 unique present and former dividend aristocrats. I track this portfolio by investing $1,000 each month equally split amongst the 10 chosen aristocrats for that month. The positions are never trimmed or sold and all dividends are reinvested back into the issuing stock. People's United was removed from the portfolio in April as the company was acquired by M&T Bank; the value of the position was reinvested equally amongst the 10 chosen aristocrats for April.
Here are the 10 dividend aristocrats chosen for the blended strategy for November 2023. The table below shows potential undervaluation (column Over/Under) and the expected growth rate (column EPS + Valuation) for each of the 10 chosen aristocrats.
The top 10 list has three changes compared to the prior month. Clorox, Essex Property Trust and Walgreens drop off and are replaced by Leggett & Platt, 3M Company ( MMM ) and PPG Industries.
Here is a closer look at 3M Company that currently appears to be approximately 43% undervalued.
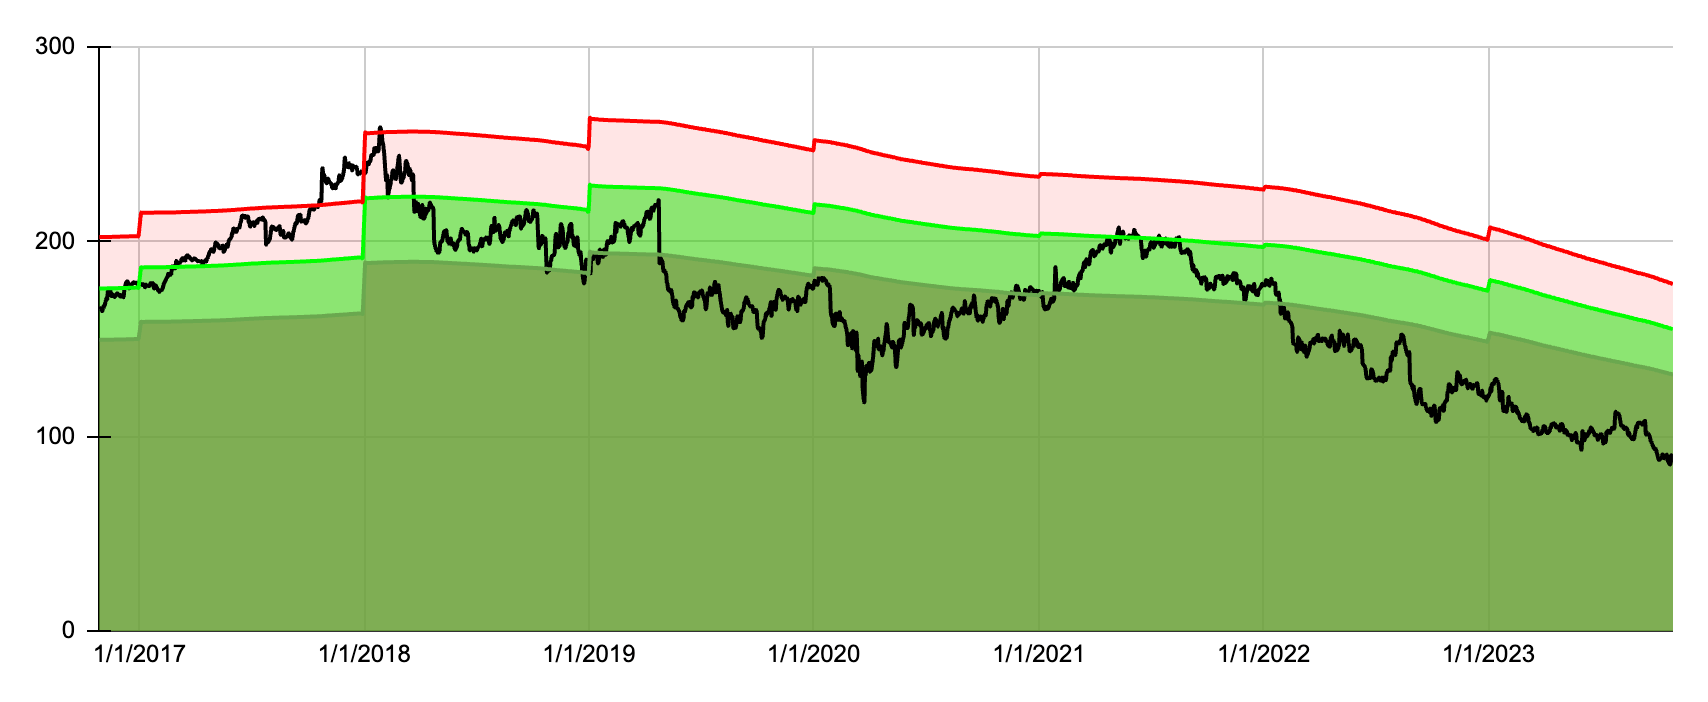
The above chart looks pretty awful as 3M's share price today sits nearly 50% below where it was 7 years ago. The company has struggled with legal issues that have rightfully driven sentiment down. I would certainly advocate that you look past the juicy 7% dividend yield and consider the potential fallout from the pending lawsuits before you add this dividend aristocrat to your portfolio. 3M could turn out to be a wonderful long term play or it could just as easily turn into a value trap.
Performance Review
We have already seen how the buy-and-hold strategies are performing in October so now let's look at how the chosen stocks for the month are doing as well. The 10 chosen aristocrats for the most undervalued strategy are down 5.98%. The fastest expected growth strategy selections and the blended strategy selections for October were the same and both are down 2.65%. The fastest expected growth strategy is off to the best start this year, seeing positive gains in 6 out of the 10 months thus far. The individual selections are also faring much better than the long-term buy-and-hold portfolios, with the year-to-date return being 11.50% through October 27th. However, I still believe that a buy-and-hold approach is the optimal investing path to take with these strategies.
Here is a comparison of the buy-and-hold portfolios and the individual monthly selections for each strategy. As you can see the buy-and-hold portfolios are still performing much better than if we bought and sold the 10 chosen aristocrats each month. A buy-and-hold approach is also a much more tax-friendly investing strategy.
| Type |
| Most Undervalued |
| Fastest Growth |
| Blended |
| NOBL |
| Individual |
| -16.16% |
| 2.57% |
| -5.08% |
| -4.49% |
| Buy-and-Hold |
| -6.45% |
| -2.97% |
| -5.23% |
| -4.49% |
| O/U |
| 9.71% |
| -5.54% |
| -0.15% |
| 0.00% |
Final Thoughts
I personally believe each of the 3 strategies outlined above can theoretically beat the dividend aristocrat index over a long period of time. These strategies are based on simple principles of valuation and expected returns, and they are easy to understand and implement. Investors should keep in mind that selecting individual stocks carries more risk than investing in an index. The simplest and possibly the safest way to invest in the dividend aristocrats is to purchase shares of NOBL. The fund finished 2021 with a fantastic return, performed much better than the S&P in 2022 and has an annualized rate of return of 9.76% since inception.
2023 is shaping up to be an interesting year for dividend strategies. The S&P 500 had a very poor return in 2022 and seemed to be bouncing back this year, not so much since August but the index remains positive year-to-date. Dividends aristocrats fared much better in 2022 but got off to a poor start this year. Dividend investing is a marathon, not a sprint and you will find yourself in a slow period from time to time. The best course of action is to stick with your long-term strategy so long as it still fits your long-term objectives.
The dividend aristocrat data in the images of this article came from my live Google spreadsheet that tracks all of the current dividend aristocrats. Because this data is updated continuously throughout the day, you may notice slightly different data for the same company across the images. Also some of my returns may be off by a few basis points from those you'll see from other sources on the web.
For further details see:
My Best Dividend Aristocrats For November 2023