SHEL - My Dividend Stock Portfolio: New September Dividend Record - 98 Holdings With 22 Buys
2023-10-18 08:15:00 ET
Summary
- The S&P 500 and Dow Jones Industrial Average saw sharp losses for the month and the quarter.
- Interest rates were kept steady in a range of 5.25% to 5.5%, and it is uncertain if 2023 will see yet another hike.
- Net investments of around $1,500 in September, primarily targeting the financial sector and high-yielding BDCs.
- Dividend income hit a September record of $939, up 28% annually, with the goal of adding at least $100 in forward dividend income every month hit.
- Gifted Working Time in 2023: Around 241 hours or 30 days of active work have been replaced with passive income in 2023, equivalent to 6 weeks of work.
The market saw sharp losses for the trading month and quarter. The S&P 500 finished the month down 4.9% and dropped 3.7% for the quarter. The Nasdaq Composite was off 5.8% in September, and down 4.1% for the quarter. Both posted their worst months this year. The Dow notched a 3.5% decline last month and a 2.6% fall for the quarter.
Interest rates remained in that 5.25% to 5.50% and it is very unclear if there will be yet another hike this year or if that level marks the peak of the cycle.
There is still some doubt regarding a soft landing, but, in my opinion, there won't be any type of recession (at most a technical one) and if it will be as short-lived as the brief 2022 bear market in stocks, which, in my opinion, was also a non-noteworthy event.
Portfolio Changes in September
Investment activity in September slightly retreated from August levels and came in at around $1,500. I remained busy deploying dividends, income and capital earned in August as well as additional income from other sources. Unfortunately, the markets are pushing my favorite BDCs higher almost every single day, but there are still some 10%+ dividend yields available and ready to be taken. As a result, buying opportunities continue to fade, but even with lower yields, I still very much favor BDCs and won't stop buying.
September was a pretty scary month for two of my holdings with W.P. Carey announcing a surprising and swift spin-off of its entire office portfolio with the goal to rerate the company's valuation higher. However, the market absolutely did not like that move and while the rerating took place it led to a much lower valuation while dividend uncertainty remains. I haven't sold a share but I have become more cautious now and will carefully monitor the situation, i.e. especially W.P. Carey's next earnings release, its commentary and the two next dividend declarations.
The next stock which got absolutely annihilated by the market is NextEra Energy Partners (NEP) and its parent NextEra Energy (NEE), although the latter to a lesser but still vicious degree. The reason here was NEP's announcement that it will lower its long-term earnings and distribution growth amid higher for longer interest rates and NEP's leveraged and unfavorable cost of capital structure. I am still trying to understand what happened here and why this led the market to cut the stock's price more than in half and I am awaiting management commentary on the next earnings call to gain more visibility. As far as its parent NextEra Energy is concerned, I consider this a fantastic buying opportunity in the long-term and will try to nibble a couple of shares in the $50s.
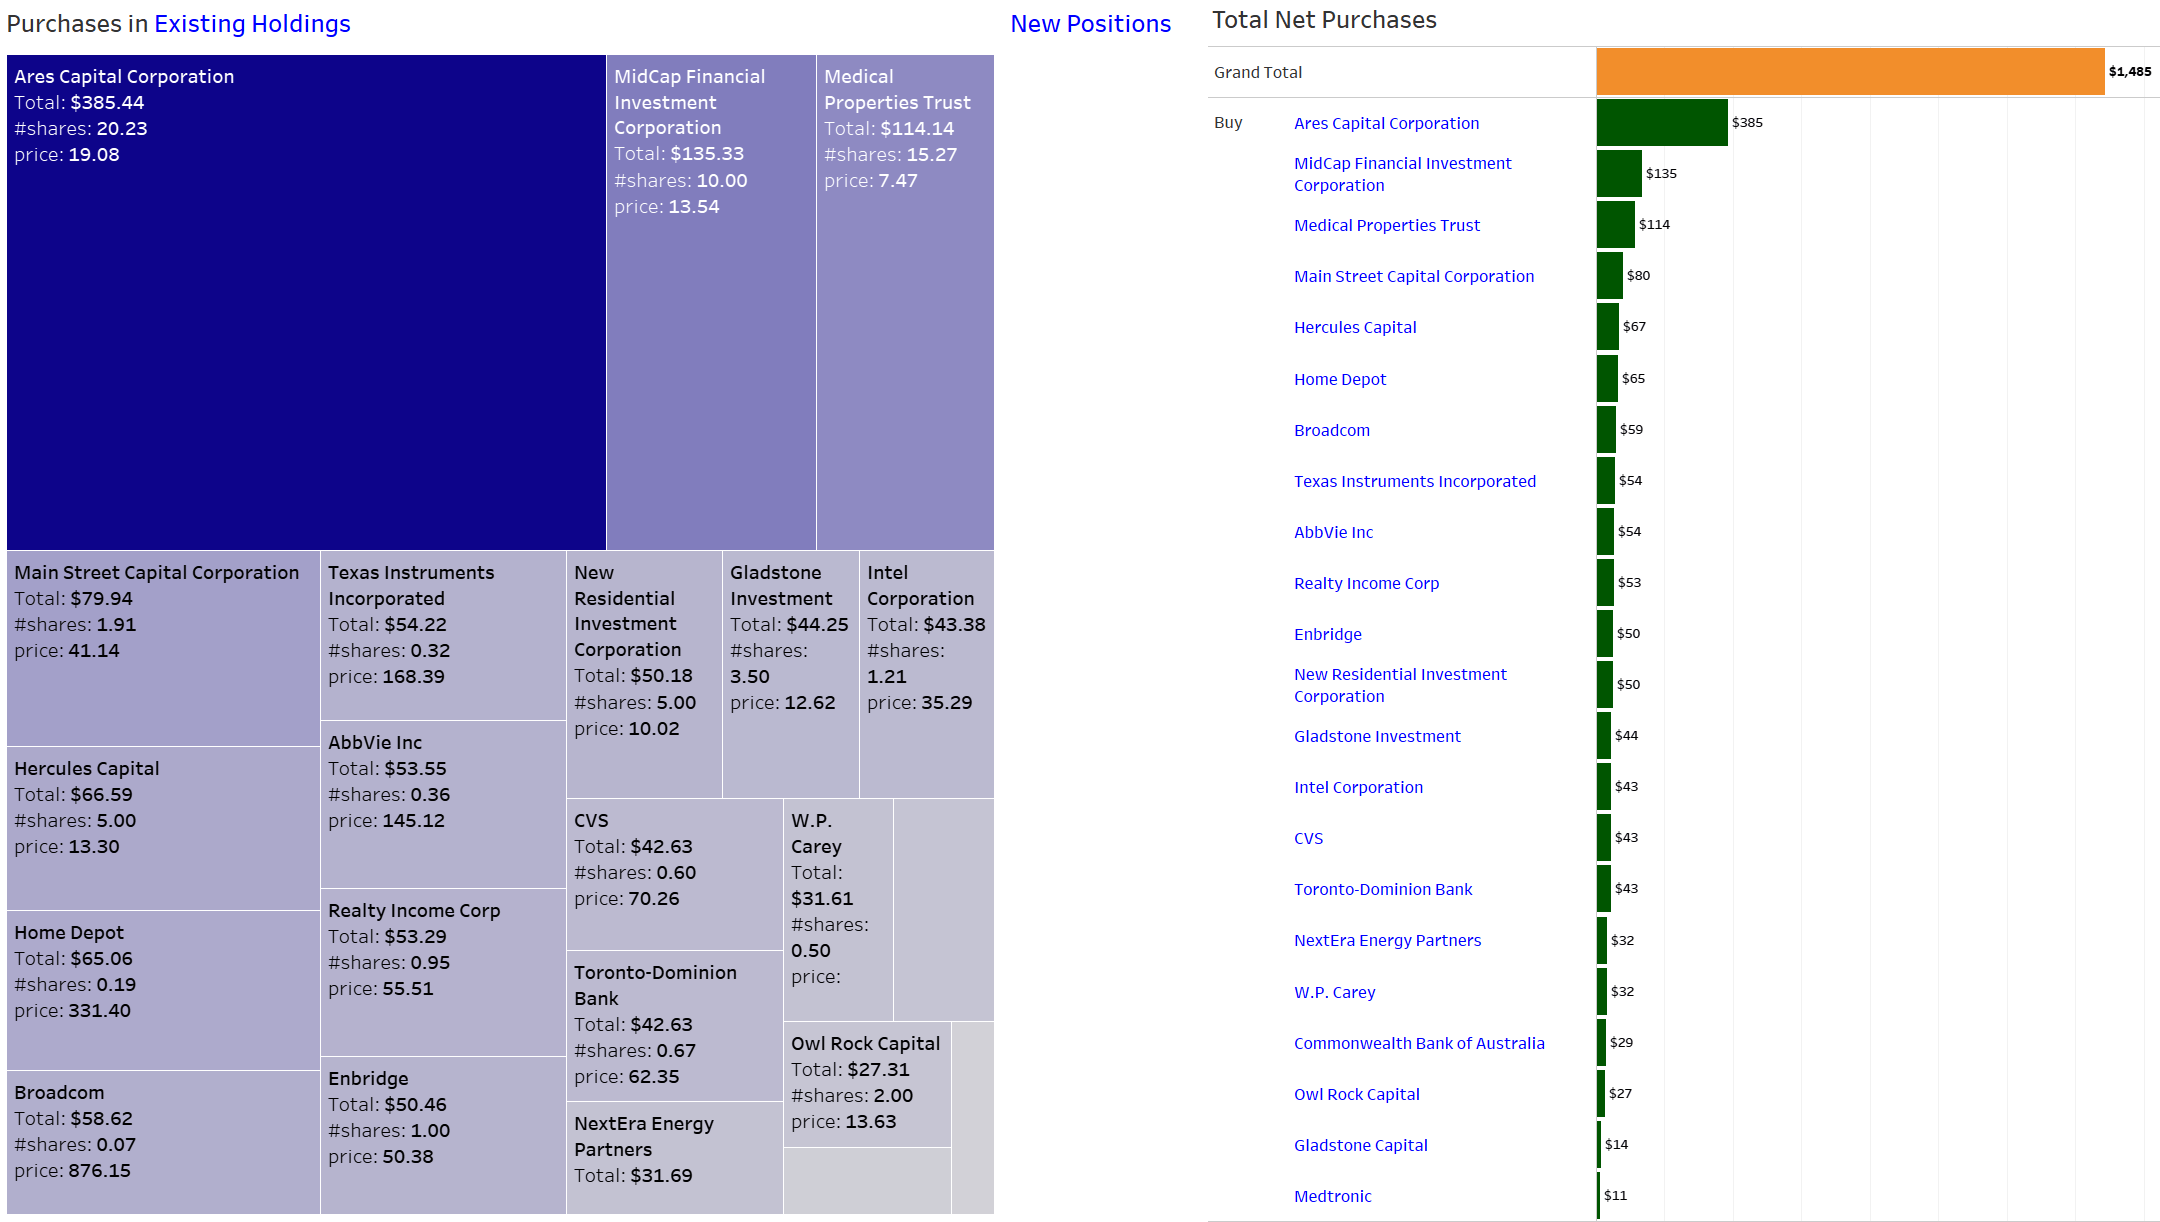
My biggest purchase in September 2023 were several small transactions to acquire more shares of Ares Capital ( ARCC ) which remains my #1 dividend payer in the entire portfolio and that has now led to record dividend income in September. Similarly, I made several investments into Hercules Capital ( HTGC ), MidCap Financial Investment Corporation ( MFIC ) and Main Street Capital Corporation ( MAIN ).
I also continue to like Rithm Capital Corp. ( RITM ) and Gladstone Investment ( GAIN ). Most of the BDCs I am invested in are on fire this year easily outperforming the S&P 500 while at the same time providing double-digit or close to double-digit yields.
Overall, I did manage to add $108 in forward annual dividend income this month, which brings YTD added annual dividend income to more than $1,200 already. My goal is to be able to add at least $100 in forward dividend income every month and as things are developing right now, this is a very reasonable and realistic target to achieve and overachieve as long as BDCs remain part of my asset allocation.
All these purchases break down as follows:
Added Dividend Income (Designed by author)
All net purchases in September can be found below:
Net Purchases in September (Designed by author)
Dividend Income September 2023
Dividend income hit a new blistering September record of $939. This represents growth of 28% Y/Y and 14% sequentially. These figures are more than impressive to me, but the September 2023 dividend income benefits from the sizable semi-annual dividend payment of the Commonwealth Bank of Australia (CBAUF) which more than offsets the dividend from ZIM Integrated Shipping Services (ZIM) in March 2023 as well as those annual dividends paid in June 2023 from Daimler Trucks and Vonovia. Accounting for these factors, Y/Y dividend income rose by 31% and by 7% sequentially..
Disregarding special dividends, on an annual basis, the biggest income driver is by far Ares Capital, a stock I am running at minimum on a bi-weekly savings plan (but most of the time I am buying stock at least once per week) and where my contributions quickly translated into meaningful dividend income. Dividends from Ares are now quickly approaching the next big psychologically milestone of $200 with this quarter's dividend income already amounts to $175. Dividend income from MFIC is also rising quickly - although not on the same level as that from ARCC - and has now passed $50.
Similarly striking is that net dividends from monthly dividend payers have now comfortable cleared the $100 level thanks to the big supplemental dividends from Main Street Capital ( MAIN ) and Gladstone Investment ( GAIN ). I am buying more shares of MAIN, GAIN, GLAD and O every month and thus that monthly dividend income level will continue to rise month after month although the months where the big supplemental dividends hit are truly something special.
September 2023 Dividend Income (Designed by author)
The dividend income from my top-3 regular dividend payers in September continues to grow and has pushed the YTD average to a staggering $254 which literally exploded compared to the year-ago YTD value of just around $128.
All this is depicted below:
Top 3 Dividend Payers (Designed by author)
Here is a chart that shows the development of my net dividend income by month over time between 2015 and 2023. You can see the growth of my dividend income and the average annual dividend for each year:
All-time Dividend Development (Designed by author)
This chart is my favorite because it illustrates the progression of my dividend income over time and allows me to easily see the average annual dividend for each year.
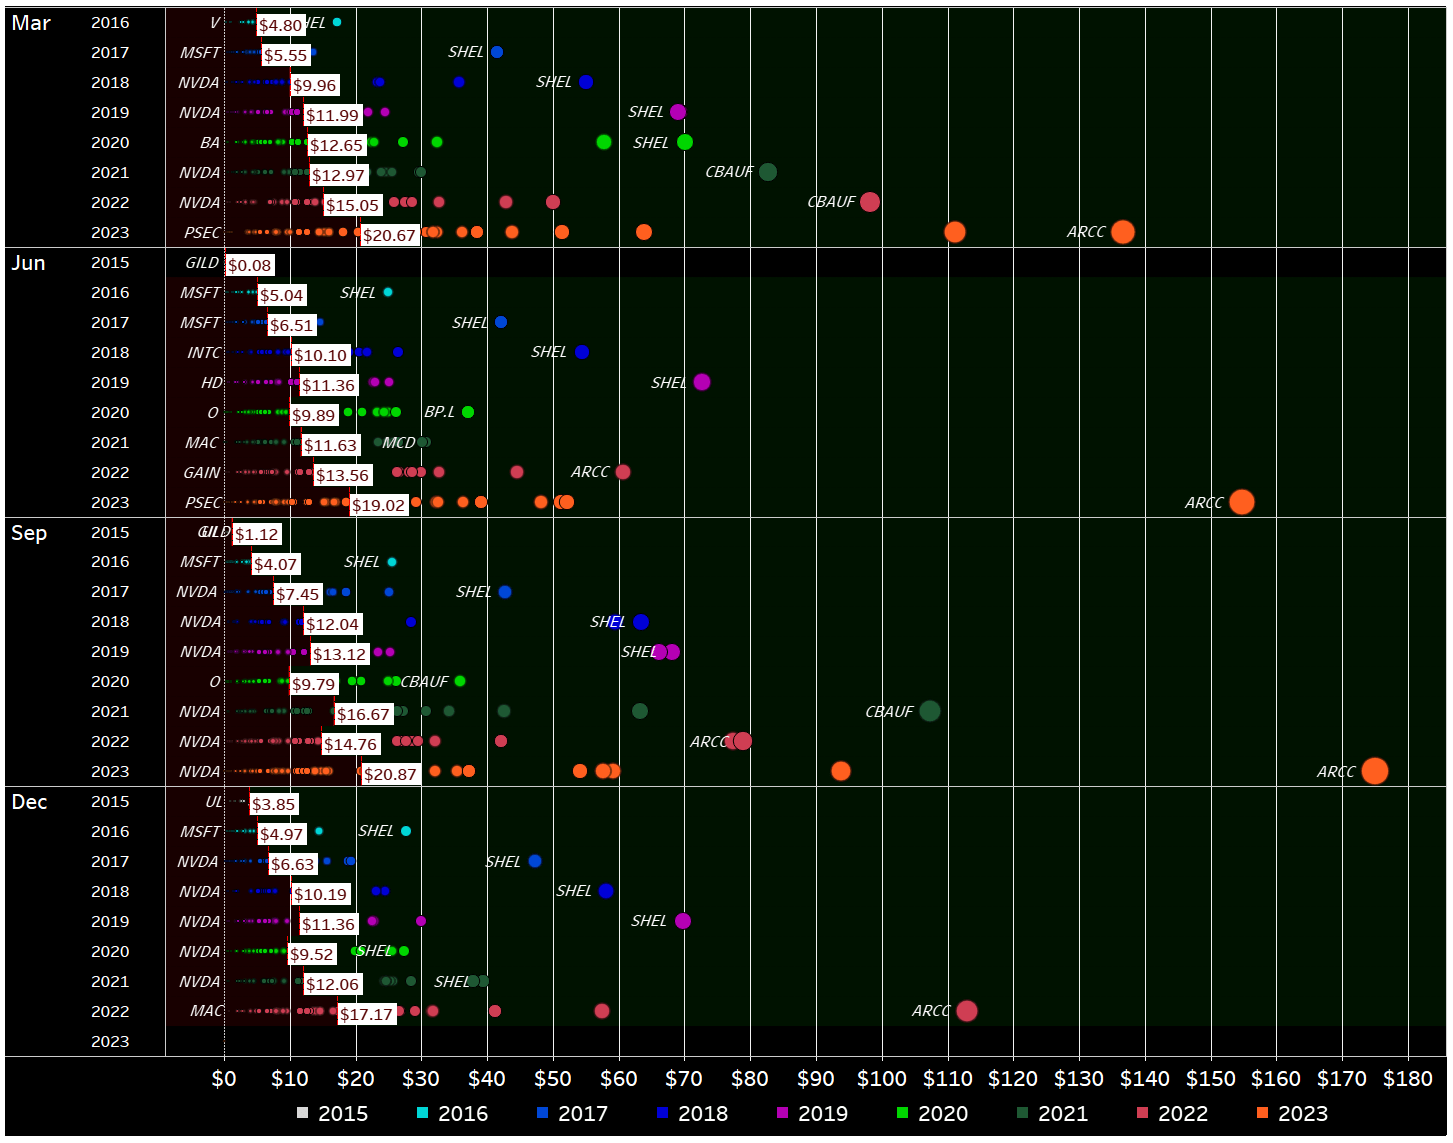
Next, I have plotted all of the individual dividend payments I have received, coloring them by year and arranging the years side by side instead of horizontally as in previous updates. This visualization allows for a more comprehensive analysis of the distribution of my dividend payments over time.
Dividend Payment Bubbles (Designed by author)
By plotting the data in this way, we can easily see the distribution of dividend payments across different years and gain insights into the overall growth of my dividend income over time.
This visualization is initially quite cluttered, but it contains a wealth of information. It shows every individual dividend payment I have received since I began my investment journey in 2015, represented as a circle that is colored and sized according to its contribution. The view is organized by month and year, allowing for a more comprehensive analysis of the development of my dividend income over time. For each year and month, a white rectangle indicates the average monthly dividend. The area where dividends fall below the average is filled in dark red, while the area above the average is colored dark green. I greatly prefer this redesigned version of my old "bubbles chart" because it makes it much easier to identify trends and developments in my dividend income. This type of data visualization allows for a detailed examination of the distribution of my dividend payments over time and enables me to more easily identify trends and patterns in my income growth.
September 2023 Dividends (Designed by author)
Now zooming in on September , we can immediately see a number of big green circles in a sea of black. The bigger the circle and the bigger the distance to the previous circle for the same stock, the bigger is the change in dividend income compared to the prior years.
The importance of Ares Capital Corporation is clear, with a reddish circle indicating the massive jump in dividend income over the last 12 months due to heavy ongoing monthly investments and I have no plans to stop these monthly savings plans. By the end of the year, December 2023 dividends could potentially hit $200 or even more.
Apart from that when it comes to the dividends for 2023, I notice mostly orange circles at the top of the scale, which is exactly what I want to see. These big orange circles represent a rising dividend income, and my goal is to have as many of them as possible at the top of the chart.
Overall, my aim is to observe numerous large orange circles positioned at the highest point on the scale. This signifies a positive trend of increasing dividend income, which is precisely what I'm striving for.
Another way to express the monthly dividend income is in terms of Gifted Working Time (GWT). Assuming an average hourly rate of $32.34 for 2023, my GWT and annual net dividends have been as follows:
- 2018: 121 hours GWT, $3,000 in annual net dividends
- 2019: 142 hours GWT, $3,600 in annual net dividends
- 2020: 152 hours GWT, $3,800 in annual net dividends
- 2021: 180 hours GWT, $5,050 in annual net dividends
- 2022: 229 hours GWT, $6,400 in annual net dividends
- 2023: Targeting at least 216 hours GWT, $7,000 in annual net dividends
I expect overall GWT to decrease in 2023 due to higher calculated hourly rates, as I project a 10% increase in the hourly rate due to inflation.
The overall target for the year with $7,000 in annual net dividends is very conservative, but I expect that I will have to take out some risk from my portfolio as mentioned above. Also, the stronger euro (I am receiving dividends in EUR and then converting those to USD at current exchange rates for these updates) will have an adverse impact. Still, as the year unfolds, I expect to be able to pass that target and potentially even reach my next milestone of $8,000 as well. By the end of September 2023, my realized dividend income has been blowing away my expectations by several dimensions with YTD net dividend growth coming in at a sizzling and unsustainable 41% Y/Y (down only 1pp from August). I am still surprised that with 75% of the year in the bag that growth rate remains that high and that obviously means that next year the growth rates will be substantially lower. Also, that growth should also come down to at least the mid-30s by the end of the year, but given I am only targeting a low single-digit growth rate, it is already clear that barring a major disaster I will easily achieve a double-digit growth rate in dividend income, which is fantastic and should thus easily smash my original target of $7,000 in annual net dividends. By the end of September net dividends have already reached $6,700 and thus it is very possible that I might even clear $8,000 already this year.
Across the years, my YTD Dividend Race has been as follows:
- 2018: Disappointing
- 2019: Phenomenal, benefiting from a low baseline in the prior year
- 2020: Fairly disappointing
- 2021: Phenomenal
- 2022: Much better than expected fueled by the very weak euro
- 2023: Targeting a conservative low single-digit growth rate (the more likely scenario is now a 10-15% increase in dividend income, possibly even 20%+)
YTD Dividend Growth (Designed by author)
I have updated the YTD Dividend Race chart to show the development of YTD dividend income on a daily basis, allowing us to see that most of my dividend income is generated mid-month and towards the end of the month. The chart also breaks down the development by month for the current year, making it easy to identify significant jumps in income.
YTD Dividend Race (Designed by author)
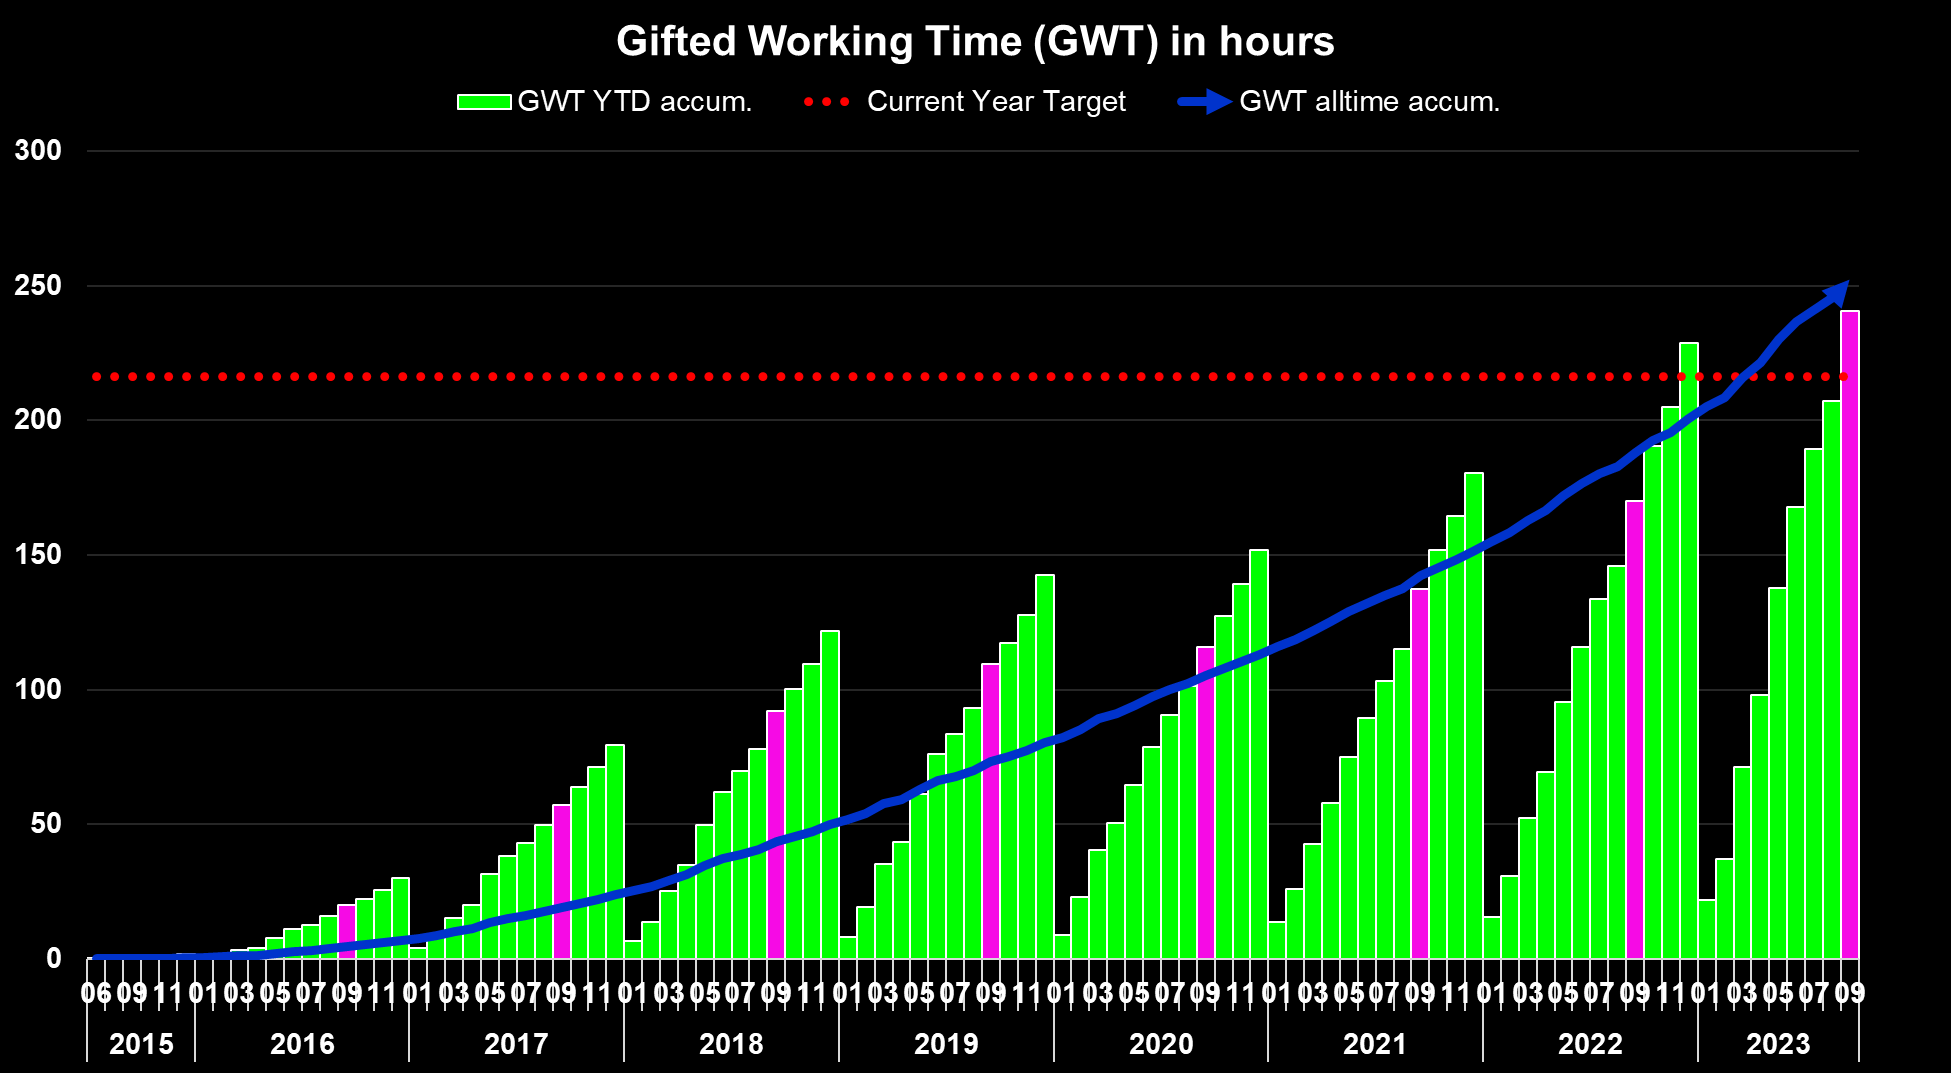
Expressed in GWT, it presents itself as follows:
Gifted Working Time in Hours (Designed by author)
What this shows is as follows:
- All time (blue area) - Around 1,177 hours, or 147 days, of active work have been replaced with passive income since the start of my dividend journey. Assuming a five-day workweek, this translates into more than 29 weeks of vacation funded via dividends, which itself is equal to more than half a year in total.
- Full-year 2023 (green bars) - Around 241 hours, or 30.0 days, of active work have been replaced with passive income in 2023 already, which is basically equivalent to six full-time working weeks funded with dividends, or to put differently, the YTD dividends have so far provided me with around 1.5 extra monthly salaries and if this trend continues, it will accumulate to over two monthly salaries by year-end even though the second part of the year is expected to be weaker than the first half due to the volume of annual dividend payers in Q2.
- Highlighted in pink is the accumulated YTD total at the end of the current reporting month ( September ).
This visualization allows us to see the overall impact of my dividend income on the amount of active work I am able to replace with passive income. It also enables us to see the progress made year-to-date, as well as the accumulated total at the end of the current reporting month.
Upcoming September Dividends
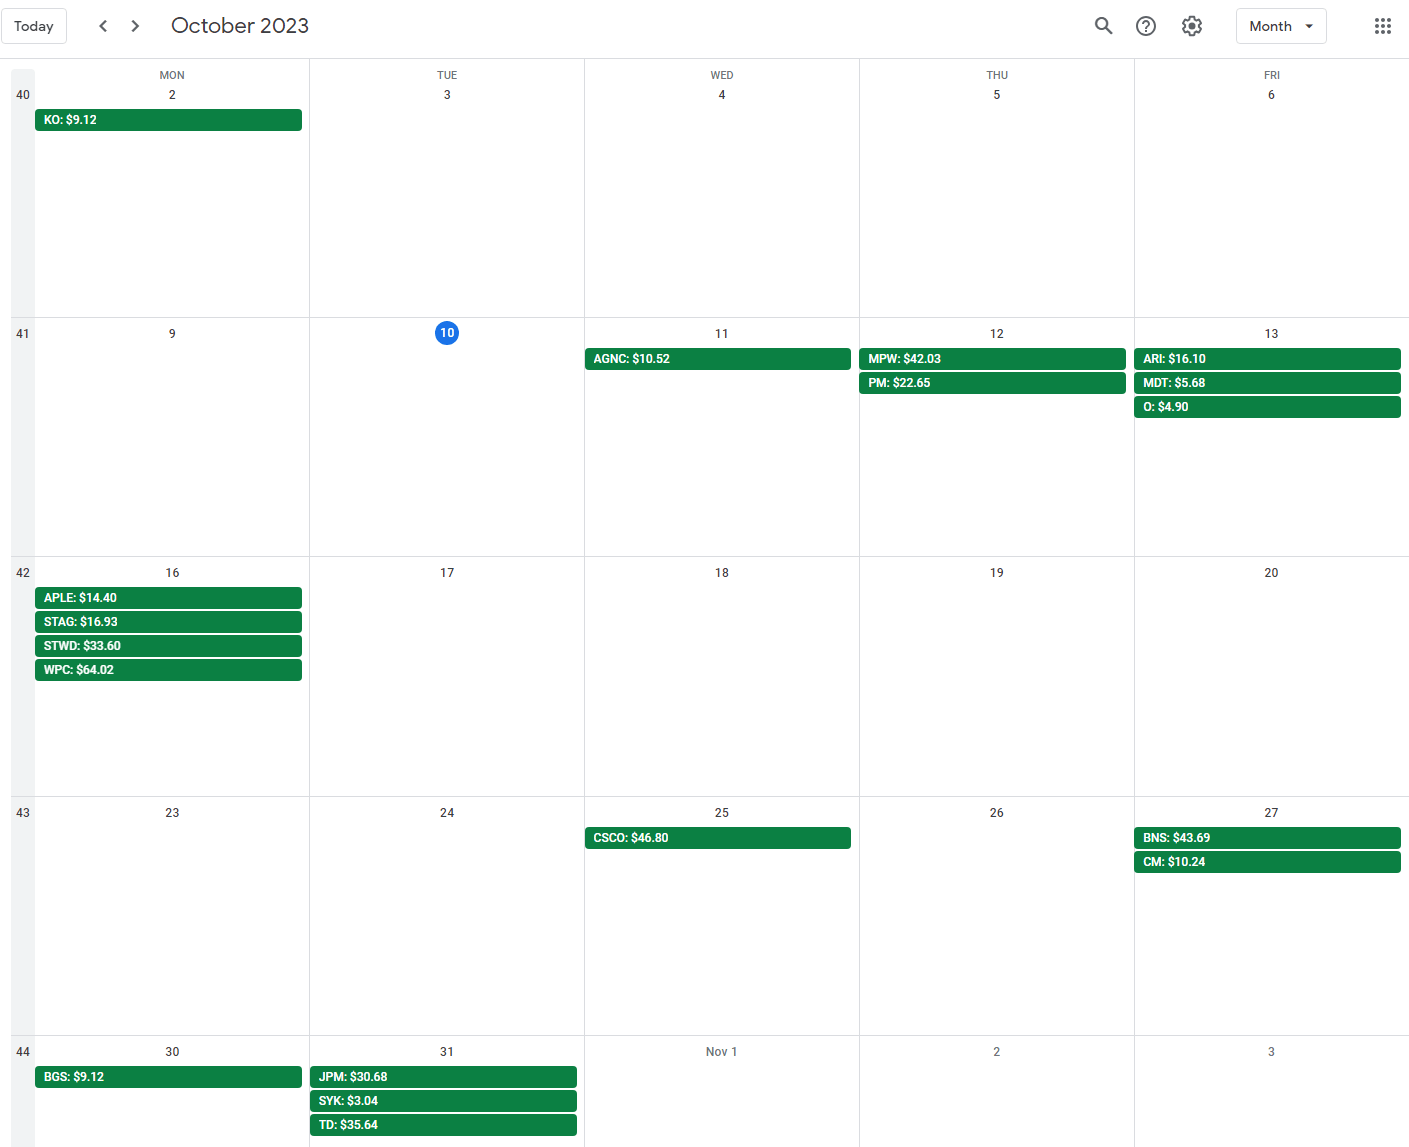
As every month, April is packed with dividend payments heavily concentrated around the 15th and at month-end when the dividend checks from Canada's big banks as well as JPMorgan will be arriving over a period of just 3-4 days.
Given the majority of my savings plans feature companies that pay dividends in January such as W. P. Carey, Altria ( MO ), Cisco Systems ( CSCO ), JPMorgan, Toronto-Dominion Bank, Bank of Nova Scotia, Stryker ( SYK ), Medtronic ( MDT ) as well as ongoing investments into stocks like Rithm Capital and Annaly Capital ( NLY ), it surely is going to be a big month that should easily set a new all-time dividend record for the month of April.
The snapshot below is taken from my free-for-all released Dividend Calendar (make sure to follow instructions in the video) and shows my expected dividend payments in October.
My Dividend Calendar (Designed by author)
At the end of September, my dividend portfolio is composed as follows:
| Apple Inc. |
| ( AAPL ) |
| 11.88% |
| 24,988 |
| Visa Inc |
| ( V ) |
| 4.33% |
| 9,102 |
| Microsoft Corporation |
| ( MSFT ) |
| 3.85% |
| 8,101 |
| AbbVie Inc |
| ( ABBV ) |
| 3.75% |
| 7,895 |
| Ares Capital Corporation |
| ( ARCC ) |
| 3.36% |
| 7,061 |
| McDonald's Corp |
| ( MCD ) |
| 3.32% |
| 6,992 |
| NVIDIA Corporation |
| ( NVDA ) |
| 3.23% |
| 6,796 |
| Cisco Systems, Inc. |
| ( CSCO ) |
| 2.92% |
| 6,134 |
| Commonwealth Bank of Australia |
| ( CBAUF ) |
| 2.36% |
| 4,971 |
| Main Street Capital Corporation |
| ( MAIN ) |
| 2.31% |
| 4,864 |
| Shell |
| ( SHEL ) |
| 2.26% |
| 4,756 |
| STAG Industrial Inc |
| ( STAG ) |
| 2.24% |
| 4,713 |
| Johnson & Johnson |
| ( JNJ ) |
| 2.23% |
| 4,697 |
| JPMorgan Chase & Co. |
| ( JPM ) |
| 1.96% |
| 4,132 |
| AT&T Inc. |
| ( T ) |
| 1.86% |
| 3,906 |
| Allianz SE |
| ( ALIZF ) |
| 1.84% |
| 3,871 |
| W.P. Carey |
| ( WPC ) |
| 1.82% |
| 3,829 |
| Home Depot |
| ( HD ) |
| 1.78% |
| 3,752 |
| Texas Instruments Incorporated |
| ( TXN ) |
| 1.73% |
| 3,635 |
| Broadcom Inc |
| ( AVGO ) |
| 1.62% |
| 3,396 |
| Hercules Capital |
| ( HTGC ) |
| 1.54% |
| 3,236 |
| Altria Group Inc |
| ( MO ) |
| 1.53% |
| 3,225 |
| Gilead Sciences, Inc. |
| ( GILD ) |
| 1.53% |
| 3,218 |
| Southern Co |
| ( SO ) |
| 1.52% |
| 3,188 |
| Toronto-Dominion Bank |
| ( TD ) |
| 1.46% |
| 3,075 |
| Wells Fargo & Co |
| ( WFC ) |
| 1.39% |
| 2,931 |
| New Residential Corporation |
| ( RITM ) |
| 1.36% |
| 2,852 |
| Blackstone Group LP |
| ( BX ) |
| 1.34% |
| 2,819 |
| Intel Corporation |
| ( INTC ) |
| 1.21% |
| 2,554 |
| Bank of Nova Scotia |
| ( BNS ) |
| 1.20% |
| 2,528 |
| Siemens Healthineers |
| ( SEMHF ) |
| 1.14% |
| 2,400 |
| Apollo Investment |
| ( MFIC ) |
| 1.09% |
| 2,295 |
| Enbridge |
| ( ENB ) |
| 1.04% |
| 2,187 |
| BMW |
| ( BMWYY ) |
| 1.02% |
| 2,136 |
| BP2 |
| ( BP ) |
| 0.93% |
| 1,954 |
| PepsiCo, Inc. |
| ( PEP ) |
| 0.86% |
| 1,814 |
| Procter & Gamble Co |
| ( PG ) |
| 0.84% |
| 1,765 |
| Morgan Stanley |
| ( MS ) |
| 0.83% |
| 1,746 |
| BP1 |
| ( BP ) |
| 0.80% |
| 1,674 |
| Philip Morris International Inc. |
| ( PM ) |
| 0.74% |
| 1,563 |
| Starwood Property Trust, Inc. |
| ( STWD ) |
| 0.67% |
| 1,415 |
| Honeywell International Inc. |
| ( HON ) |
| 0.67% |
| 1,408 |
| Daimler |
| ( MBGAF ) |
| 0.61% |
| 1,280 |
| Realty Income Corp |
| ( O ) |
| 0.60% |
| 1,270 |
| Bank of America Corp |
| ( BAC ) |
| 0.55% |
| 1,153 |
| Stryker |
| ( SYK ) |
| 0.52% |
| 1,085 |
| The Coca-Cola Co |
| ( KO ) |
| 0.48% |
| 1,014 |
| Unilever NV ADR |
| ( UL ) |
| 0.48% |
| 1,006 |
| Gladstone Commercial Corporation |
| ( GOOD ) |
| 0.47% |
| 989 |
| Brookfield Renewable Partners |
| ( BEP ) |
| 0.45% |
| 952 |
| Gladstone Investment |
| ( GAIN ) |
| 0.44% |
| 928 |
| Medical Properties Trust |
| ( MPW ) |
| 0.44% |
| 920 |
| Gladstone Capital |
| ( GLAD ) |
| 0.44% |
| 920 |
| CVS Health Corp |
| ( CVS ) |
| 0.42% |
| 882 |
| Apple Hospitality REIT |
| ( APLE ) |
| 0.41% |
| 870 |
| 3M Co |
| ( MMM ) |
| 0.41% |
| 853 |
| Target Corporation |
| ( TGT ) |
| 0.40% |
| 833 |
| Annaly Capital Management |
| ( NLY ) |
| 0.40% |
| 831 |
| Royal Bank of Canada |
| ( RY ) |
| 0.38% |
| 801 |
| AGNC Investment Corporation |
| ( AGNC ) |
| 0.35% |
| 727 |
| Medtronic |
| ( MDT ) |
| 0.32% |
| 675 |
| Verizon Communications Inc. |
| ( VZ ) |
| 0.31% |
| 645 |
| Sino AG |
| (XTP.F) |
| 0.30% |
| 641 |
| Antero Midstream Corporation |
| ( AM ) |
| 0.30% |
| 637 |
| Exxon Mobil Corporation |
| ( XOM ) |
| 0.29% |
| 619 |
| NextEra Energy Partners LP |
| ( NEP ) |
| 0.29% |
| 614 |
| Dominion Energy Inc |
| ( D ) |
| 0.29% |
| 601 |
| Spirit Realty Corporation |
| ( SRC ) |
| 0.28% |
| 596 |
| BASF |
| ( BASFY ) |
| 0.28% |
| 588 |
| Canadian Imperial Bank of Commerce |
| ( CM ) |
| 0.27% |
| 573 |
| Apollo Commercial Real Est. Finance Inc |
| ( ARI ) |
| 0.26% |
| 545 |
| Vonovia |
| ( VONOY ) |
| 0.24% |
| 506 |
| Kinder Morgan Inc |
| ( KMI ) |
| 0.23% |
| 476 |
| Pfizer Inc. |
| ( PFE ) |
| 0.21% |
| 440 |
| NextEra Energy |
| ( NEE ) |
| 0.20% |
| 412 |
| Alibaba Group Holding Ltd |
| ( BABA ) |
| 0.20% |
| 412 |
| Mastercard |
| ( MA ) |
| 0.19% |
| 399 |
| Walgreens Boots Alliance Inc |
| ( WBA ) |
| 0.19% |
| 394 |
| Omega Healthcare Investors Inc |
| ( OHI ) |
| 0.18% |
| 386 |
| B&G Foods, Inc. |
| ( BGS ) |
| 0.18% |
| 380 |
| Sixt |
| ( SXTSY ) |
| 0.17% |
| 360 |
| Colgate-Palmolive Company |
| ( CL ) |
| 0.16% |
| 328 |
| BRT Realty Trust |
| ( BRT ) |
| 0.13% |
| 281 |
| ZIM Integrated Shipping Services |
| ( ZIM ) |
| 0.13% |
| 267 |
| Bayer AG |
| ( BAYZF ) |
| 0.13% |
| 264 |
| Blue Owl Capital |
| ( OWL ) |
| 0.09% |
| 193 |
| Owl Rock Capital Corporation |
| ( OBDC ) |
| 0.09% |
| 185 |
| Fresenius SE |
| ( FSNUF ) |
| 0.07% |
| 156 |
| Boeing |
| ( BA ) |
| 0.06% |
| 135 |
| Equitrans Midstream Corporation |
| ( ETRN ) |
| 0.06% |
| 126 |
| Uniti Group Inc |
| ( UNIT ) |
| 0.04% |
| 90 |
| Diversified Healthcare Trust |
| ( DHC ) |
| 0.04% |
| 84 |
| Walt Disney Co |
| ( DIS ) |
| 0.04% |
| 80 |
| Fresenius Medical Care |
| ( FMS ) |
| 0.04% |
| 78 |
| Bank of Montreal |
| ( BMO ) |
| 0.04% |
| 77 |
| Newtek Business Services |
| ( NEWT ) |
| 0.03% |
| 66 |
| The GEO Group Inc |
| ( GEO ) |
| 0.03% |
| 57 |
| Service Properties Trust |
| ( SVC ) |
| 0.02% |
| 35 |
For further details see:
My Dividend Stock Portfolio: New September Dividend Record - 98 Holdings With 22 Buys