USOI - My Income Portfolio: Risk Volatility And Mountain Trails
2023-07-03 15:03:27 ET
Summary
- The Beta coefficient measures the behavior of a security relative to the market: a Beta greater than one indicates the investment is more volatile than the market, and vice versa.
- Standard Deviation, on the other hand, measures the range of an investment’s performance. The higher its value, the greater the investment’s volatility.
- Beta coefficient and Standard Deviation are both considered factors that attest to the riskiness of a security.
- Personally, I have always thought of risk as something that involves the possibility of loss or serious harm, while volatility has never scared me.
Chaltron’s Coup
In Florence, there is an amateur soccer tournament called Chaltron’s Coup (“Waffler’s Cup”), which is played every year between spring and summer, with the traditional whistle blowing on April 1. Now in its fifty-eighth edition, it is a goliardic-like tournament in which anyone can play even when Mother Nature has done everything possible to make it seemingly impossible for someone. This is thanks to a special rulebook that provides a rating score of 1 to 5 for each player, based on his soccer skills.
The idea was devised back in 1966 by a handful of people, unable to play soccer and for that reason were excluded from all school competitions. Our “heroes” then decided to come up with a formula that would make their presence on the field indispensable: in the tournament they organized, in fact, the sum of the starting eleven could not exceed 33 points, and it was therefore clear that alongside the good players a team had to field the dunces as well, otherwise the tallies would not comply.
In addition to being democratic, this formula also introduced evaluation criteria that were as “scientific” as possible, based on a set of parameters developed collegially by the captains of all the teams. For the first time in history, a soccer tournament had a mathematical basis! Incidentally, I won the seventh edition in 1976 with a team called Sculacciapapere (“Spankducks”): I was sixteen years old, not a great player with feet but ran a lot. I was rated 2, and always played starter.
The Beta Coefficient
If in a Chaltron’s team the presence of too many low-performing players increases the team risk, that is, the risk of losing matches, in finance such risk should be represented by the Beta coefficient and the Standard Deviation, two measures used in risk analysis related to investment portfolios.
Modern Portfolio Theory, in fact, states that both of these values attest to the riskiness of a security and establish a risk-reward relationship, suggesting that a highly risky title should have an equally high required rate of return. According to this theory, the Beta coefficient compares the volatility (and thus the risk) of a security to the market as a whole, while the Standard Deviation determines the volatility of a security based on the dispersion of its return over a certain period of time.
Risk and volatility are therefore considered synonymous: rivers of ink have been spilled on this assumption, and I want to mention here only a cautionary quote from Seth Klarman’s Margin of Safety :
I find it preposterous that a single number reflecting past price fluctuations could be thought to completely describe the risk in a security. Beta views risk solely from the perspective of market prices, failing to take into consideration specific business fundamentals or economic developments. (…) The reality is that past security price volatility does not reliably predict future investment performance (or even future volatility) and therefore is a poor measure of risk.”
Risk Measures
One of the most widely followed evaluation criterion in portfolio construction, the Beta coefficient is used to indicate whether an investment is more or less volatile than the market, i.e., the degree to which its price fluctuates from the average. The Beta coefficient then measures an investment’s sensitivity to market movements: a beta greater than one indicates the investment is more volatile than the market, while a beta lower than one indicates that the investment is less volatile than the market (here the Morningstar site uses the word “risky” instead of “volatile,” assimilating the two concepts). Standard Deviation, on the other hand, measures the range of an investment’s performance. The greater the standard deviation, the greater the investment’s volatility, that is, how much its price fluctuates around its average value.
I love mountains very much. If I equated an investment’s volatility to a trail with many switchbacks or ups and downs, I would never consider it to be risky, whereas I consider a trail with exposed or equipped sections (wire ropes, pitons, ladders) to be potentially dangerous because then my chance of getting hurt increases. If a trail is strenuous, long or winding I will take longer to get to the hut or summit, but I do not feel in danger because of that. In the same way, I try to avoid rock and via ferrata, which, however direct, jeopardize my safety.
As far as I am concerned, I have always thought that risk is basically the possibility that actual returns from my investments are different from those expected, or even that I register a loss, partial or total, of my capital (which is equivalent to “hurting myself” in the mountains). This consideration led me to abandon criteria for selecting securities for my portfolio based on risk understood as volatility, and made me rather focus on risk understood as potential destruction of value. I therefore decided to look at the performance of my securities over time, identifying NAV performance (and thus value creation or destruction over time) as a kind of compass for my choices. It may not be the absolute best, but for me in recent years it has proven to be reliable enough.
This is not to say that all the securities in my portfolio always show a positive NAV performance since launch, but most of them have a sinusoidal path largely related to market cycles. The securities I try to avoid are those whose trend is an inexorably negatively inclined plane since launch, and which give me very little hope of reversing. This, of course, is regardless of their volatility.
The Recent Losses of Short Sellers
A recent article in the Wall Street Journal reports how investors have been ramping up bets against stocks, and they are getting burned:
Total short interest in the U.S. market topped $1 trillion this month, hitting the highest level since April 2022, according to data from S3 Partners. That is up from $863 billion at the start of the year and represents about 5% of all shares that are available to trade. Short sellers borrow shares and then sell them, hoping to buy them back at a lower price later and pocket the difference. They have added to their bearish wagers in recent weeks while the S&P 500 climbed to a 14-month high. The index is up 15% in 2023 and 5.5% in June alone. That rally has been punishing: Short sellers have incurred roughly $120 billion in mark-to-market losses this year, including $72 billion in the first half of June, according to S3.” (Jack Pitcher, “Wall Street Journal,” June 20, 2023)
Markets anticipate uncertain happenings, which they evaluate through the warping lens of expectations, and for this reason volatility is an integral part of investing. With a short-term horizon, the higher the volatility, the riskier the trade to be considered; but here we are in the realm of trading, not investing, which is also distinguished from speculation by its longer time horizon. In trading, standard deviation is often used in risk management to determine the size of positions and the level of stop losses. The situation becomes more complicated in the case of short sales, because volatility can quickly erode margins and lead to huge losses, as the cited WSJ article suggests.
Yet, volatility is a criterion that guides many market choices. Right now, for example, the Vix index is very low, which induces algorithm-based funds to buy: some of their systems are in fact structured to increase equity exposure when volatility is low. In practice, the more volatility falls, the more these algorithms see low risk and buy stocks, driving it down further. The risk, of course, is that if the Vix for any reason went back up, the algorithms would start selling, and the virtuous circle would quickly turn into a vicious one.
The Volatility of My CEFs and ETFs
Despite my disinclination to identify risk with volatility for investing, I have decided to analyze the Beta coefficient and Standard Deviation for all my CEFs and ETFs, as reported on the Morningstar website, under the menu item called “Risk,” in the section “Risk & Volatility Measures” (two concepts that for Morningstar appear to proceed hand in hand).
As you may know, my investments are divided into three different income portfolios: Cupolone, my primary CEF portfolio; Giotto, comprised of ETFs that adopt a covered-call strategy; and Masaccio, my “tactical” portfolio. I briefly summarize the composition of my overall portfolio, in which there are precisely 18 CEFs, 5 ETFs, 1 ETN, and 2 stocks:
Closed-End Funds
- BlackRock Science And Technology Trust ( BST )
- Calamos Dynamic Convertible and Income ( CCD )
- Calamos Global Total Return ( CGO )
- Eaton Vance Enhanced Equity Income II ( EOS )
- Eaton Vance Tax-Adv. Global Dividend Opps ( ETO )
- Eaton Vance Tax-Adv. Dividend Income ( EVT )
- Guggenheim Strategic Opp ( GOF )
- John Hancock Tax-Adv. Dividend Income ( HTD )
- PIMCO Corporate & Income Strategy ( PCN )
- PIMCO Dynamic Income ( PDI )
- John Hancock Premium Dividend ( PDT )
- PIMCO Corporate & Income Opportunity ( PTY )
- Cohen & Steers Quality Income Realty ( RQI )
- Royce Value Trust ( RVT )
- Special Opportunities Fund ( SPE )
- Cohen & Steers Infrastructure ( UTF )
- Reaves Utility Income Trust ( UTG )
- XAI Octagon FR & Alt Income Term Trust ( XFLT )
Exchange-Traded Funds
- JPMorgan Equity Premium Income ( JEPI )
- JPMorgan Nasdaq Equity Premium Income ( JEPQ )
- Global X Nasdaq 100 Covered Call ( QYLD )
- Global X Russell 2000 Covered Call ( RYLD )
- Global X S&P 500 Covered Call ( XYLD )
Exchange-Traded Notes
- Credit Suisse X Links Crude Oil Shares Covered Call ETN ( USOI )
Stocks
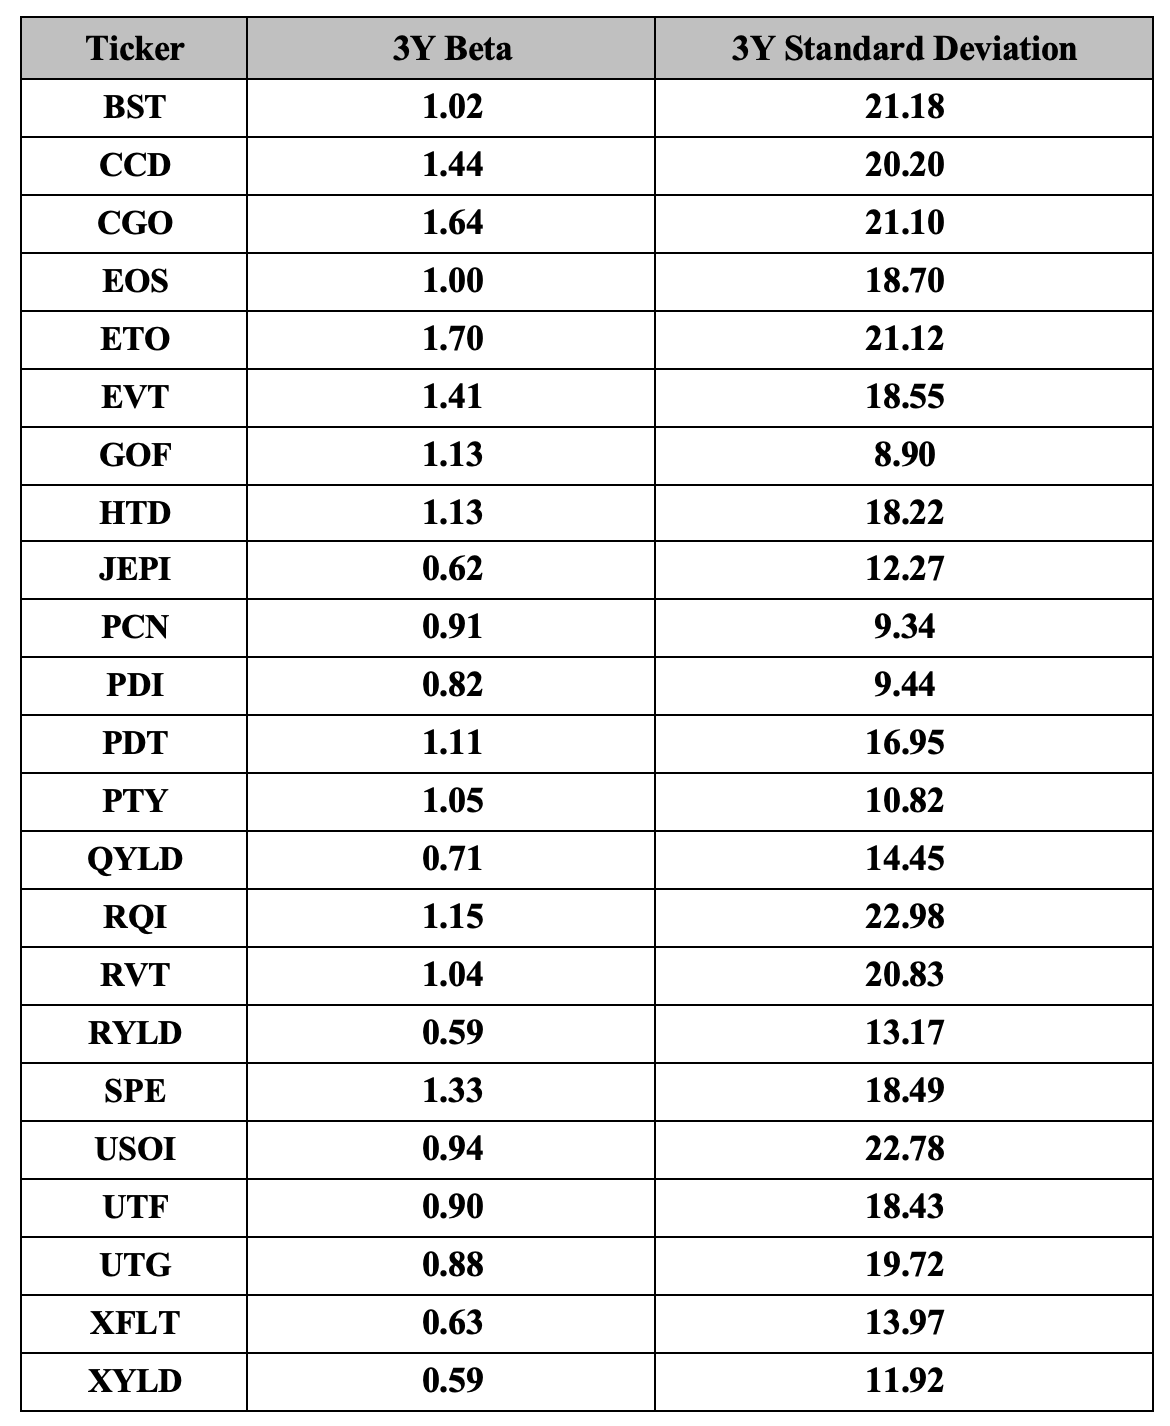
Below are values of the Beta coefficient and Standard Deviation for the past three years for all CEFs, ETFs and the ETN in my portfolio, except JEPQ, which was launched on May 3, 2022 and for which these values are obviously not yet available.
As it is possible to see, out of 23 funds, as many as 10 show a Beta coefficient below 1, indicating that these investments are less volatile than the market; 4 of them have a Beta coefficient around 1, while the other 9 have a value above 1, with the maximum of 1.70 marked by ETO, indicating that these latter investments are more volatile than the market. More volatile, but to me not necessarily more risky, if it is true that what is considered as “risky” is something that involves the possibility of serious harm, not something whose value can vary over time.
As for Standard Deviation, 14 out of 23 funds show a value above 15, which is the average value recorded over the past 30 years by the SPDR S&P 500 ( SPY ) ETF, while all four bond CEFs (GOF, PCN, PDI, PTY) report a value around or below 10.
So, Higher Return, Higher Risk?
Therefore, it should be inferred that in order to try to get a return above the market average, I have to take on more risk, assuming that risk and volatility are synonymous. However, I believe that risk and time horizon go hand in hand, and one cannot generalize a concept that changes depending on the situations to which it can be applied. I see it as very risky to buy shares in the most solid company in the world, only to sell them back in a week’s time, whereas I believe that over the long term this aspect fades.
I recently received a report from a German friend who frequents Seeking Alpha, in which he offered his personal interpretation of the relationship between risk and return. In his words I detect a sentiment common to many investors who, like us, adopt a dividend strategy, and who make this form of investment their reason for being in the financial markets.
I don’t necessarily consider it higher risk to use high yield investments to achieve my goals, as many of them are specially regulated (REITs and BDCs) and required by the rules to pay out a higher percentage, otherwise they would lose their tax privileges and benefits. You have to look for them and see what works over a long period of time, but then, you will be rewarded with an outsized return. The longer this game goes on, the more money we get back in return in the form of dividends and one day the dividends received will eventually exceed our initial invested capital, so from that point on there would be no risk for us at all. If a share or a fund were to expire worthless, we would at least have our investment or more back in the form of dividends received. A zero-sum game would be regrettable over the years, but would not threaten our existence.” (Heiko Hofheinz)
Bottom Line
In the Chaltron’s Coup, ideally one would be able to field eleven players of average value to be adequately covered in each role, but this very rarely happens, so one must hope that the skill of the players rated 5 will be able to compensate for the mistakes of those rated 1.
It is a bit like in portfolio construction: what matters is the overall result, hoping that the wrong choices do not penalize the correct ones too much. In my case, I also have funds in my portfolio that I would not buy again, while others are good goal scorers, and I am betting on those to win the game. Regardless of their volatility.
For further details see:
My Income Portfolio: Risk, Volatility And Mountain Trails