BMO:CC - My Top 10 High Yield Dividend Stocks For August 2023
2023-08-02 15:49:01 ET
Summary
- The strong equity market continued in July, with impressive gains for the SPDR S&P Trust ETF, Vanguard's High Dividend Yield ETF, and my watchlist.
- My top 10 list of high dividend yield stocks has generated an annualized rate of return of 15.22% since its inception in November 2020.
- The list from July posted a solid gain of 6.11%, outpacing both VYM and SPY.
Market Recap
The strong equity market of 2023 continues in July. The SPDR S&P Trust ETF ( SPY ) kicked off the second half of the year with a gain of 3.27% last month. Vanguard's High Dividend Yield ETF ( VYM ) posted a more respectable gain of 4.02%, bringing it's year-to-date return into positive territory. My watchlist for July starts out the second half of the year ahead of both, with an impressive gain of 6.11%, as it moves ahead of SPY since inception and continues to gain ground on VYM.
Since I started tracking this list in November of 2020 it has generated an annualized rate of return of 15.22%. The watchlist is once again outpacing the SPDR S&P 500 Trust ETF that has an annualized rate of return of 14.80%. VYM is outpacing both the S&P and my list with an annualized rate of return of 16.17%. The reason for VYM's strong performance was its resilient return in 2022 of -0.45%, while my watchlist lost 11.95% and SPY fell by 18.16%. My watchlist has a bigger focus on growth and therefore tends to underperform when market sentiment is poor but it outperforms when market sentiment is favorable. Over the long term positive market periods last longer than negative market periods, therefore I am optimistic my watchlist will catch-up and surpass VYM in due time. Year-to-date my watchlist is up 14.02% compared to a gain of just 3.54% for VYM.
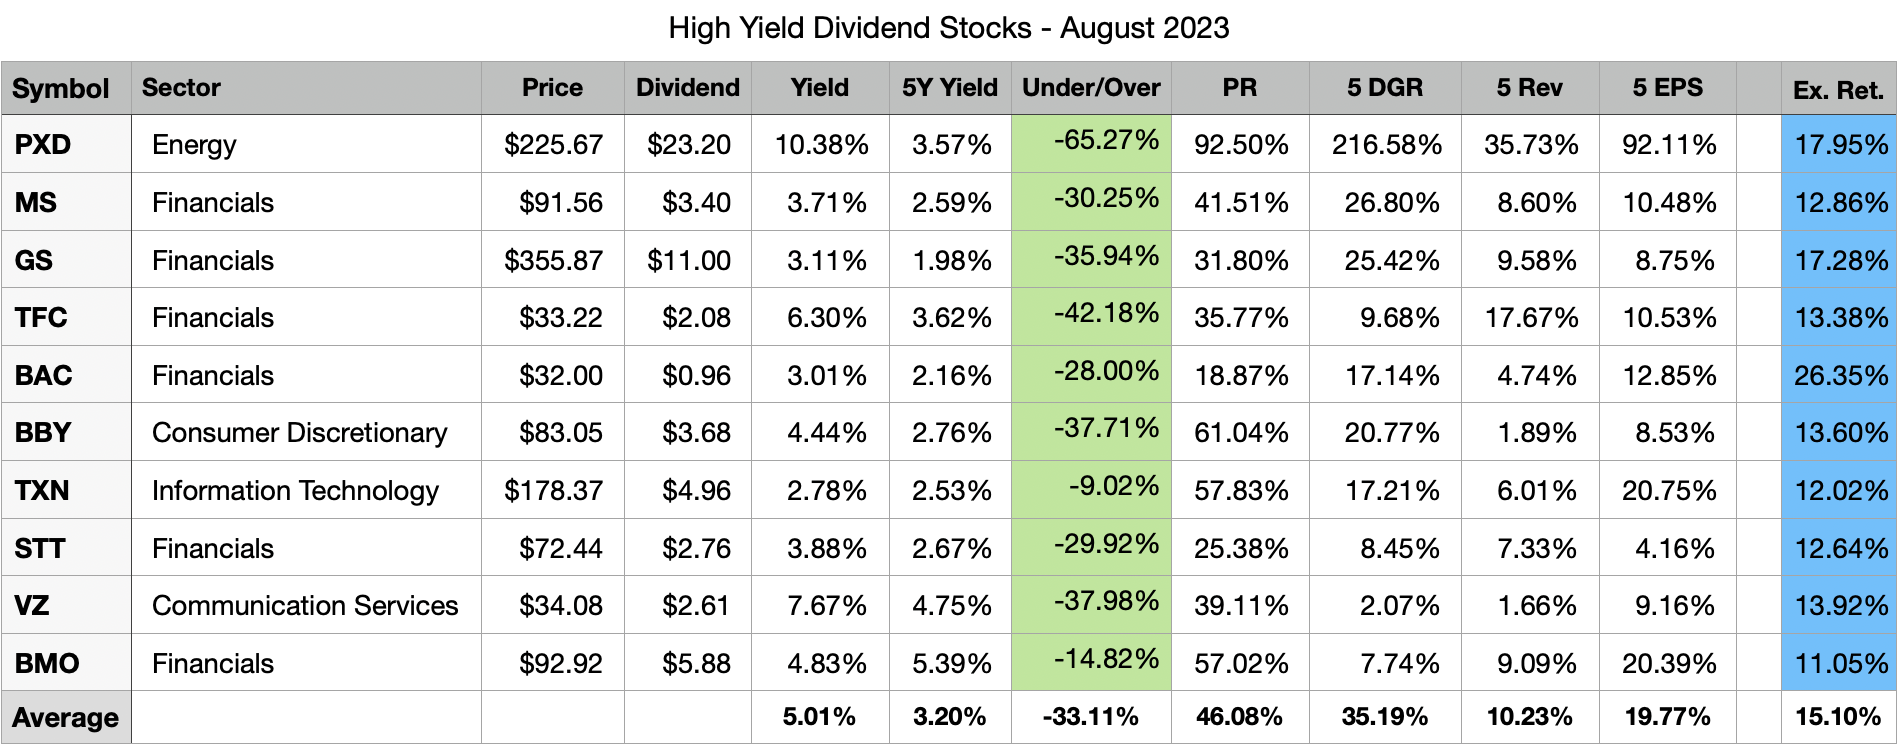
The main purpose of a high dividend yield portfolio is not to outperform the broad market but to generate a passive income stream that is relatively safe, reliable, and one that can grow in the future. The top 10 stocks on my watchlist for August 2023, collectively, offer a 5.01% dividend yield that is more than double the dividend yield of the S&P 500. These 10 stocks have also grown their dividends at a historical rate of 35.19% per year during the last five years. Collectively, all 10 stocks appear to be potentially about 33% undervalued right now based on dividend yield theory.
The best way to create a strong high yield dividend portfolio is with a buy-and-hold strategy. This strategy forces you to think about the stocks you decide to invest your capital into as the plan is to hold the positions indefinitely. Applying this approach over the long term while focusing on potentially undervalued stocks allows investors to generate alpha through capital appreciation. While this may not pan out for every position, diversifying your high-yield portfolio across 20 or more unique stocks will increase the odds of picking up shares of certain stocks when they are trading for bargain prices. The beauty of a long-term outlook is time; you can sit back and wait for the valuation to revert to historical norms, all the while collecting a generous passive income stream.
Watchlist Criteria
Creating the high yield watchlist, I had four areas of interest that I focused on: basic criteria, safety, quality, and stability. First off, the basic criterion aims to narrow down the list of stocks to those that pay a dividend, offer a yield above 2.75%, and trade on the NYSE and NASDAQ. The next set of criteria focuses on safety because that is a crucial part of a high yield investing strategy. The filter excludes companies with payout ratios above 100% and companies with negative 5-year dividend growth rates. Another level of safety can be associated with larger companies; therefore, the watchlist narrows in on stocks with a market cap of at least $10 billion. The next set of criteria set out to narrow down the list to include higher quality businesses.
The three filters for quality are: a wide or narrow Morningstar moat, a standard or exemplary Morningstar stewardship, and an S&P quality rating of B+ or higher. A Morningstar moat rating represents the company's sustainable competitive advantage, the main difference between a wide and narrow moat is the duration that Morningstar expects that advantage to last. Companies with a wide moat are expected to maintain their advantage for the next 20 years, whereas companies with a narrow moat are expected to maintain their advantage for the next 10 years. The Morningstar stewardship evaluates the management team of a company with respect to shareholders' capital.
The S&P quality rating evaluates a company's earnings and dividend history. A rating of B+ or higher is associated with above-average businesses. The last set of criteria focuses on the stability of a company's top-line and bottom-line growth. The filter eliminates companies with negative 5-year revenue or earnings per share growth rate. I believe a company that is growing both their top-line and bottom-line has the ability to provide growth to its investors in the future.
All of the stocks that pass the initial screener criteria (36 this month) are then ranked based on quality and valuation. Further, I sort the stocks in descending order based on the best combination of quality and value and select the top 10 stocks that are forecasted to have at least a 12% annual long-term return. For the month of August only 9 out of the 36 screened stocks presented estimated rates of return in excess of 12%. Therefore I had to select the highest ranked stocks that had a rate of return above 11% to fill the 10th spot on this month's watchlist.
August 2023 Watchlist
Here is the watchlist for August 2023. There are four changes from the prior month: BlackRock ( BLK ), 3M Company ( MMM ), Paychex ( PAYX ) and Unilever ( UL ) drop off and are replaced by Bank of America ( BAC ), Bank of Montreal ( BMO ), Goldman Sachs ( GS ) and Verizon ( VZ ). The data shown in the image below is as of 7/31/23.
All of the selected stocks this month appear to be potentially undervalued based on dividend yield theory.
The expected rate of return shown in the last column is computed by taking the current dividend yield plus a return to fair value over the next 5 years and a discounted long-term earnings forecast.
Please keep in mind that my return forecasts are based on assumptions and should be viewed as such. I am not expecting that these 10 companies will hit the forecasted returns. What I do expect is that these 10 companies have the potential to offer better returns during the next 5 years compared to the 26 high yield stocks that passed my initial filters but ranked worse in quality and valuation.
Past Performance
The top 10 list for July performed well, collectively the 10 chosen stocks were up by 6.11%. This was 2.09% better than VYM and 2.84% better than SPY. The watchlist is off to a decent start this year in comparison to VYM but its lack of exposure to technology stocks is causing it to lag SPY. Since inception, which was 33 months ago, the watchlist trails VYM by 0.95% and is ahead of SPY by 0.43%. The gap to VYM is shrinking and another good month or two should see the watchlist regain its lead on this popular dividend ETF.
I do not expect that this watchlist will beat VYM or SPY every month. However, I believe that a buy-and-hold investing approach leveraging the stocks presented on this watchlist will generate long-term alpha compared to the broad market. I also have a personal target rate of return of 12% that I believe will be attained by this watchlist when measured over long periods of time.
Following July, the long-term annualized rate of return for the watchlist increased from 13.19% to 15.22%. The nearly 3 years of history I have measured thus far is a long period of time but I would really like to have 5 or 10 years of results before I start passing more judgment.
| Date |
| Top 10 List |
| ALL |
| VYM |
| SPY |
| 6 month |
| 5.09% |
| 0.11% |
| 1.14% |
| 13.48% |
| 3 month |
| 5.25% |
| 3.50% |
| 4.13% |
| 10.47% |
| 1 month |
| 6.11% |
| 4.21% |
| 4.02% |
| 3.27% |
| YTD |
| 14.02% |
| 6.05% |
| 3.54% |
| 20.62% |
| Since Inception |
| 47.65% |
| 51.23% |
| 51.01% |
| 46.15% |
| Annualized |
| 15.22% |
| 16.23% |
| 16.17% |
| 14.80% |
The strong return in July was a great way to kick off the second half of this year.
Individual watchlist returns for July 2023 were:
- ( PAYX ) +12.16%
- ( MMM ) +11.40%
- ( TFC ) +9.46%
- ( PXD ) +8.92%
- ( MS ) +8.21%
- ( BLK ) +6.90%
- ( UL ) +3.07%
- ( BBY ) +1.34%
- ( TXN ) +0.68%
- ( STT ) -1.01%
Top 5 performing past and present watchlist stocks in July 2023:
Top 5 Stocks by total return since joining the watchlist:
- ( PFG ) +125.39% (33 months)
- ( AVGO ) +110.38% (27 months)
- ( FDX ) +85.12% (10 months)
- ( GD ) +81.72% (33 months)
- ( BMO ) +74.73% (33 months)
Top 5 Stocks by Average Monthly return since joining the watchlist:
- ( FDX ) +6.35% (10 months)
- ( GS ) +4.82% (2 months)
- ( EOG ) +3.72% (5 months)
- ( PXD ) +3.28% (5 months)
- ( SWKS ) +3.17% (10 months)
In total there have been 77 unique high yield dividend stocks that have appeared in the top 10 list during the past 32 months. Out of these 77 unique stocks 59 have a positive total return since first appearing on the top 10 list. The average total return for these 59 stocks is 34.46%. The average loss for the 18 stocks that have negative total returns is -14.80%. Here are all 77 stocks, their total return since inception and the number of months since they first appeared in the top 10 list.
| Symbol |
| Since Inception |
| Count |
| PFG |
| 125.39% |
| 33 |
| AVGO |
| 110.38% |
| 27 |
| FDX |
| 85.12% |
| 10 |
| GD |
| 81.72% |
| 33 |
| BMO |
| 74.73% |
| 33 |
| JPM |
| 74.22% |
| 33 |
| TD |
| 66.89% |
| 33 |
| MRK |
| 61.19% |
| 27 |
| CSCO |
| 57.49% |
| 33 |
| RY |
| 55.61% |
| 33 |
| PAYX |
| 52.22% |
| 30 |
| PEP |
| 51.66% |
| 33 |
| PGR |
| 47.94% |
| 30 |
| MTB |
| 47.00% |
| 33 |
| CVS |
| 42.90% |
| 33 |
| BK |
| 42.35% |
| 33 |
| SO |
| 40.46% |
| 33 |
| ATO |
| 39.85% |
| 20 |
| SRE |
| 39.07% |
| 29 |
| BNS |
| 38.37% |
| 33 |
| LMT |
| 37.53% |
| 33 |
| SWKS |
| 36.58% |
| 10 |
| EPD |
| 36.38% |
| 24 |
| SNA |
| 36.01% |
| 18 |
| PM |
| 35.35% |
| 29 |
| CM |
| 34.13% |
| 33 |
| STT |
| 33.68% |
| 33 |
| HBAN |
| 33.03% |
| 33 |
| CMI |
| 32.16% |
| 17 |
| GIS |
| 32.04% |
| 24 |
| CMCSA |
| 28.97% |
| 11 |
| QSR |
| 28.06% |
| 23 |
| K |
| 26.67% |
| 29 |
| HD |
| 25.03% |
| 13 |
| DRI |
| 23.80% |
| 24 |
| BLK |
| 22.62% |
| 15 |
| TXN |
| 21.40% |
| 13 |
| CMS |
| 20.54% |
| 29 |
| EVRG |
| 20.22% |
| 33 |
| EOG |
| 20.03% |
| 5 |
| DTE |
| 18.68% |
| 33 |
| FAST |
| 18.22% |
| 6 |
| AMGN |
| 17.65% |
| 33 |
| PXD |
| 17.53% |
| 5 |
| RCI |
| 17.07% |
| 33 |
| CPB |
| 16.58% |
| 22 |
| XEL |
| 15.00% |
| 29 |
| MDT |
| 13.89% |
| 8 |
| USB |
| 13.53% |
| 33 |
| NTRS |
| 10.92% |
| 33 |
| GS |
| 9.87% |
| 2 |
| OKE |
| 8.58% |
| 4 |
| UL |
| 8.57% |
| 5 |
| TRP |
| 7.27% |
| 33 |
| KMB |
| 6.73% |
| 30 |
| LNT |
| 5.70% |
| 33 |
| WEC |
| 5.47% |
| 31 |
| MS |
| 1.94% |
| 24 |
| GLW |
| 0.87% |
| 5 |
| XOM |
| -1.36% |
| 4 |
| DLR |
| -1.52% |
| 17 |
| CLX |
| -4.90% |
| 23 |
| BEN |
| -6.44% |
| 19 |
| UPS |
| -7.14% |
| 17 |
| VZ |
| -8.08% |
| 8 |
| AMT |
| -8.63% |
| 10 |
| PNC |
| -11.19% |
| 5 |
| INTC |
| -11.31% |
| 33 |
| TFC |
| -11.31% |
| 33 |
| BX |
| -12.28% |
| 16 |
| BBY |
| -12.49% |
| 19 |
| HAS |
| -14.64% |
| 33 |
| TROW |
| -14.98% |
| 18 |
| CMA |
| -17.25% |
| 28 |
| MMM |
| -22.19% |
| 33 |
| PARA |
| -39.00% |
| 33 |
| AAP |
| -61.71% |
| 17 |
Closer Look
Here's a closer look at the four new stocks on this month's watchlist: Bank of America, Bank of Montreal, Goldman Sachs and Verizon.
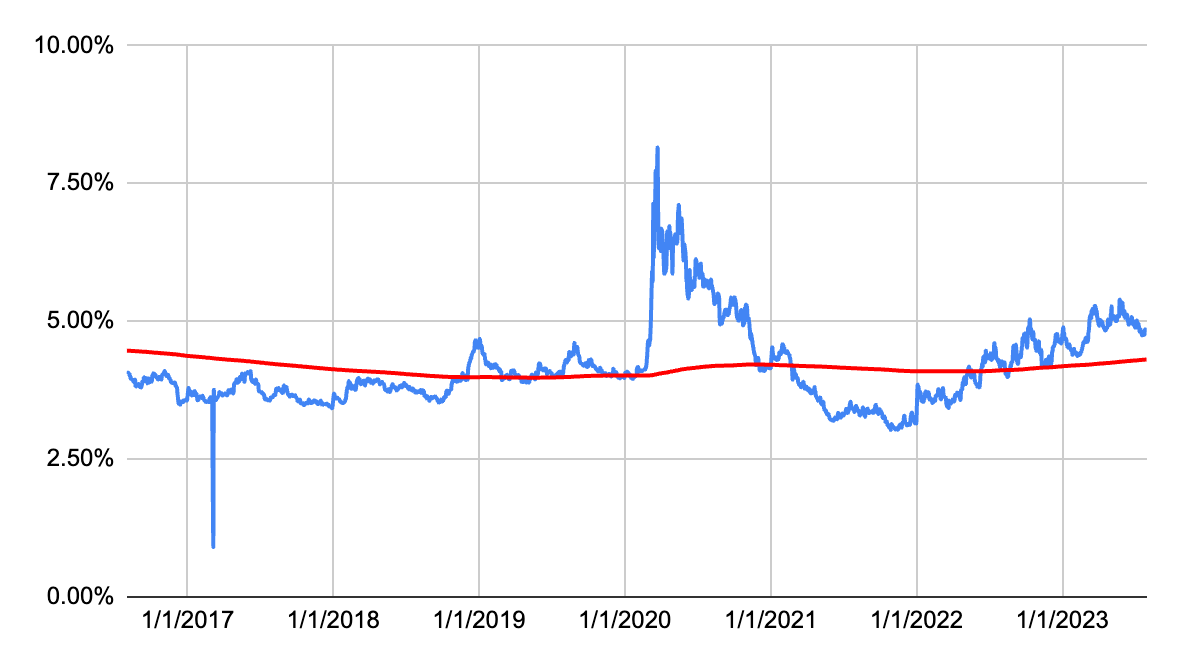
Let's start with the 7-year dividend yield theory chart for Bank of America.
The share price peaked in late 2021 and early 2022, then it took a nose dive in the first half of last year. Since mid 2022 the price has moved sideways but has seen high volatility and currently still remains in the dark green deep undervalued zone. As shown below the stock is offering above average yields today almost equivalent to the high yields we observed during the bottom of the 2020 pandemic crash.
In the dividend growth department, Bank of America raised its dividend last month by a healthy 9.09%. The dividend rate of $0.96 shown in the table below is the new forward looking annual dividend rate. Bank of America already paid two dividends this year at a rate of $0.22 and one dividend at its new rate of $0.24. Therefore its safe to assume the annual dividend for 2023 will likely be $0.92 and not the $0.96 shown in my table below. My dividend yield theory screener works better using the forward dividend rate, therefore sometimes my tables may be a little misleading.
Between 2009 and 2014 Bank of America cut its dividend rate to just $0.01 per quarter. Since 2014 the company has hastily brought its dividend rate up to pre financial crisis levels and far higher. Since 2020 the pace of dividend growth has slowed to about 8-10% per year, which is still a very healthy range for a dividend company yielding 3%.
| Year |
| Dividend |
| Growth |
| CAGR |
| 2023 |
| 0.96 |
| 11.63% |
| 2022 |
| 0.86 |
| 10.26% |
| 11.63% |
| 2021 |
| 0.78 |
| 8.33% |
| 10.94% |
| 2020 |
| 0.72 |
| 9.09% |
| 10.06% |
| 2019 |
| 0.66 |
| 22.22% |
| 9.82% |
| 2018 |
| 0.54 |
| 38.46% |
| 12.20% |
| 2017 |
| 0.39 |
| 56.00% |
| 16.20% |
| 2016 |
| 0.25 |
| 25.00% |
| 21.19% |
| 2015 |
| 0.20 |
| 66.67% |
| 21.66% |
| 2014 |
| 0.12 |
| 200.00% |
| 25.99% |
| 2013 |
| 0.04 |
| 0.00% |
| 37.41% |
| 2012 |
| 0.04 |
| 0.00% |
| 33.50% |
| 2011 |
| 0.04 |
| 30.32% |
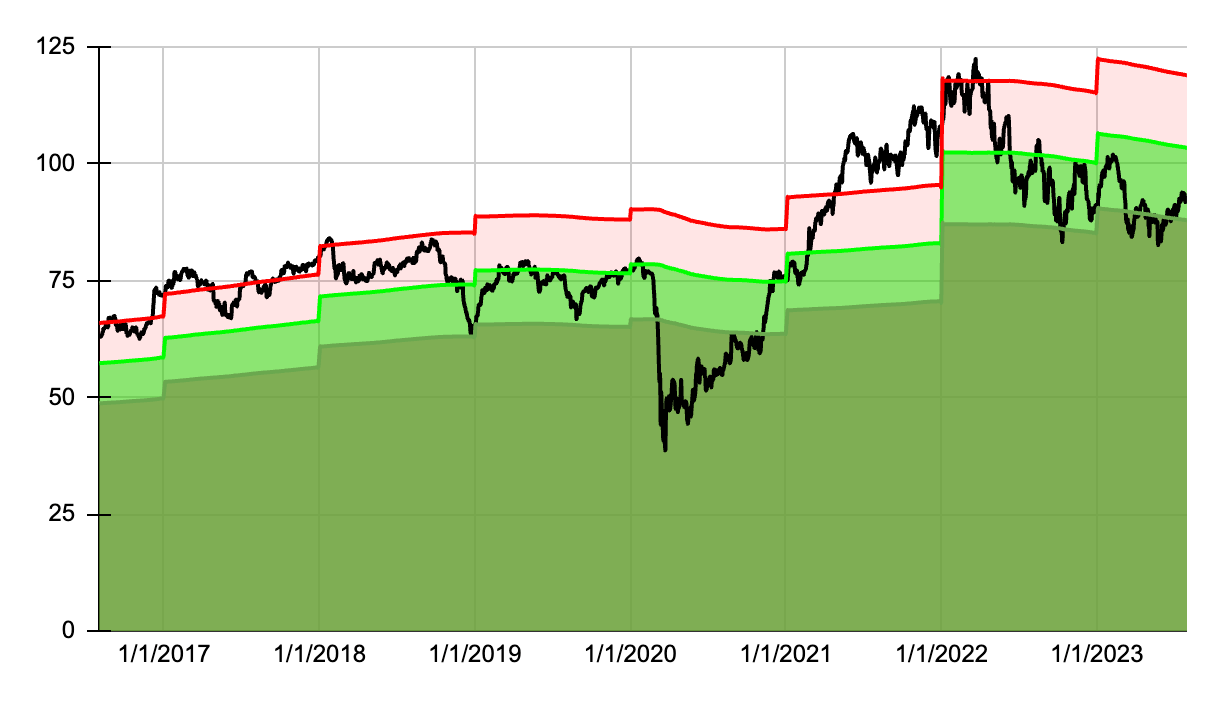
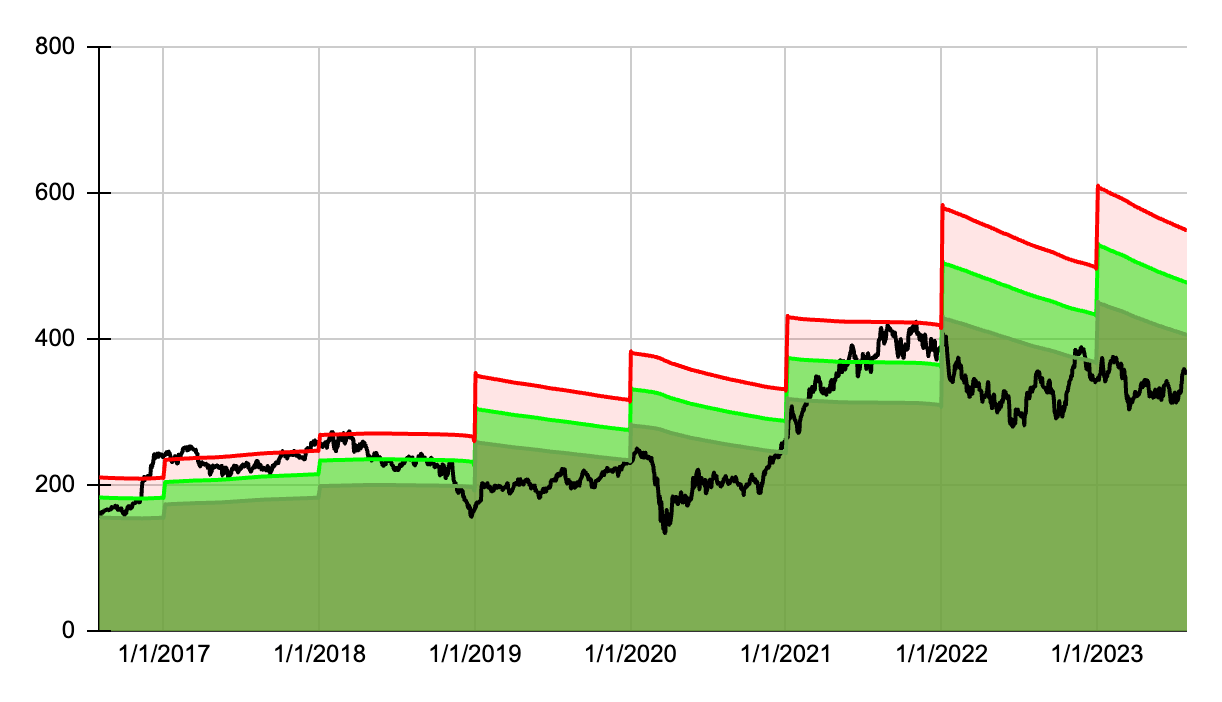
Now let's take a look at Bank of Montreal, here is the 7-year dividend yield theory chart.
Bank of Montreal peaked in early 2022 after a very impressive run-up following the 2020 pandemic crash. Since Q2 of 2022 the price has progressively trended lower into the undervalued zone, occasionally dipping into the dark green deep undervalued range. Currently dividend yield theory suggests the stock is trading for a 10% discount to fair value. The bank does pay a pretty attractive dividend yield of 4.79%, a range we have not see from the stock since 2020.
Bank of Montreal has a decent history of dividend growth. My figures below are shown in USD and therefore muddle the actual growth that is better measured in CAD.
| Year |
| Dividend |
| Growth |
| CAGR |
| 2023 |
| 4.45 |
| 6.28% |
| 2022 |
| 4.19 |
| 23.33% |
| 6.28% |
| 2021 |
| 3.40 |
| 7.81% |
| 14.49% |
| 2020 |
| 3.15 |
| 2.47% |
| 12.22% |
| 2019 |
| 3.07 |
| 4.11% |
| 9.70% |
| 2018 |
| 2.95 |
| 7.83% |
| 8.55% |
| 2017 |
| 2.74 |
| 7.00% |
| 8.43% |
| 2016 |
| 2.56 |
| 0.04% |
| 8.23% |
| 2015 |
| 2.56 |
| -8.15% |
| 7.17% |
| 2014 |
| 2.78 |
| -3.12% |
| 5.35% |
| 2013 |
| 2.87 |
| 1.63% |
| 4.47% |
| 2012 |
| 2.83 |
| -1.72% |
| 4.21% |
| 2011 |
| 2.88 |
| 3.70% |
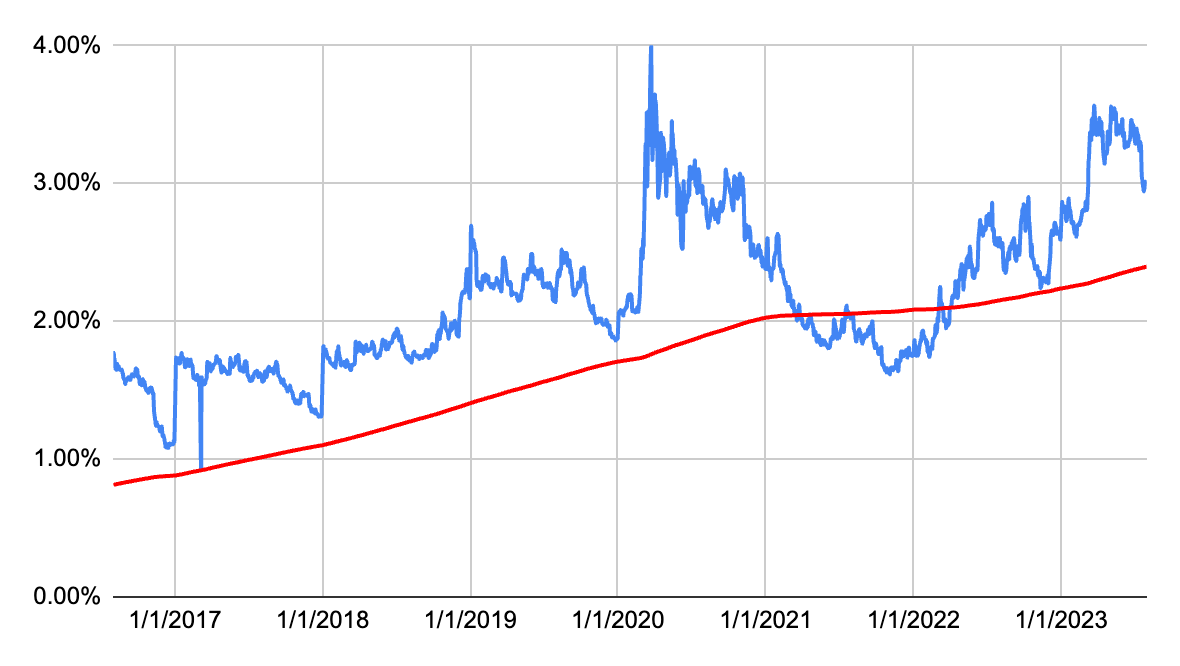
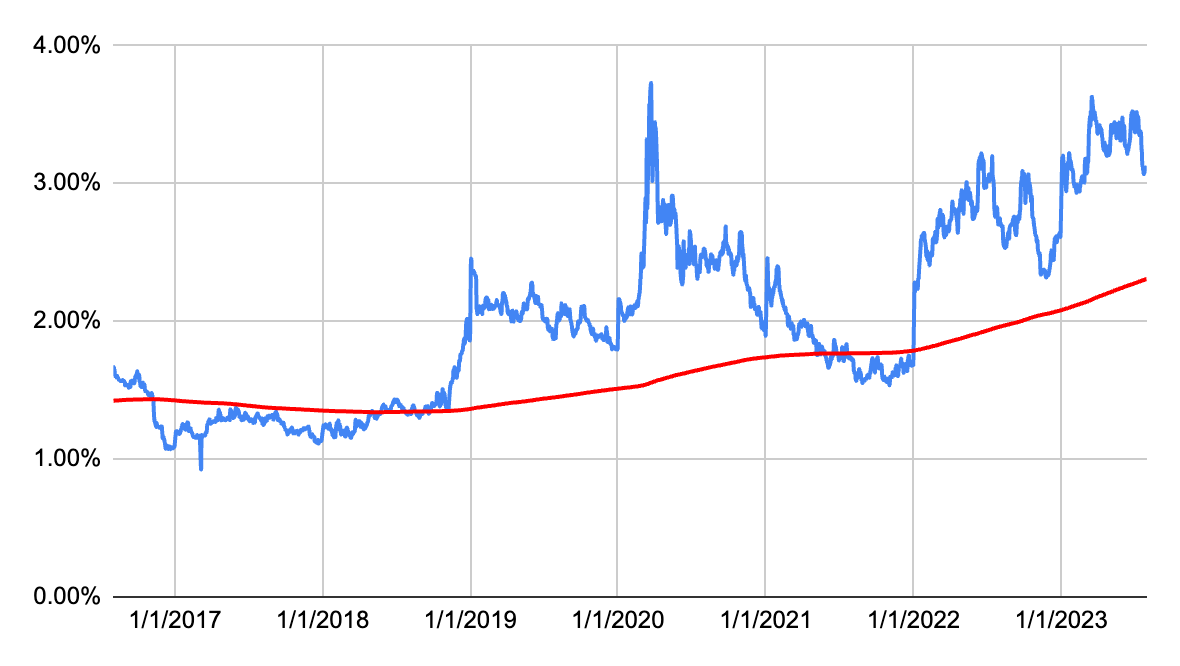
Now let's take a look at Goldman Sachs, here is the 7-year dividend yield theory chart.
Goldman Sachs has not been impacted by the 2022 market drawdown as most other equities. While it's price did trend downward, much of the early losses from 2022 were recouped later that year. 2023 has been a flat year thus far for the stock, but it did pop more than 10% in the prior month. Currently, Goldman, sports a pretty attractive dividend yield of more than 3%. There were very few opportunities to lock in such a high yield from this company during the past 7 years.
Goldman Sachs has a very strong history of dividend growth during the past decade. Two weeks ago the company announced a 5th consecutive double digit dividend increase, raising its dividend by 10%. My table below shows the forward dividend rate for the company of $11, the actual dividend investors can expect in 2023 is $10.50 since the first two dividend payments from the company this year were paid at a rate of $2.5 (new rate is $2.75).
| Year |
| Dividend |
| Growth |
| CAGR |
| 2023 |
| 11.00 |
| 22.22% |
| 2022 |
| 9.00 |
| 38.46% |
| 22.22% |
| 2021 |
| 6.50 |
| 30.00% |
| 30.09% |
| 2020 |
| 5.00 |
| 20.48% |
| 30.06% |
| 2019 |
| 4.15 |
| 31.75% |
| 27.60% |
| 2018 |
| 3.15 |
| 8.62% |
| 28.42% |
| 2017 |
| 2.90 |
| 11.54% |
| 24.88% |
| 2016 |
| 2.60 |
| 1.96% |
| 22.88% |
| 2015 |
| 2.55 |
| 13.33% |
| 20.05% |
| 2014 |
| 2.25 |
| 9.76% |
| 19.28% |
| 2013 |
| 2.05 |
| 15.82% |
| 18.29% |
| 2012 |
| 1.77 |
| 26.43% |
| 18.07% |
| 2011 |
| 1.40 |
| 18.74% |
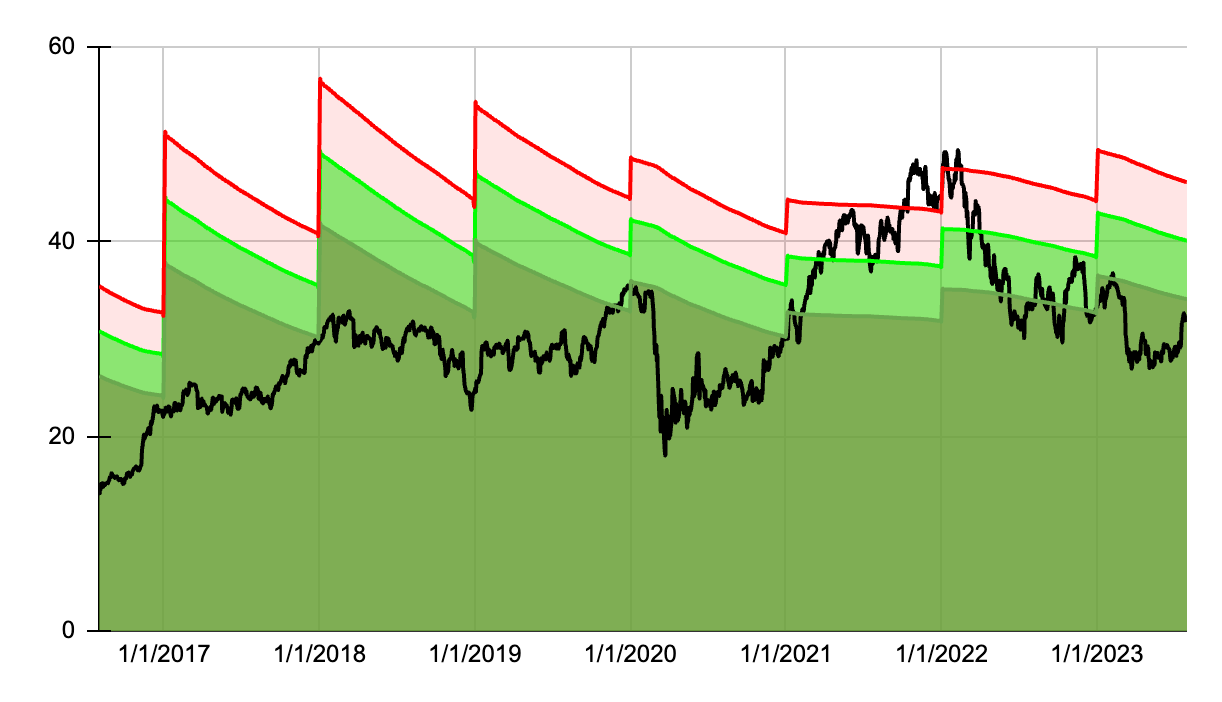
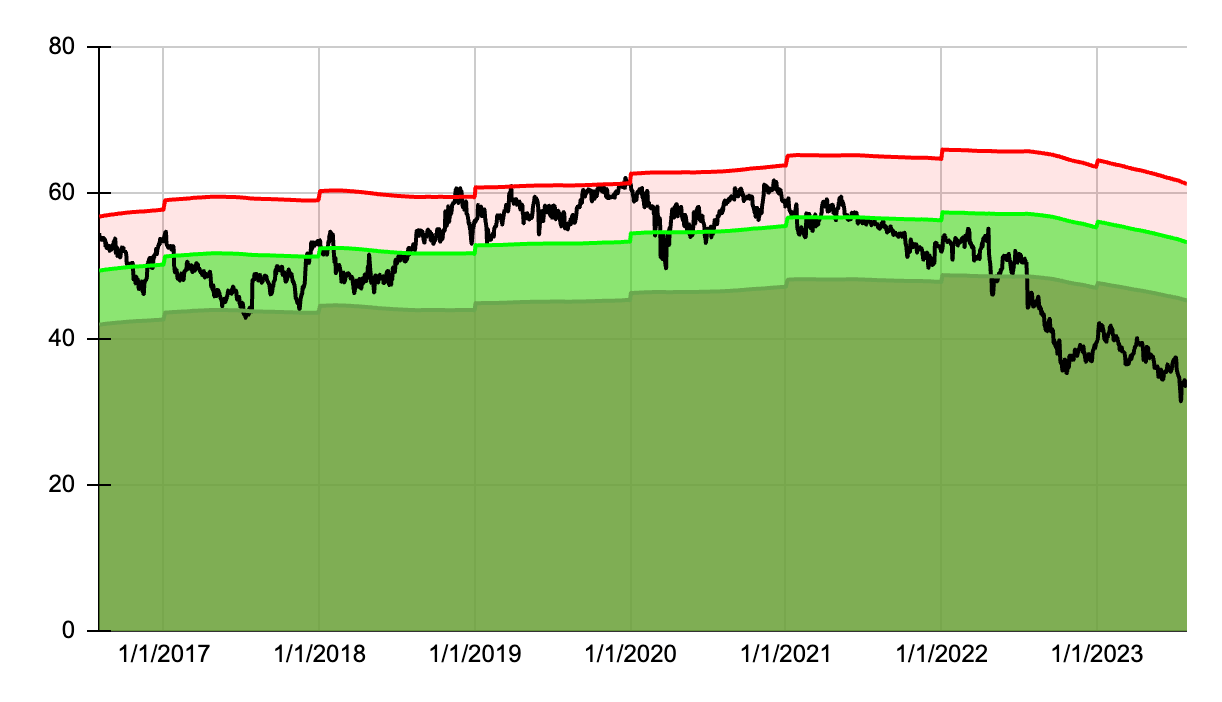
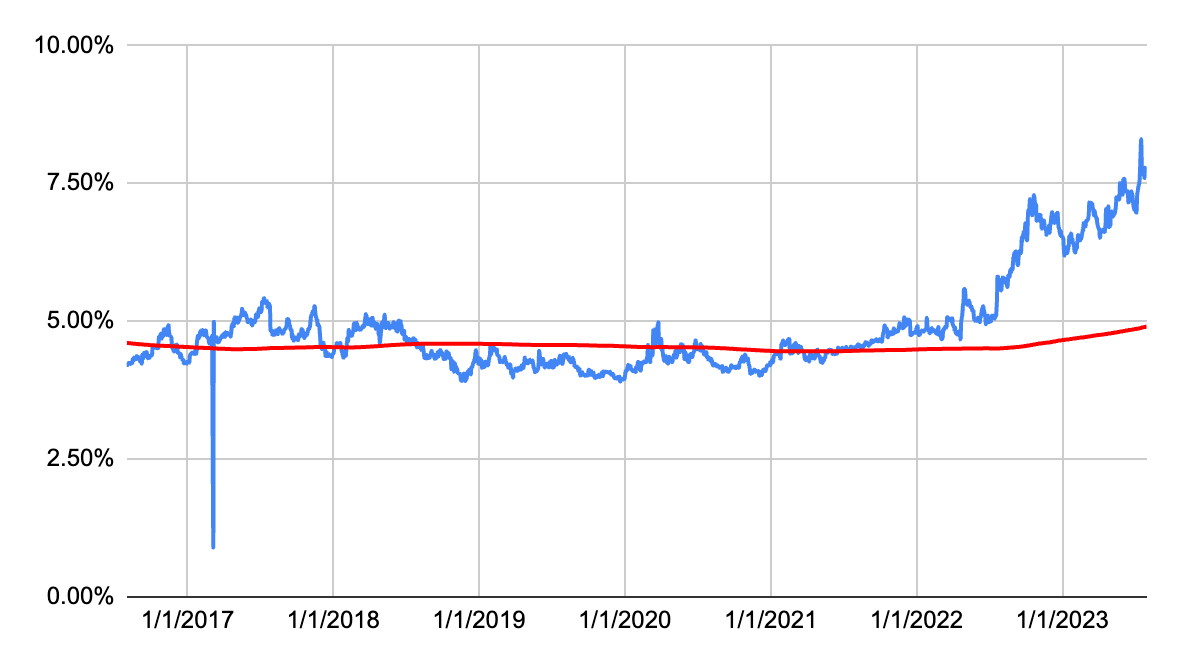
Now let's take a look at the last new stock this month, Verizon, here is the 7-year dividend yield theory chart.
Since mid 2016 the stock has oscillated in a flat range between $40 and $60. More recently it has taken a slow and painful nosedive falling below the $40 range. This in turn has driven the dividend yield through the roof, Verizon historically paid a pretty attractive yield between 4 and 5%. Today you can pick up shares of the stock above a 7.5% yield. While the dividend yield is attractive the prolonged decline in the share price can be worrisome. Verizon first popped up on my watchlist in December of 2022, and through July 2023 it has a negative total return of -8.08%, making it one of the weakest watchlist stocks. I hope to see a favorable rebound from the stock in the coming months.
In the dividend growth department Verizon has underdelivered during the past decade. The 2023 dividend increase should be announced in October but I am not holding my breath to see anything higher than usual from this Telecom. During the last 7 years, each dividend increase has been lower than the prior, perhaps this unfavorable trend will be broken later this year.
| Year |
| Dividend |
| Growth |
| CAGR |
| 2023 |
| 2.61 |
| 1.46% |
| 2022 |
| 2.57 |
| 1.98% |
| 1.46% |
| 2021 |
| 2.52 |
| 2.02% |
| 1.72% |
| 2020 |
| 2.47 |
| 2.06% |
| 1.82% |
| 2019 |
| 2.42 |
| 2.11% |
| 1.88% |
| 2018 |
| 2.37 |
| 2.15% |
| 1.93% |
| 2017 |
| 2.32 |
| 2.20% |
| 1.96% |
| 2016 |
| 2.27 |
| 2.60% |
| 2.00% |
| 2015 |
| 2.22 |
| 3.50% |
| 2.07% |
| 2014 |
| 2.14 |
| 3.13% |
| 2.23% |
| 2013 |
| 2.08 |
| 2.98% |
| 2.32% |
| 2012 |
| 2.02 |
| 2.68% |
| 2.38% |
| 2011 |
| 1.96 |
| 2.40% |
For further details see:
My Top 10 High Yield Dividend Stocks For August 2023