XLU - National Grid: Bearish Technicals After A Strong Late-2022 Rally
Summary
- UK stocks have recently notched a 12-month high as optimism grows across the pond.
- One Utilities-sector name has recovered following dire outlooks a few months ago for the European energy situation.
- I see bearish risks on the chart and outline key price levels to watch on this decently-priced company.
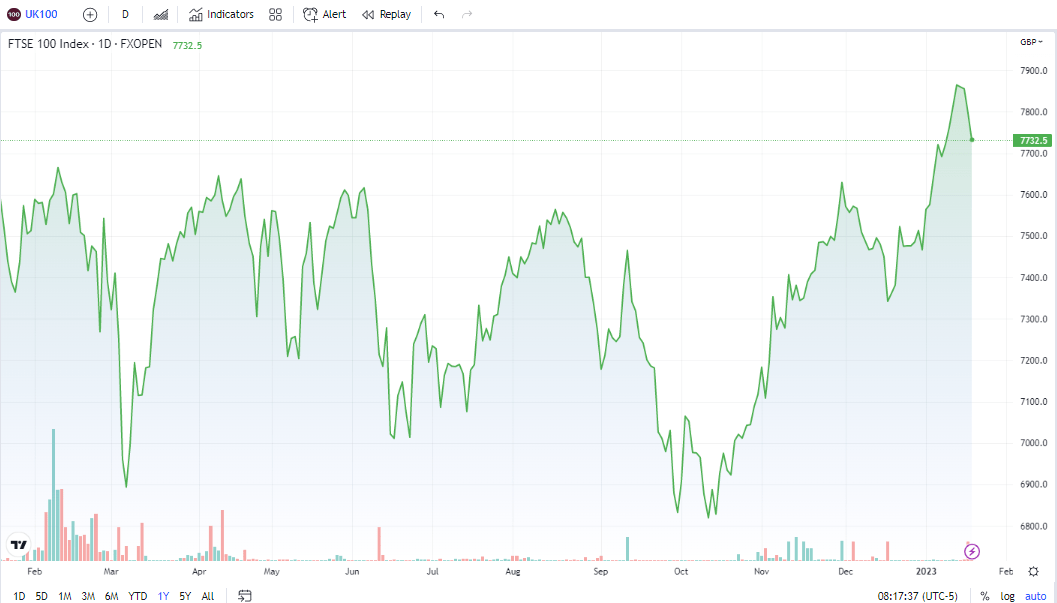
The UK FTSE 100 Index recently notched fresh 52-week highs. While London equities have dropped two sessions in a row, a weaker euro currency and hope that the broad Euro Area will sidestep a recession have been positive catalysts for a sharp rally in the last three months. Inflation is still high though, and there’s policy uncertainty with the Bank of England.
One Utilities sector stock is a lower-risk way to get exposure to the UK, but have shares rallied too far, too fast? Let’s shed light on National Grid.
FTSE Flourishes
According to Bank of America Global Research, National Grid plc ( NGG ) is an internationally regulated energy delivery business. In the UK, it owns and operates the electricity transmission and distribution network in England and Wales. NGG is also present in the Northeastern US, where it is involved in electricity and gas transmission and distribution. The firm is 93% regulated with buffered exposure to commodity prices relative to its competitors.
The London-based $46.8 billion market cap Multi-Utilities industry company within the Utilities sector trades at a low 11.5 trailing 12-month GAAP price-to-earnings ratio and pays a high 4.9% dividend yield, according to The Wall Street Journal.
Back in November, National Grid recorded first-half 2022 EPS of $30.70 with a 23% annual rise in revenue, but the top-line figure missed estimates. Still, shares generally rose in the following days and weeks. The winter energy situation in Europe has been a net positive as blackouts have been avoided amid much softer power and natural gas prices. During the height of energy crisis fears in October, NGG was trading quite cheaply. What’s it look like now, though?
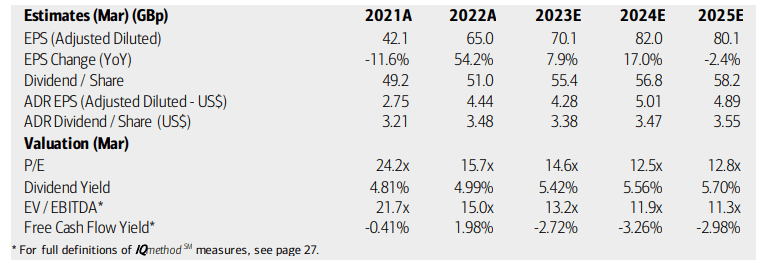
On valuation , analysts at BofA see earnings having risen sharply in 2022 at a rate of 54%. Per-share profits are seen as moderating to near 8% this year before turning a bit more volatile in ‘24 and ‘25. Dividends, meanwhile, are forecast to fall this year but then resume higher to rise above $3.50 (ADR) by ‘25.
The operating P/E multiple is reasonable given the whippy but growing bottom line while NGG’s yield looks robust. Keep in mind that most utility firms are free cash flow negative.
National Grid: Earnings, Valuation, Dividend Forecasts
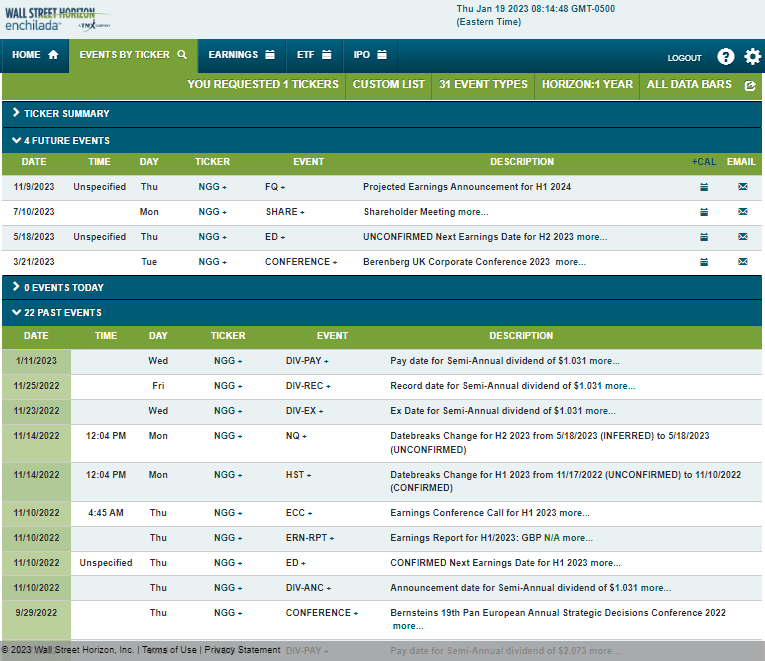
Looking ahead, corporate event data from Wall Street Horizon show an unconfirmed H2 2023 earnings date of Thursday, May 18. Before that reporting date, National Grid’s management team is expected to speak at the Berenberg UK Corporate Conference 2023 from Tuesday, March 21 to Thursday, March 23. Further out, the company holds a shareholder meeting on Monday, July 10.
Corporate Event Calendar
The Technical Take
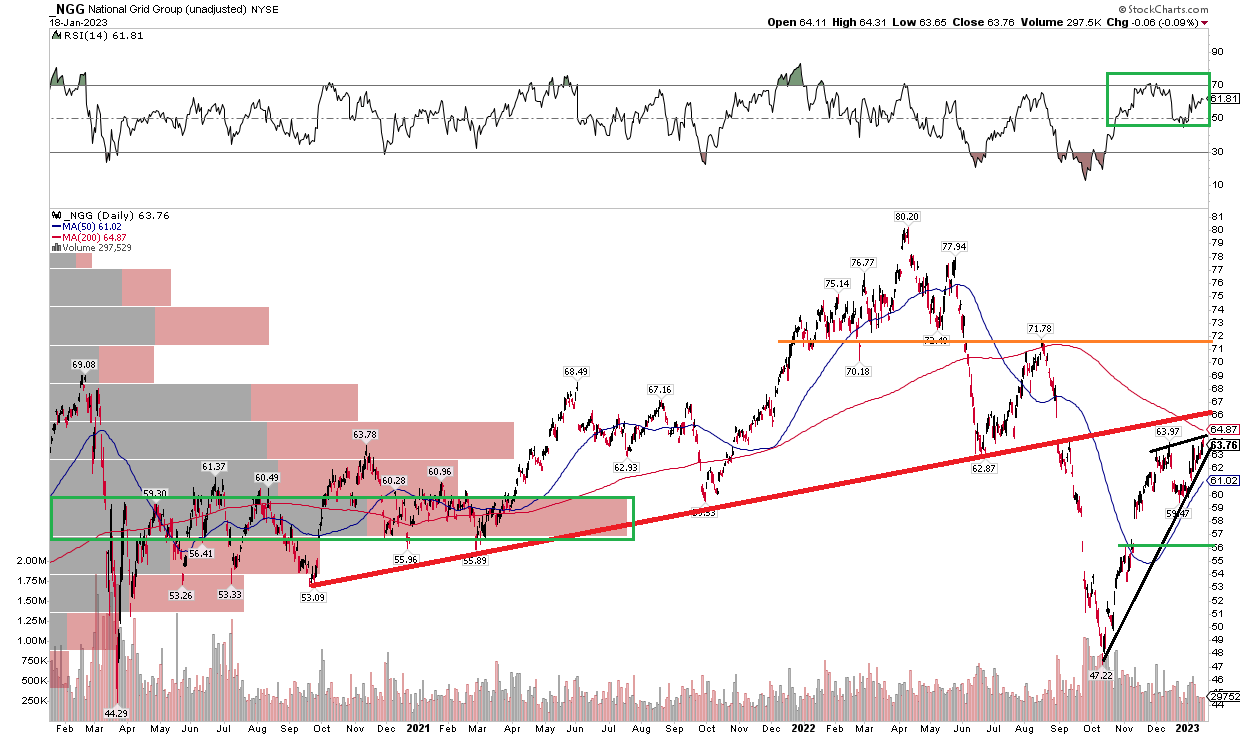
NGG has rallied about 35% from its mid-October 2022 low just above $47 to apparent resistance near $64. Notice in the chart below that shares are now in a bearish ascending wedge pattern, or a rising wedge. Moreover, the falling 200-day moving average comes into play within a couple of percentage points of the current price. NGG hit resistance at that long-term trend indicator during the third quarter of last year. Also, the June 2022 low of around $63 could be significant here. So, there are a lot of reasons to expect a pause or pullback in the low to mid-$60s.
Another bearish point is that the stock is below a trendline that was established in 2020 and 2021. The bulls, however, can point to strong RSI momentum which persists in the positive 40 to 90 zone.
In terms of upside resistance and downside support, I see $72 and $56 as key levels. Overall, the chart appears mildly bearish when combining all the pieces of evidence.
NGG: Bearish Chart Features
The Bottom Line
Given a monster run-up in NGG shares to a less attractive valuation and a somewhat bearish chart, I’m a hold on the stock for now.
For further details see:
National Grid: Bearish Technicals After A Strong Late-2022 Rally