WBA - Net Lease REITs In A New Era
2023-07-28 07:00:00 ET
Summary
- Net lease REITs have historically been solid performers.
- Elevated interest rates create some headwinds.
- So does an elevated likelihood of investment grade tenant credit migration.
- But the risks are manageable.
This article was written by Christopher H. Volk.
I have been engaged in the net lease sector for more than 35 years, during which time I took three net lease companies public on the New York Stock Exchange, two of which I conceived and co-founded.
The three companies, which were publicly listed between 1994 and 2014, outperformed broader REIT benchmarks and the long-run average stock market, with each delivering double-digit shareholder returns. Not bad for asset-backed, dividend intensive companies!
Our net lease REITs were not alone in outperformance. Realty Income ( O ) went public in 1994, three months following the public debut of our first net lease company and has produced an impressive 14.6% annual compound rate of return.
Agree Realty ( ADC ) has likewise delivered a compound annual return of 12.3% since its 1994 IPO. W.P. Carey ( WPC ) went public in January 1998 and was initially structured as a Master Limited Partnership, which improved the tax efficiency of its forming partnership rollup.
WPC later converted to a REIT and has posted an annual investor return of 11.7% since its IPO. NNN REIT ( NNN ) was initially formed as the Golden Corral REIT and is the oldest public net lease REIT in existence. Its 30-year compound rate of return is an impressive 11.8%.
Net lease REITs take no development risk and have some of the leanest expense structures going, often delivering operating profit margins well above 90%. The elevated profit margins are generally boosted by investment lease rates that tend to be historically higher than most other real estate sectors, offering added business model superiority.
The reduced investor risk they offer also includes diversity. Unlike most REITs, which have singular real estate sectors (think office, hotels or shopping malls), net lease REITs contain diverse property types leased to a myriad of tenants operating across various industry sectors. No wonder the companies I led, together with other quality net lease REIT names, have performed through thick and thin across the decades.
Shifting from a Tailwind
If net lease leaders are to be completely honest with ourselves, we have benefited from substantial tailwinds in the form of declining interest rates for the past forty years. I managed with some difficulty to land the job that launched my career with an Atlanta bank during the 1980 recession, which means I have seen the full cycle of interest rate declines.
By the middle of 1981, the overnight fed funds rate would hit 18.6%, with the prime lending rate slightly higher at 21%. Fed Chairman Paul Volker’s dramatic rate increases quelled inflation, and the interest rates would begin their secular career-long slide downward. By 2009, the overnight Fed Funds Rate was virtually zero and would stay there for nearly six years.
Interest rate reversion was slowed by the pandemic, but now it’s here. At an overnight rate at just over 5%, the Fed Funds Rate today is in the zone where it resided between 1966 and 2000 (ignoring the major 1979 -1981 blip).
YCharts
In a 2022 memo, Oaktree Capital co-founder and Co-Chairman Howard Marks referred to this shift in interest rate environment as a sea change. Oaktree was a founding shareholder of the last REIT I led.
Warren Buffett, another former shareholder of my most recent net lease REIT, concurs. He has famously likened interest rates to gravity when it comes to the stock market and other assets valuations. This past March, he said so again when asked about how helpful modest interest rates had been to share and asset performance.
“Well, it's helped. You know it— interest rates are to asset prices, you know, sort of like gravity is to the apple. And when there are very low interest rates, there's a very small gravitational pull on asset prices. And we have seen that getting played out.” - Warren Buffett March 27, 2023
Addressing the Landscape
In effect, as net lease companies, like other businesses, loaded up on increasingly low yielding assets over the past decade, they have been making bets on interest rates. The impact of those bets will play out in the form of greater headwinds to realize future rates of investor return relative to their historic returns in a downward rate environment. The impact of elevated interest rates will vary by company and depend on six business model essentials.
Debt Maturity Schedule: The notion that net lease REITs, like other REITs, took on interest rate risk by loading up on low yielding assets in recent years is only about 60% true. That’s the portion of equity they generally use. When it comes to borrowings, most net lease REITs, like other companies, capitalized on low interest rates to issue long-term notes. Realty Income even elected to retire some preferred shares and then replace them with less costly 30-year notes. The longer the maturity schedule, the more insulated shareholders will be from the gravitational impact of higher interest rates.
Rent Increases : The lease contracts held by Net lease REITs typically have escalations built in, ranging from annually to once every five years. The higher the escalations, the more insulated shareholders are from the impact of higher interest rates. The exact impact will depend on leverage. On average, net lease REITs are modestly leveraged, averaging less than 40% to cost. This means that every 1% rise in rents will cause AFFO to rise by roughly 1%/60%, or 1.67%. A 2% rise will offer shareholders AFFO growth exceeding 3%.
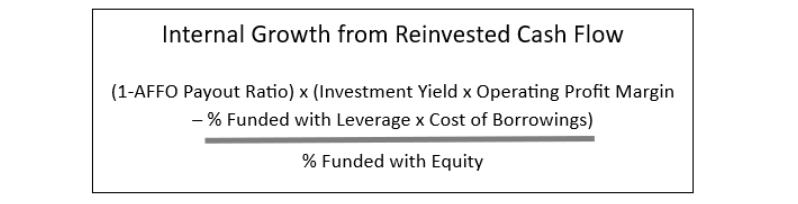
Dividend Payout Ratio : By the time I started my third REIT, I had come to appreciate the potency of a low payout ratio. When we listed the company, our payout ratio was not far north of 70%. We would eventually lower the ratio to below 70%. The formula for growth arising from reinvested cash is simple and shown below. Basically, it’s just a current ROE formula, but with the retained cash percentage thrown in the numerator.
For the most recent company I led, the added internal growth from reinvested cash amounted to between 2.5% to 3% annually. Collective with rent increases, internal growth might amount to between 5% and 6%. Given today’s net lease dividend yields in the area of 5%, that would suggest a total rate of shareholder return of 10% or better with no reliance on external growth. This is basically where I believe net lease companies should aspire to be.
Matching Cash Flows : Whether you are a REIT or not, there's no such thing as contractual cash flow matching. But what you can do is to work to match your annual debt maturities with free cash flows, or the amount of AFFO not paid out as dividends, together with asset sales proceeds. To the extent free cash flows equal or exceed debt maturities, then a REIT will not be liability sensitive because debt maturities can be repaid fully from free cash. Then, any new borrowings layered on will be a function of new investments being made, which presumably will be subject to higher contract lease rates. Net lease leaders occasionally resist selling assets, which can be a drag on growth, but it serves an important asset-liability matching purpose. Plus, such a strategy drives better portfolio management, which is better for the long-term.
Rent Growth Drag : Honestly, this is a term I made up because I didn’t know what else to call it. The term encompasses two numbers. The first is lost rents arising from underperforming tenants. All REITs face this, but net lease REITs receive greater attention here due to the long-term contractual nature of their leases. The second is the spread between the cap rate on asset sales and the redeployment cap rate. If I were to have sold off assets at lease cap rates of 6% and then redeploy the funds at 8%, the impact for the investor would be like an added rent increase. For example, if I sold off 5% of our portfolio annually, with a 2% cap rate compression, the impact would be like a .1% cap rate increase on the whole portfolio (2% x 5%). At the time I stepped down as CEO of my most recent REIT, our weighted average cap rate at cost approximated 8%. A .1% cap rate increase would be like having a rent bump of 1.3% (.1%/8%). But a negative spread would have the same impact as lost rents from an underperforming tenant and lower my rents by 1.3%. Obviously, you want to minimize rent growth drag.
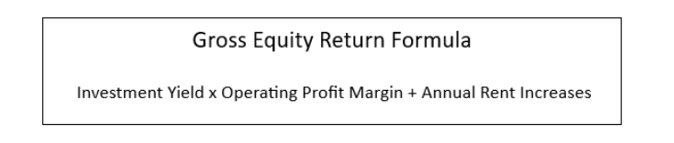
AFFO Multiple Spread : This last fundamental is what makes external growth possible. External growth is growth driven by investments a REIT makes that are enabled through new share issuance. Quality net lease REITs almost always trade north of NAV or have investment AFFO multiples that are below their traded multiples. The AFFO multiple spread is shared ratably with new and existing shareholders, providing the existing shareholders with a third form of growth otherwise unavailable from a static asset pool. When thinking about investments in general - and external growth in particular - I have always been of the view that it's important to optimize unlevered gross ROE. The formula is simple:
Many REIT observers focus on the spread between the investment yield spread to the cost of borrowings. This misses the big picture and is even less material today given narrowing investment spreads. The headline investment yield is the single most important number, followed closely by the rent increases expected from those investments. Part of the beauty of net lease companies is that leaders can manage these numbers, but the formula is universal to REITs.
Investment Grade Tenant Credit Migration
Within any diversified net lease portfolio, tenant credit quality is subject to constant change. But the value and marketability of real estate leased to investment-grade companies tends to be more impacted by downward credit migration.
That’s because real estate leased to investment grade companies tends to be characterized by lower lease yields, lower annual lease increases, higher costs per square foot, and lease contracts lacking more landlord friendly features such as master leases or unit-level financial reporting. The important dependence on tenant credit ratings to convince landlords to accept the economic and documentation costs can be lost with a shift to non-investment grade status.
Every year, Standard & Poor’s produces a report detailing bond default and credit rating transition statistics. The annual statistics with respect to credit migration are largely consistent from one year to the next and highlight that net lease companies have had it easy over the past two decades.
Few, if any, investment-grade rated tenants have lost their elite status. In part, this is because many of these highly rated companies were growing and not in a mature life cycle please. This has the potential to represent another sea change.
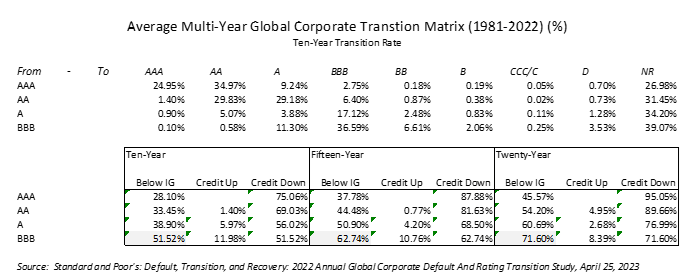
What follows is the most recent 10-year credit rating migration table from S&P’s 2023 report, together with a summary of 15- and 20-year credit rating migration statistics:
Most net lease investment grade tenants tend to be in the BBB area, which I highlighted in the summary tables. Over a 10-year period, this means there is less than a 50% chance that such tenants will retain their BBB rating. That percentage falls to under 30% over a 20-year period. Remember that primary lease terms are often for as much as twenty years.
The full 10-year table shows the primary reason why companies lose their investment-grade ratings: They choose to. This should not be a surprise. Companies are run for shareholders, not creditors or landlords. And nearly all investment-grade net lease tenants do not need investment grade credit ratings to conduct their business. The ratings are simply an option.
There are plusses for net lease companies to invest in real estate leased to highly rated companies. But the reliance on credit rating retention to maintain asset-level values and marketability represents a clear and important downside risk.
Today, that risk is playing out. Kohl’s ( KSS ), a perennial BBB-rated retailer with 1,170 locations, lost its investment-grade status in 2022. Since then, the company has jumped over a BB+/Ba1 rating this past spring to become rated BB/Ba2, placing it deeper within speculative-grade bond status.
Of Kohl’s locations, 409 are leased, with another 243 situated on ground leases. The landlords owing this real estate, especially those owning both land and buildings, have suffered value erosion with the company’s changing credit fortunes. Kohl’s investment-grade status always owed much to the company’s heavy equitization, enabling it to own 35% of its locations, together with the buildings on an added 20%.
A far bigger piece of the credit migration iceberg lurks. Walgreens ( WBA ) has approximately 13,000 locations, of which it leases 93%. At the beginning of 2023, Moody’s lowered the company’s credit rating to Baa3 with a negative outlook that would push the company below investment grade. For now, S&P has maintained the company’s BBB credit status.
The company, which has been slowly shuttering stores for years, announced in June that an added 150 domestic and 300 UK locations would be closed. The landlords of these closed units are at risk of meaningful value loss. Meanwhile, as the remaining thousands of Walgreen’s landlords hold their breath, hoping for a turnaround, public net lease companies might consider lightening any exposure they have.
Like Kohl’s, the reason for Walgreen’s credit woes predominantly rests in deteriorating performance, given margin erosion and elevated competition. And like Kohl’s, the company has undertaken recent senior management changes to shape its future.
For years, the company has been looking for ways to elevate its relevancy, including an ill-fated $100 million attempt to strategically align with Theranos. Over the past two years, Walgreen’s has invested more than $9 billion in acquisitions in added healthcare investments as it seeks to diversify its revenue base. These investments have yet to show their impact.
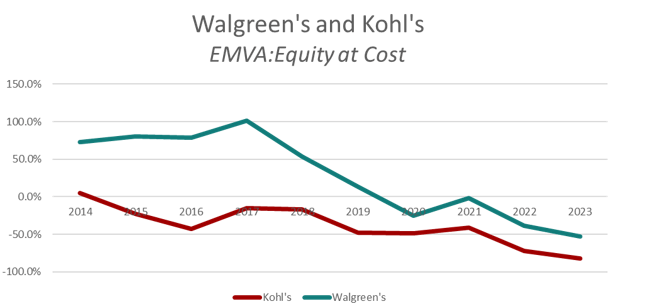
The degradation of both Kohl’s and Walgreen’s has been embodied in a steady drop in their shareholder equity returns, which has resulted in massive drops in EMVA, or Equity Market Value Added. EMVA is the difference between equity at cost and equity at market; only in the case of Kohl’s and Walgreens, it has headed into negative territory.
Today, you can acquire shares in Walgreen’s and Kohl’s at discounts to their equity cost basis of more than 53% and 82%, respectively. Given their current enterprise economics and resulting valuations, you would not think about recreating either company today.
Walgreen’s degradation should give real estate investors concern about another major pharmacy chain: CVS ( CVS ). This company experienced a downward credit shift from BBB+/Baa1 to BBB/Baa2 following its 2018 acquisition of Aetna Insurance. Unlike Walgreens, which is more of a pure play on retail pharmacy, CVS has diversified into health benefits and pharmacy services.
For 2022, the company’s $16 billion in adjusted operating profits were nearly evenly split across its three sectors. Still, for real estate landlords, the question is the degree to which Walgreen’s unit-level problems are shared with its more diversified counterpart. CVS rents 95% of its 7,795 retail locations from thousands of landlords.
In March of this year, CVS CEO Karen Lynch made a move demonstrating that Walgreen’s is not alone in its retail struggles. She announced that the company would be shuttering 900 locations by 2026. No doubt, CVS landlords are taking notice. Valuation and marketability will be lost. Again, I believe publicly traded net lease companies would be wise to lessen their exposure.
Large investment-grade credits often come in industry clusters that can accompany high levels of potential performance correlation. This is precisely what Harry Markowitz, the Nobel Laureate pioneer of Modern Portfolio Theory, sought to avoid when looking to assemble outperforming diversified portfolios. Walgreen’s and CVS provide one such example. Another is in the home improvement space (Lowe’s ( LOW ) and Home Depot ( HD )). A third correlated cluster lies in dollar stores (Dollar General ( DG ) and Dollar Tree ( DLTR )).
Auto parts retailers represent a fourth investment-grade tenant cluster, with popular names including Advance Auto Parts ( AAP ), AutoZone ( AZO ) and O’Reilly ( ORLY ). Advance Auto Parts has nearly 5,000 locations, of which approximately 85% are rented. On May 31, the company released disappointing first quarter earnings showing a 74% decline from 2022 due to inflation-driven margin compression.
In response, retiring CEO Tom Greco (he’s departing at the end of 2023) announced an 83% dividend cut, with AAP shares leading NYSE daily underperformers, tumbling 35%. AZO and ORLY shares fell in sympathy but recovered.
A few days later, S&P downgraded AAP to its lowest investment-grade rating (BBB-). Moody’s elected to retain the company’s slightly higher Baa2 credit rating but imposed a negative watch. Meanwhile, shareholders can buy AAP today for a discount to its equity cost close to 30%.
Credit migration statistics don’t lie. They sometimes just take time to play out. As with Kohl’s, Walgreens and CVS, secular market changes can hamper operating performance. Such may eventually happen with other investment-grade tenant clusters. Or perhaps as tenants mature and face pressures to improve their shareholder returns, the temptation to jettison ratings can prove irresistible. The net lease company response? Elevated vigilance in the form of incremental portfolio management.
Net lease companies engaged in investment-grade tenant real estate investing have had it easy for the past 20 years, with little in the way of tenant credit migration. The future is unlikely to be so accommodating.
Shareholders should reward net lease companies for lightening up on investment grade tenants having increased migration risks, especially if net sales proceeds can be reinvested into higher yielding investments having elevated gross equity returns.
Net Lease REITs Belong in A Diversified Portfolio
No secret here. I have always believed that net lease REITs belong in a diversified portfolio. Apart from their historic performance, net lease REITs are characterized by highly predictive business models having known variables. And their historic undervalue relative to broader REIT benchmarks also means that a higher level of total return can be expected to some from dividend income.
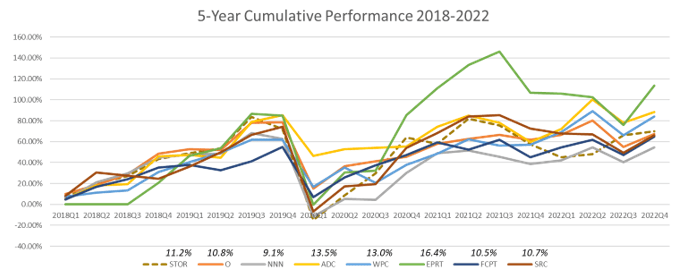
Just to illustrate net lease REIT resiliency, the below chart illustrates cumulative five-year returns for eight net lease companies between 2018 and 2022, inclusive of my former company (STORE Capital), which I departed in 2021 and which was recently privatized in February 2023.
Collectively, the performance through the pandemic was impressive, with none of the companies reducing their dividends despite temporary tenant hardships. In fact, only one net lease REIT (EPR Properties, with investments centered in theaters and entertainment assets) would see their distributions interrupted during this period. With the lowest of the eight REITs show having a compound return of just over 9%, the group performance is collectively and individually impressive.
Today’s net lease companies are far better off than their earlier versions. The first company I helped guide also was the first net lease company to achieve a BBB-/Baa3 credit rating. At the time, our leverage approximated 50% to cost. Today, 50% leverage would not suffice.
Net lease companies have greater equitization. Similarly, we were characterized by far higher tenant concentrations than we see today. When it comes to dividend payout ratios, today’s companies also are better positioned. It bears mention that more than half our earliest portfolios had virtually no potential rent increases.
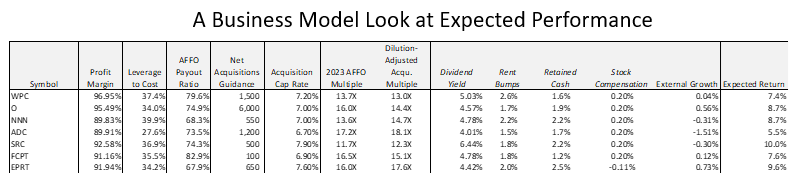
I like to examine company business model fundamentals with a demonstration in the prior table. Net lease profit margins for the seven sample companies generally range between 90% and 95%, with all seven companies shown having secure dividends.
Based on first quarter acquisition lease rates and annual guidance (to the extent it is offered), one can estimate the impact of external growth. This is the area of current challenge to many participants. Contracted sector AFFO multiples and elevated borrowing costs have imposed external growth pressures.
Even for a high-quality company like Agree, which trades at the highest AFFO multiple of the group, external growth is a challenge. Superficially, their acquisition cap rates seem adequate to create growth. The company trades at a 17.2X AFFO multiple and acquired assets at a 15.8X multiple in the first quarter.
When it comes to the external growth of Agree and other participants, the expected pace of growth can create an issue. In the case of Agree’s stated acquisition objectives, required new share issuance could be as high as 14% of shares outstanding.
When it comes to external growth, the percent of dilution is effectively the portion of the acquisition cap rate existing shareholders must give away to new shareholders. So, breakeven acquisitions then become 15.8X x 1.14, or 18.1X, which poses the risk of negative external growth creation. Without question, the degree of dilution can be a damper on growth expectations.
Similarly, Realty Income, a well-regarded dividend aristocrat, is continually knocking acquisitions out of the park, but seems likely to produce under 1% growth in 2023 for all that effort. Indeed, with tighter AFFO multiples and more costly borrowings, working hard for acquisitions can become a “long run for a short jump.”
To make things easier for the net lease sector’s external growth prospects, multiple expansion would help and I believe will occur as interest rates eventually stabilize. As a sector, net lease REITs trade at an average AFFO multiple of approximately 13X 2024 expected AFFO and a dividend yield north of 5%.
This is just ahead of sectors like hotels, malls, office and healthcare, all of which are addressing secular changes. Meanwhile, higher performing sectors like single family housing, multi-family, self-storage, industrial and data center face many of the same sea change challenges. As a result, I continue both to like and invest in the net lease sector.
I have broad net lease holdings, but do have favorites. I prefer smaller cap REITs to the largest names. For one thing, their size means that their relative bets on interest rates over recent years will be less impactful. They can dollar cost average far more easily. Likewise, I prefer net lease companies having higher external growth potential.
I also prefer net lease companies having lower dividend payout ratios together with higher tenant lease escalations. Finally, being a believer in diversification, I include in my net lease portfolio the ( NETL ) ETF, which is a net lease ETF that includes other quality names like VICI ( VICI ) and STAG Industrial ( STAG ). Importantly, NETL is not market cap weighted, which improves its diversity attributes, making it an excellent choice to play the sector.
Note: Brad Thomas is a Wall Street writer, which means he's not always right with his predictions or recommendations. Since that also applies to his grammar, please excuse any typos you may find. Also, this article is free: Written and distributed only to assist in research while providing a forum for second-level thinking.
For further details see:
Net Lease REITs In A New Era