CA - Newmont: The Biggest But Not The Best Gold Major
2023-10-02 11:40:21 ET
Summary
- Newmont's acquisition of Newcrest will create a gold mining behemoth with an expected yearly output of 8 million oz, surpassing Barrick and Agnico.
- Newmont's Q2 results were disappointing, with lower production and higher costs affecting profitability. Despite this, NEM maintains an excellent balance sheet with adequate liquidity.
- Newmont is overvalued based on conservative NAV valuation but offers a 63% margin of safety at $1800/oz gold prices. Based on mining multiples, NEM offers excellent value, too.
- Generous dividends are not enough to take a risk investing in gold miners. If I seek cash flows, I will buy REITS and bank stocks. Taking a risk buying gold miners, I seek an asymmetric bet, which is not the case with NEM.
- Considering all the facts, I give NEM a hold rating.
Thesis
Newmont ( NEM ) is the indisputable leader in gold mining measured in annual production and plausible reserves. However, is it a good buy for gold investors? In today's report, I will give my perspective. Newmont announced its plans to acquire Newcrest, another gold major with an annual production of 2 million ounces, thus creating a behemoth with an expected yearly output of 8 million oz. This number exceeds Barrick's ( GOLD ) and Agnico's ( AEM ) production.
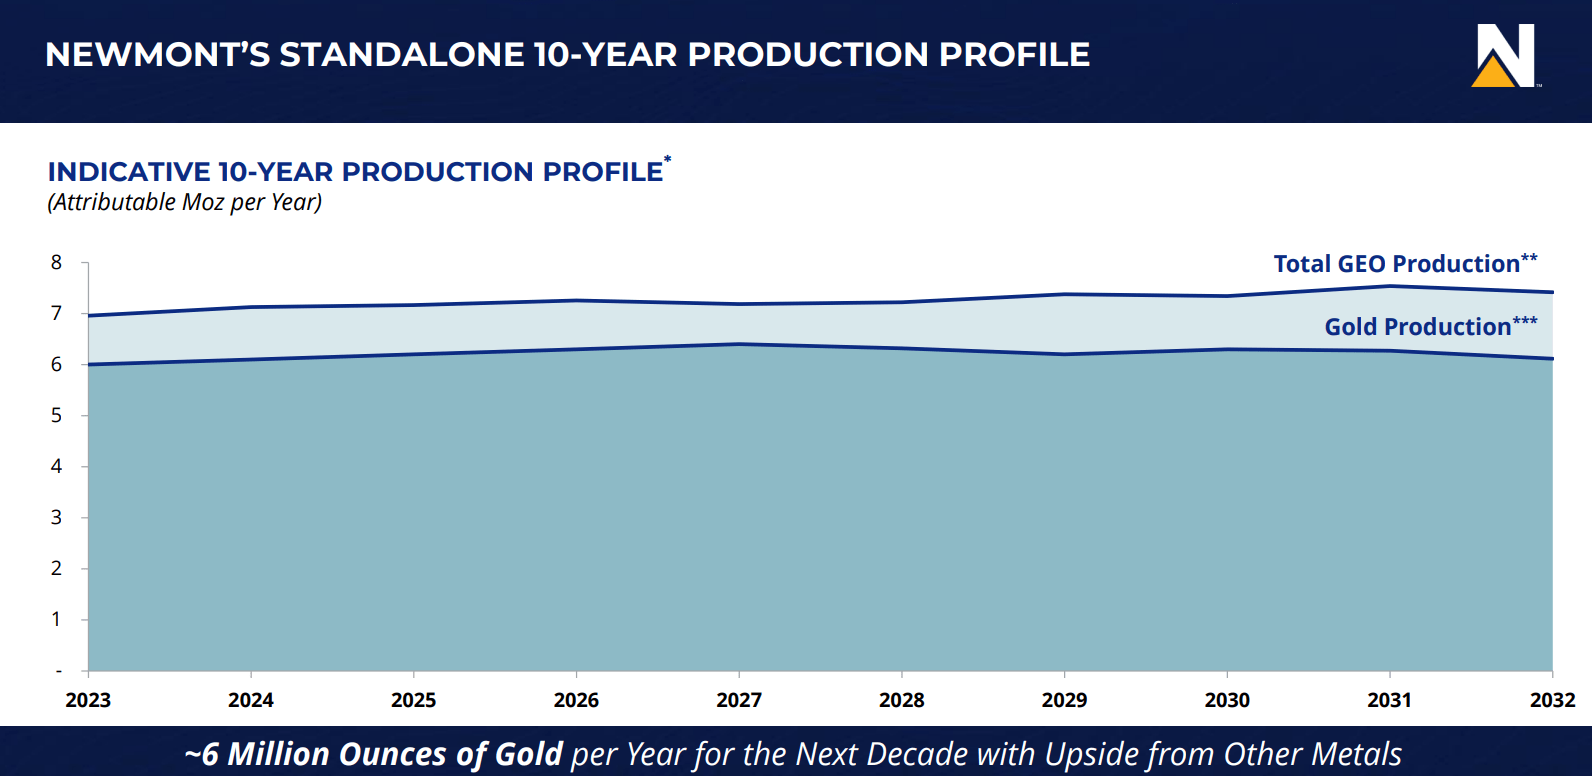
One condition must be met to profit from gold majors: rising spot prices. However, we need more ingredients, growing annual production, and stable AISC to gain asymmetric returns. NEM is more suitable for income-minded investors who seek exposure to higher gold prices but are not looking for parabolic risk rewards. The chart below from the last corporate presentation shows Newmont's (excluding Newcrest) ten-year production profile.
The curve is explicitly flat; thus, by buying NEM, we bet on higher gold prices while being paid handsome dividends. Using a conservative NAV valuation with a $1500/oz gold price, NEM is overvalued. However, spot prices at $1800/oz offer a respectable margin of safety at 62%.
That said, I give NEM a hold rating. Generous dividends are not enough to take a risk investing in gold miners. If I seek cash flows, I will buy REITs and banking stocks. Taking a risk investing in gold miners must offer asymmetry of the bet, and this is missing in NEM.
Newmont 2.0
With an annual production of about 8,000 koz, Newmont will surpass all other gold producers if it successfully acquires Newcrest. NEM would add $17.5 billion in assets, including around $650 million in liquidity and $615 million in inventory. However, NEM must issue approximately 356 million shares to complete the transaction. This will dilute existing shareholders' investments by almost 31%.
Q2 results
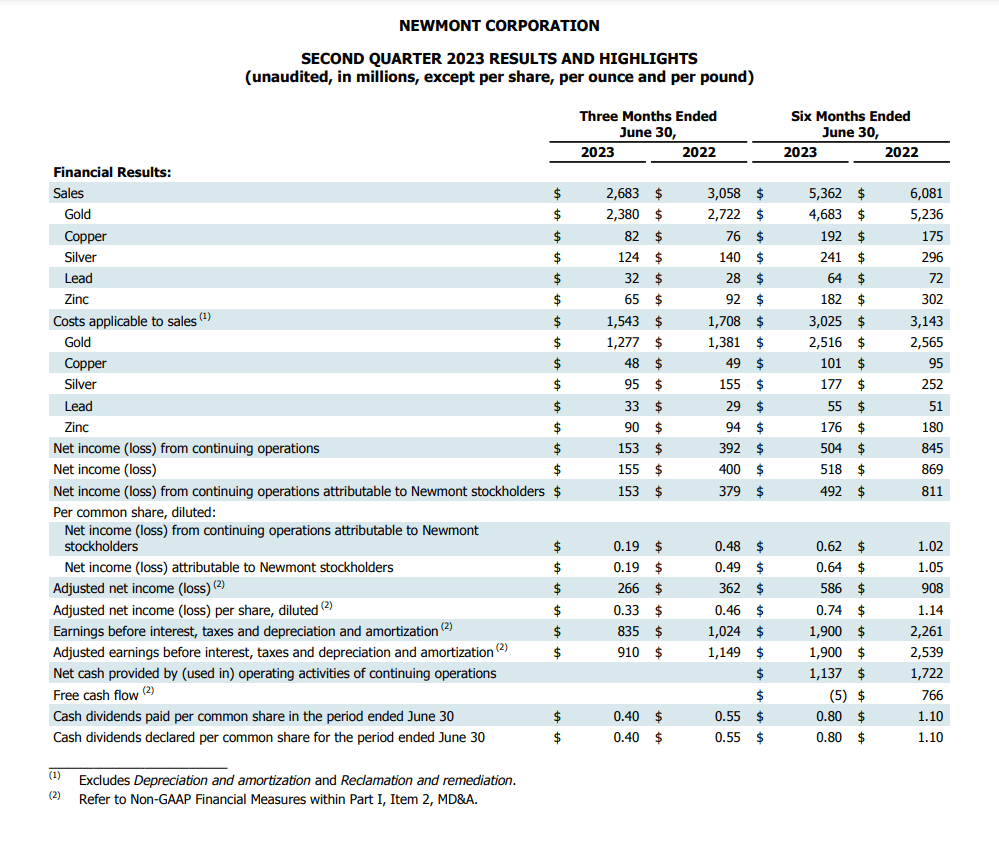
Newmont 2Q23 was disappointing compared to other gold miners. Its results were among the weakest sector-wide, with lower production and higher costs, thus notably reducing the company's profit margins. The table below from the last financial report shows the declining revenues by product.
Newmont's profitability was under pressure in the last quarter due to increased CAPEX and lower output from most mines. Cost of sales declined in the silver, gold, and copper segments. However, that fact could not compensate for lower copper prices and falling output.
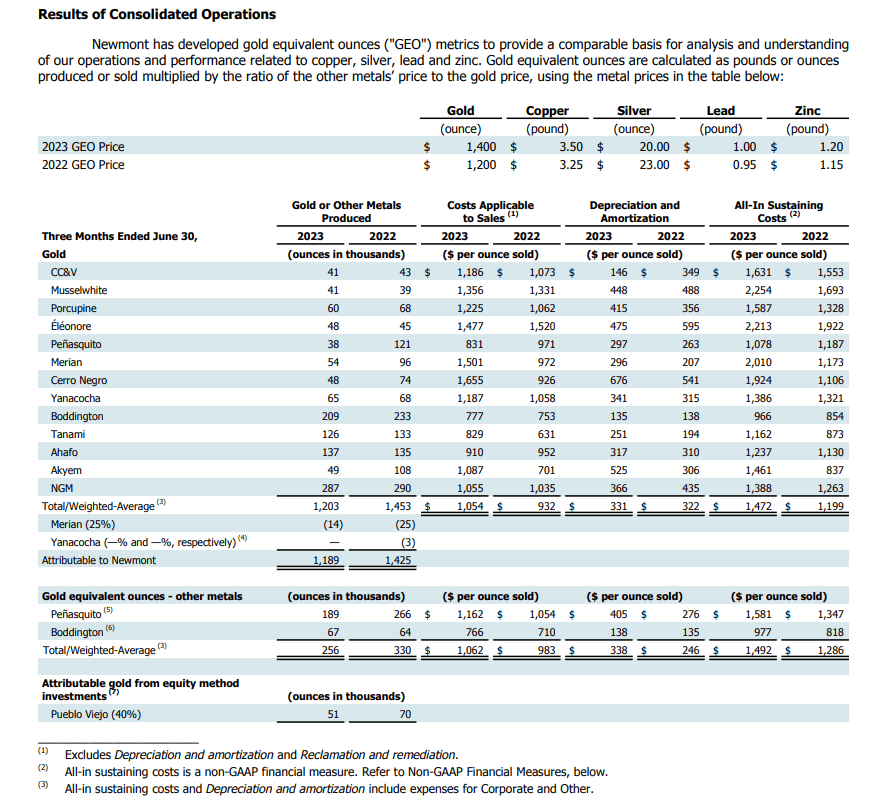
The table below shows 2Q22 and 2Q23 production per mine.
Lihir Mine in Papua New Guinea produced just 670,000 ounces last year, down from 687,000 ounces from 2Q22. The heavy rainfall's influence on the crushers' pit access and ore handling caused a higher proportion of low-grade ex-pit material to be processed in 2H23, contributing to lower output. Next year, higher-grade ore from the recently permitted Phase 14A will be mined, thus replacing lower-grade stockpiles.
Cadia is one of the lowest-cost mines in the industry, second only to Ernest Henry, with 596,900 ounces of gold produced at AISC of $45/oz. NEM approved the Cadia PC1-2 Feasibility Study, with the first ore anticipated in FY2026. The project has a 23% IRR at $1,950/oz gold and extends the mine life until well into the 2050s. This fact makes Cadia one of the mines with the longest expected LOM.
Brucejack Mine in British Columbia produced 286,000 ounces of gold at AISC of $1,157/oz. In the meantime, the mine produced a free cash flow of almost $115 million despite lower production than anticipated. Red Chris' production was disappointing due to declining copper prices and lower gold and copper output. Changing from mining in the East Zone, which has greater quantities of pyrite, to the Main Zone (Phase 7) influenced recoveries, according to Newcrest.
Penasquito strikes lasted longer than some had anticipated. A Bloomberg article states that NEM is losing $3.7 million a day. Penasquito mine is one of the flagship assets. Thus, the issues must be resolved soon if Newmont wants to improve its profitability.
Company Financials
Newmont has a robust balance sheet with adequate liquidity to meet its debt obligations and fund its expansion. The table below shows the metrics I use to assess the company's health. The data is taken from the last financial report .
| EBITDA/Interest expenses |
| 15.2 |
| EBITDA - CPX/Interest expenses |
| 4.5 |
| Quick ratio |
| 1.27 |
| Current ratio |
| 2.28 |
| Net debt/EBITDA |
| 0.97 |
| Net debt/EBITDA - CPX |
| 3.3 |
| Long-term debt/Equity |
| 28.9% |
| Total debt/Equity |
| 31.7% |
| Total liabilities/Total assets |
| 49% |
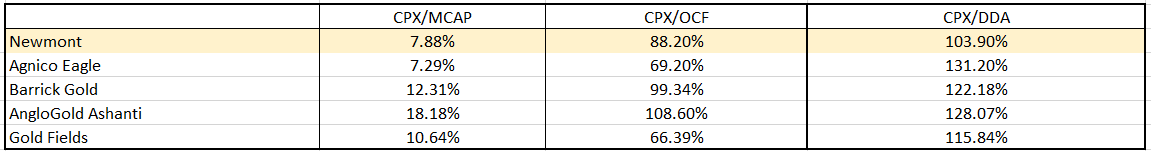
For every mining enterprise, the following mantra: the rate of reserves conversion must exceed the rate of reserves depletion. To maintain its reserve base, the company must continuously invest in CAPEX. Below, I compare Newmont with other gold majors using a few CAPEX multiples.
On the negative side is NEM's CPX/DDA ratio. DDA is depletion, depreciation, and amortization. It is a heavy burden for asset-intense businesses, such as gold mining. The only way to increase the company's reserve base and develop its mine output capacity is to maintain CPX higher than DDA. Newmont's CAPEX barely covers its DDA. On the other hand, the company has a higher than Agnico and Gold Fields CPX to operational cash flows ratio. Once the company recovers its performance, 88% CPX/OCF will reflect positively on CPX/DDA.
The poor results of the last quarter affected the company's profitability. The table below shows the profitability metrics I use to assess the company`s efficiency. The data is taken from the last financial report.
| FCF/EV |
| 1.88% |
| Sales/EV |
| 34% |
| FCF Margin |
| 4.2% |
| Gross Margin |
| 34.8% |
| ROI |
| 2.68% |
| ROE |
| (3.83)% |
I expect NEM's profitability to improve with rising gold prices. Besides that, its exposure to copper, zinc, and silver might also boost the company's profitability.
Regardless of poor results, NEM maintains dividends with respectable yields.
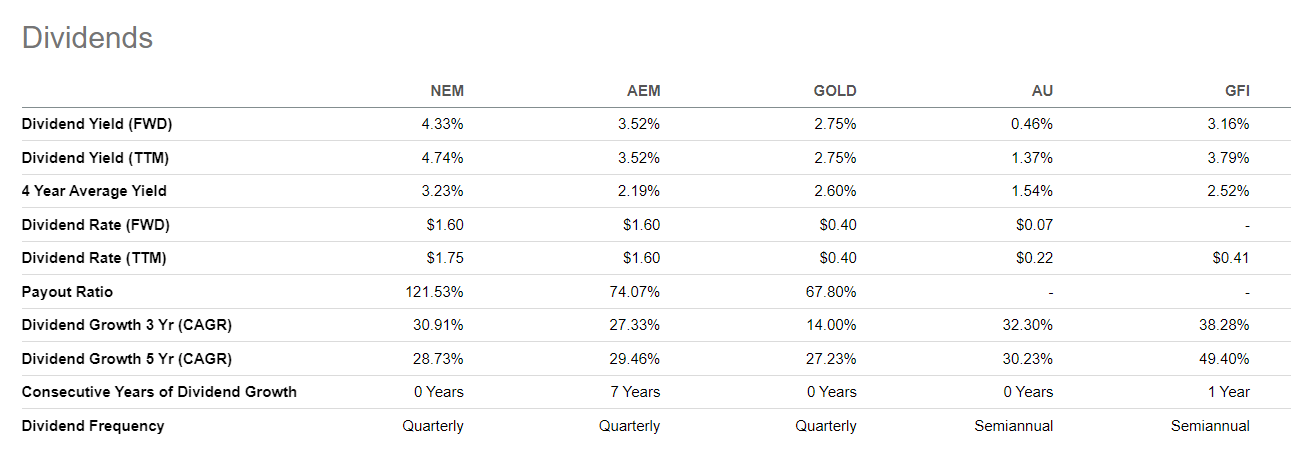
Seeking Alpha
Compared with Barrick and Agnico, Newmont pays the best dividends.
Valuation
Newmont is a gold miner, and as such, I use three valuation methods:
- Net asset value based on the company's plausible reserves, current assets, and total liabilities.
- Conventional comparison based on EV/Sales and Price/Cash Flow.
- Miner's special assessment weighting up EV to Annual production, EV to Plausible reserves, Plausible reserves to Fully diluted shares.
I calculate net assets as follows:
NAV = PR*(SP-AISC) + cash + inventories + total receivables - total liabilities.
PR (plausible reserves) = 100% * P&P Reserves + 50%*M&I Resources + 30%*Inferred Resources.
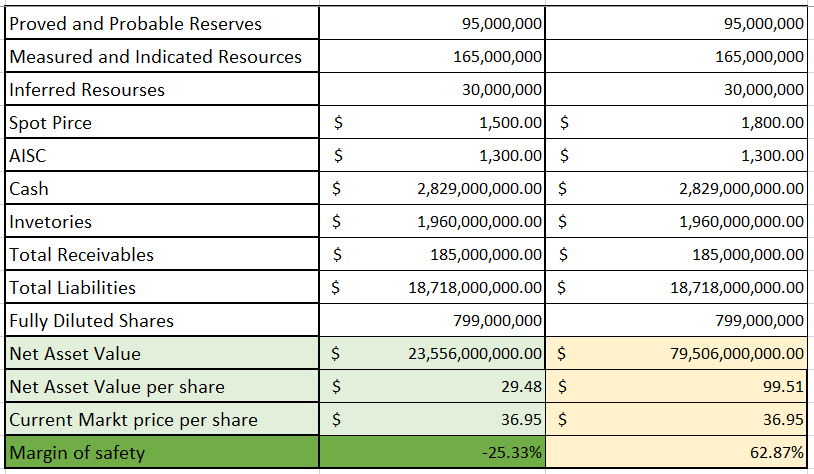
I examined two scenarios. One conservative with spot gold $1500/oz. The other is the base scenario using the $1800/oz price.
Conservative NAV per share = $29.48.
Base NAV per share = $99.51.
Current Market Price = $36.95.
Newmont is overvalued, given my conservative scenario. However, it offers 63% in my base case with gold prices at $1800/oz.
The image below compares Newmont with the following companies:
- Agnico Eagle ((AEM)).
- Barrick Gold ((GOLD)).
- AngloGold Ashanti (AU).
- Gold Fields (GFI).
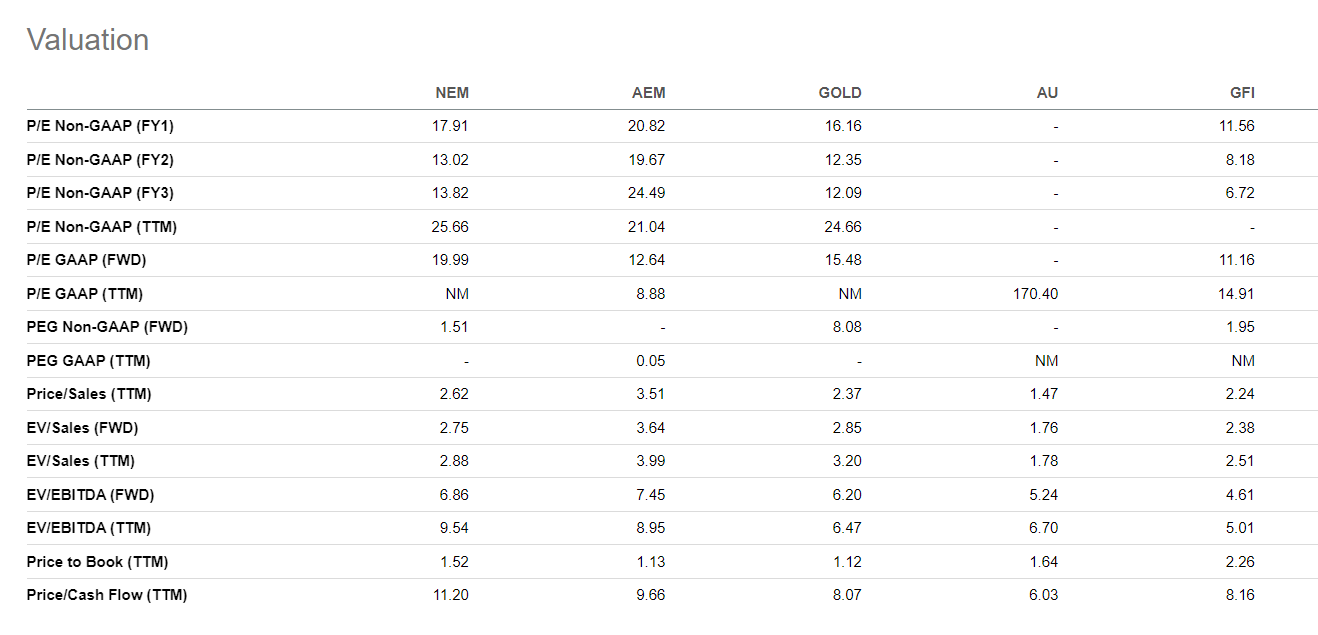
Based on EV to sales multiple, Agnico is the most expensive, with Barrick second. However, measured with a price-to-cash flow, Newmont is overvalued. The latter is due to the poor performance in the last quarter.
I compare Newmont with the same companies based on mining multiples in the table below.
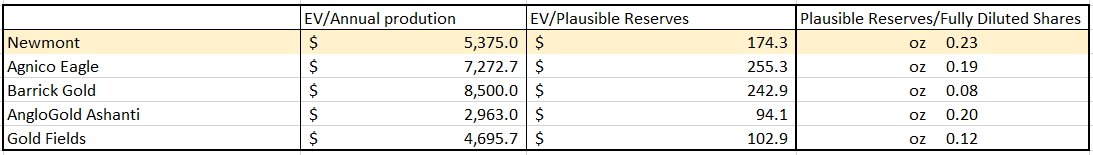
NEM share offers the most value per unit with its 0.23 ounces of gold. Compared to AEM and GOLD, the other true majors, given their size, by buying NEM we pay the lowest price ($174/oz) per ounce of plausible reserves. The same is true for the company's annual production. AngloGold and Gold Fields are cheaper than Newmont measured with EV/Annual Production and EV/Plausible reserves, but they're much smaller than the big three.
Risk
As a major gold miner, NEM is not exposed to notable financial, metallurgical, and geological risks. However, the shareholders are not insured against share dilution, which is valid with a Newcrest acquisition. For such large enterprises, the most prominent is the operational risk. Operating many assets across a few continents is a challenging task. Most of Newmont's assets are in Australia and North America. This fact partially reduces the complexity of the operations. The company owns and operates mines in South America, Africa, and Papua New Guinea. Its flagship mine, Lihir, is in PNG. I prefer to invest in companies with concentrated assets in one region, such as Agnico and Endeavour Mining (EDVMF). The former has mines primarily in Canada and Australia, while the latter focuses on the Sahel region.
Conclusion
After completing Newcrest's acquisition, Newmont will be the major of the majors. Its annual production will grow by 30% and reach 8 million ounces. The company offers a good discount based on NAV calculations with a spot price of $1800/oz. On top of that, NEM distributes dividends with adequate yields. However, investing is an art of exclusion. Generous dividends and a solid margin of safety are not enough to invest. I would like to see how the acquisition of Newcrest will contribute to Newmont's production growth. Till then, I give Newmont a hold rating.
For further details see:
Newmont: The Biggest But Not The Best Gold Major