NEX - NexTier Beats Haliburton On Value And Profitability
2023-04-06 08:01:00 ET
Summary
- Compared to Wall Street ratings, Seeking Alpha's Quant rankings are likely more objective and often provide a compelling contrast.
- While Wall Street rates HAL more favorably than NEX, Seeking Alpha's Quant rankings favor NEX over HAL.
- Side by side comparisons of value and profitability ratios also favor NEX over HAL.
- Based on fair value estimates using comparable peers' EV/Sales ratios, NEX likely has more upside than HAL.
- I therefore recommend investors buy NEX at current market prices while rating HAL at hold.
Background
I routinely survey the oilfield services sector for quality and value. I recently identified NexTier Oilfield Solutions Inc. ( NEX ) as a top OFS pick in a previous analysis, Highest Quality Oilfield Services Stocks . However, compared to Halliburton Company ( HAL ), NEX receives far less Wall Street analyst coverage and often less favorable ratings.
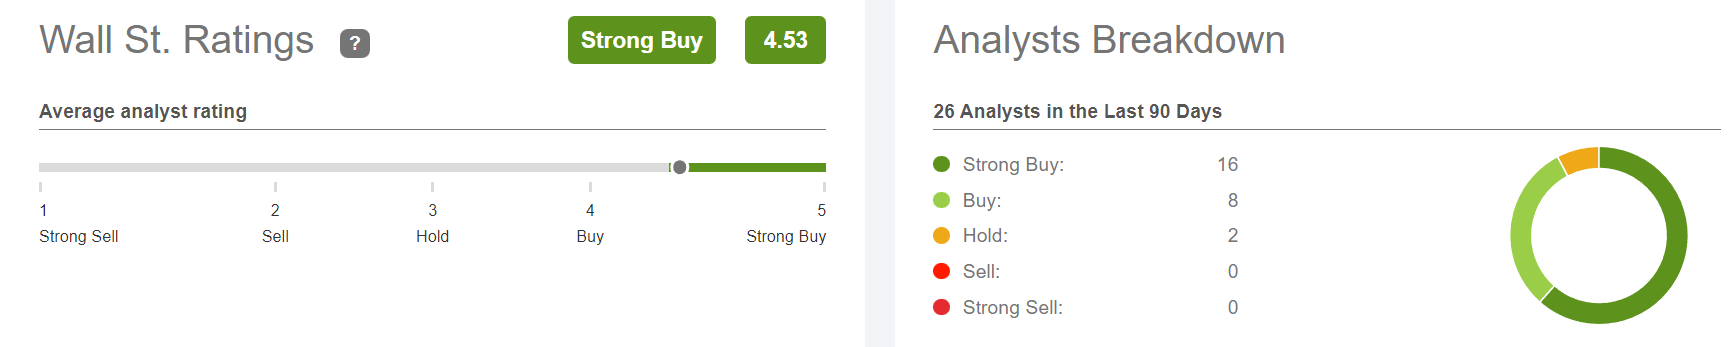
HAL Wall Street Ratings
A total of 26 Wall Street analysts have covered HAL in the last 90 days with an average strong buy rating.
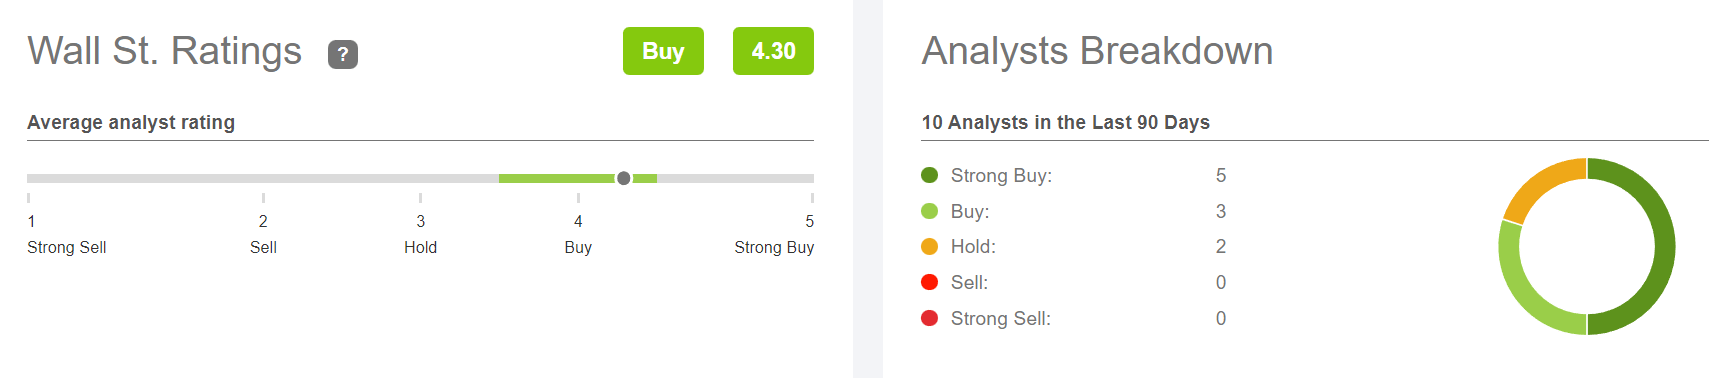
NEX Wall Street Ratings
Conversely, only 10 Wall Street analysts have covered NEX in the last 90 days with a less favorable average buy rating.
The volume of coverage is easily explained by considering that HAL market cap is $30.04B or about 15 times that of NEX market cap of $1.99B with proportional investor interest. HAL has almost 110K followers on Seeking Alpha while NEX has less than 9K followers.
Compared to Wall Street ratings, Seeking Alpha's Quant rankings are likely more objective and often provide a compelling contrast.
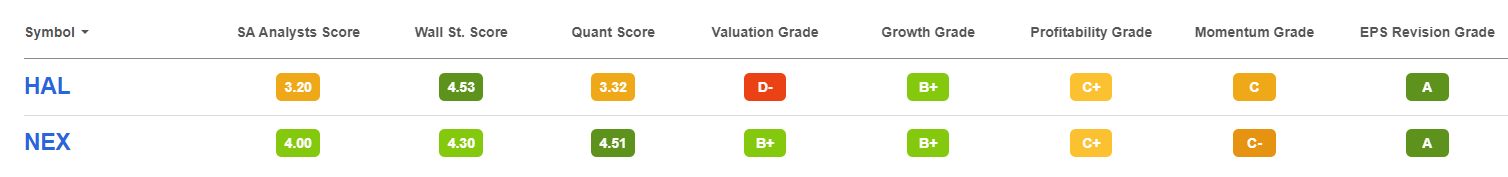
NEX and HAL Quant Ratings
While Wall Street rates Hal more favorably than NEX, Seeking Alpha's Quant rankings favor NEX over HAL. Although most Quant factors are essentially equal, NEX's valuation grade is substantially better than that of HAL.
NEX vs HAL: A Closer Look at Value and Profitability
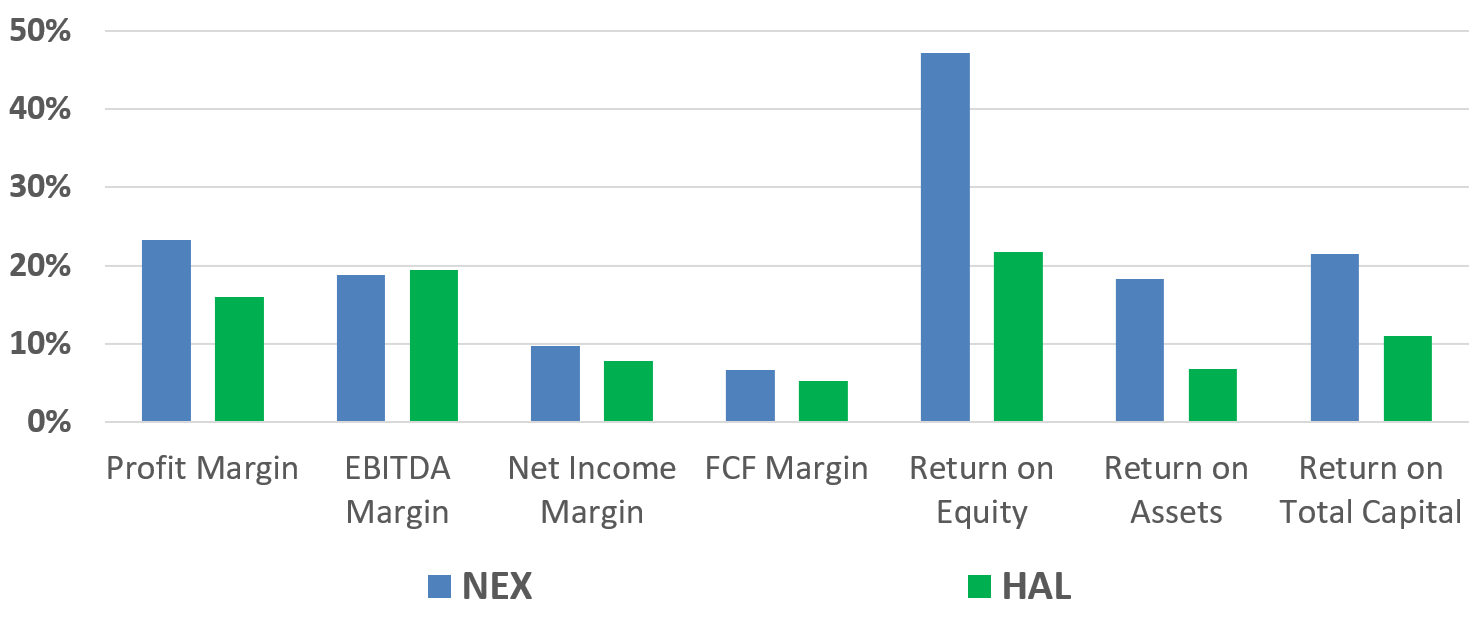
Seeking Alpha's Quant system assigned an equal profitability grade of C+ to NEX and HAL based largely on a broad comparison with energy sector values.
NEX vs HAL: Profitability
NEX and HAL values for several profitability ratios are plotted side by side. Although most ratios are comparable, NEX ratios are superior in every case except EBITDA margin.
Seeking Alpha's Quant awarded a valuation grade of B+ to NEX compared to HAL at D-. Several NEX and HAL valuation ratios are plotted side by side in the plot below.
NEX vs HAL: Valuation
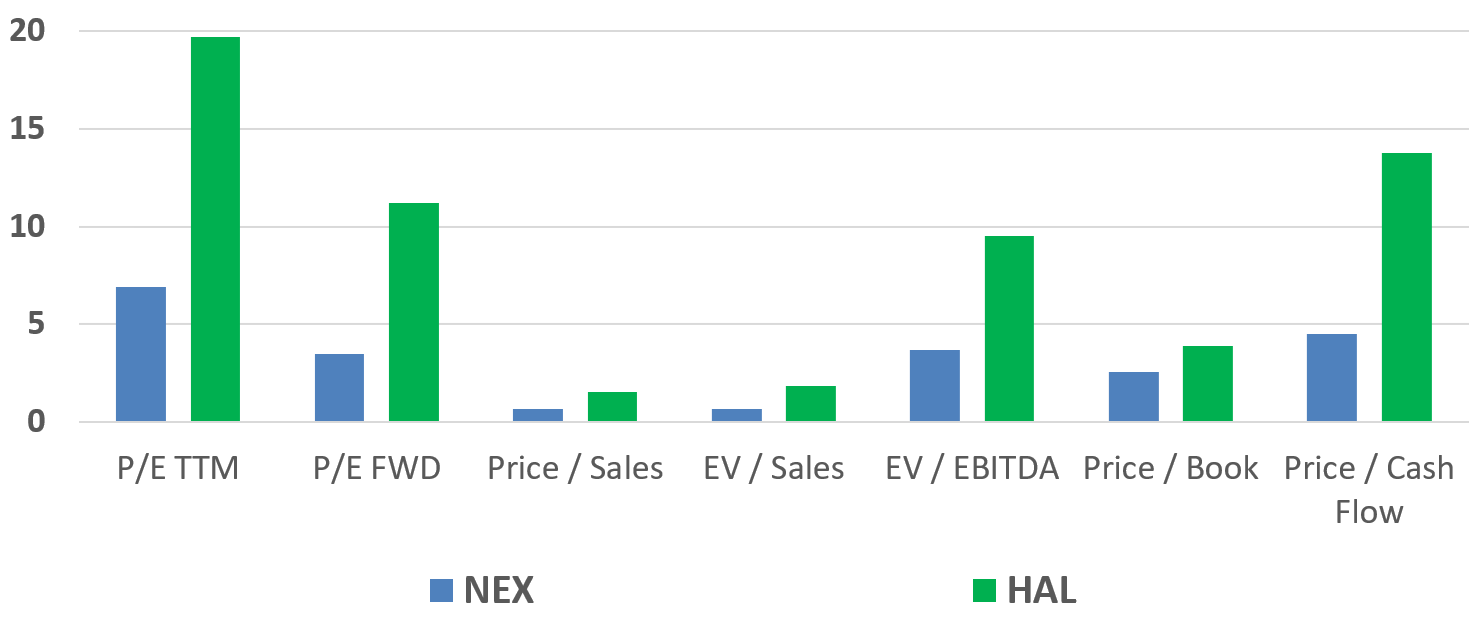
NEX valuation ratios are more favorable than those of HAL in every case and substantially more favorable with regard to several ratios including forward P/E.
NEX and HAL: Fair Value Estimates
Assuming that the industry as a whole is fairly valued, six well services peers were selected for relative valuation based on average EV/Sales.
NEX Fair Value Estimate
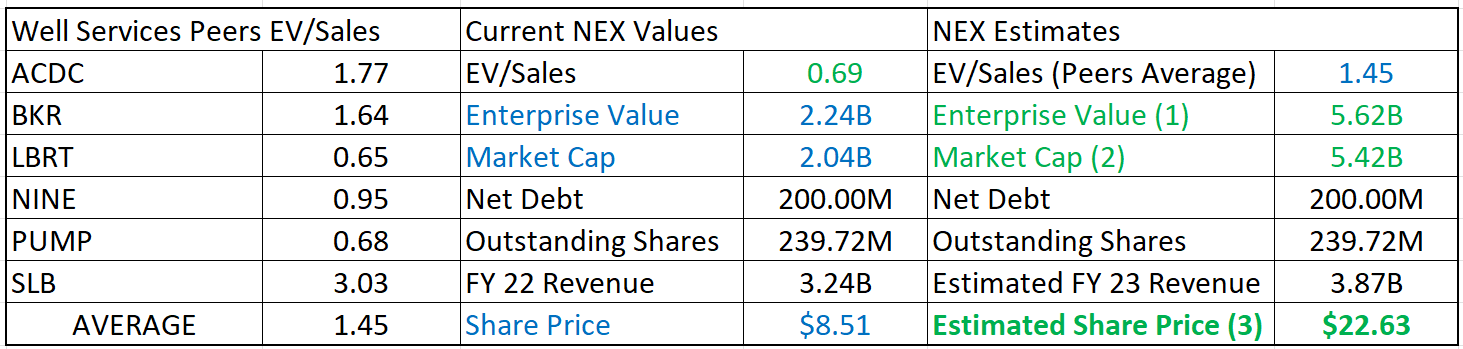
The peer average EV/Sales of 1.45 is approximately twice that of NEX's current figure of 0.69. Further, NEX FY 23 revenue is expected to increase about 20% over FY 22 revenue.
EV, Market Cap, and Share Price were estimated as follows:
- EV = Average Peer EV/Sales * Estimated 1Q 23 Revenue * 4
- Market Cap = EV - Net Debt
- Estimated Share Price = Estimated Market Cap/Outstanding Shares
Based on the peer average EV/Sales and estimated FY 23 revenue, NE's fair value share price was estimated at $22.63. Based on current share price, over 160% upside is implied.
HAL Fair Value Estimate
The peer average EV/Sales of 1.45 is notably less than that of HAL's current figure of 1.85. However, HAL FY 23 revenue is expected to increase about 16% over FY 22 revenue. HAL fair value share price was estimated at $29.56 suggesting limited upside over current market prices.
NEX and HAL Come with Risk
Demand destruction and recession are both risks across the entire oil and gas sector. Oil and gas markets are volatile and subject to fear and speculation. Recession, or even continued fear of recession, could drive energy markets down.
Well services can be a particularly volatile sub-sector and has suffered disproportionately in previous energy sector downturns. Investors would be wise to carefully considered NEX and or HAL positions within a well-built portfolio.
Final Thoughts and Recommendations
Although EV/Sales ratios are calculated from empirical data, they are also a reflection of market sentiment and outlook. While NEX and HAL EV/Sales ratios are not likely to converge with peers' average ratio, the average ratio remains a useful tool for comparable valuation. Further, fair value share prices are based on estimated 2023 revenues. Estimated fair values should therefore be viewed with some caution.
While Wall Street rates Hal more favorably than NEX, Seeking Alpha's Quant rankings favor NEX over HAL. Further, NEX profitability ratios are marginally better while NEX valuation ratios are substantially more favorable than those of HAL. I therefore recommend investors buy NEX at current market prices. However, HAL may be a great position for many investors and I rate HAL at hold.
Information is a source of learning. But unless it is organized, processed, and available to the right people in a format for decision making, it is a burden, not a benefit. - William Pollard (Physicist and Theologian)
For further details see:
NexTier Beats Haliburton On Value And Profitability