SPY - October Employment Report: Easing Of Labor Market Conditions But Can You Trust It?
2023-11-03 11:35:24 ET
Summary
- October's Employment Situation Report suggested easing of labor market conditions across a broad array of indicators.
- Manufacturing payrolls were the main contributor to the downside surprises, likely due to a greater-than-expected impact from auto strikes.
- The report has raised hopes of an easing in labor market conditions. But due to the extraordinary nature of the auto strikes it may be premature to draw firm conclusions.
The October Employment Situation Report ("ESR"), corresponding to labor market activity during the month of October 2023, was published by the BLS on Friday, November 3, 2023, at 8:30 AM EST. This report makes available an extraordinary amount of important labor market data derived from two separate surveys: The Establishment Survey and the Household Survey.
In this article, we will walk readers through a detailed breakdown of the most important employment statistics derived from both surveys. We will also discuss the likely implication of the report for bond and equity markets.
Summary Data and Analysis
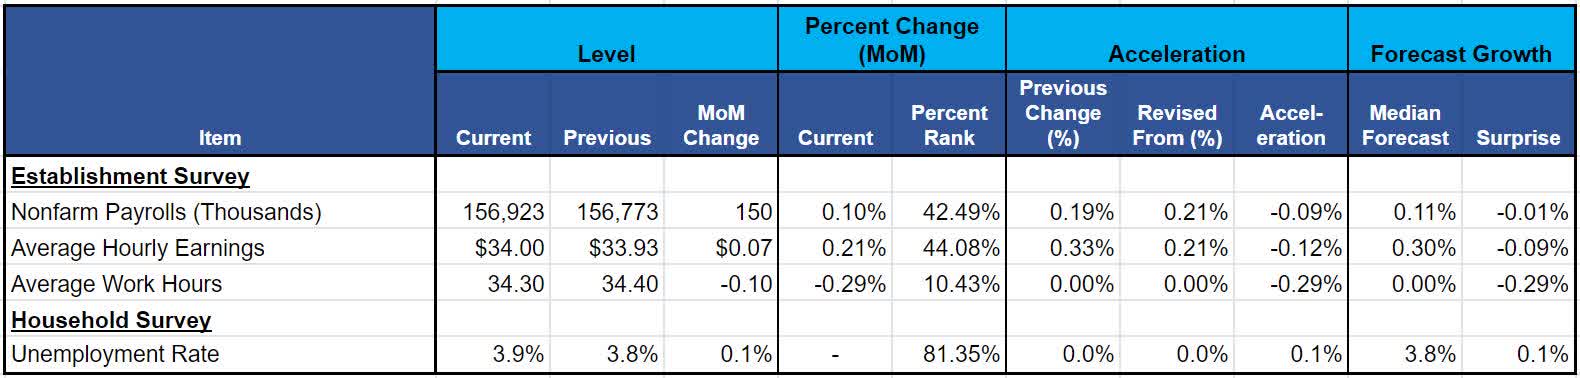
We begin our examination with summary data and analytics which we highlight in Figure 1. We recommend that readers pay particular attention to the percent rank of Month-on-Month (MoM) growth, MoM acceleration, and the surprises relative to forecasts.
Figure 1: Change, Acceleration, Expectations, and Surprise
Employment Situation Report Summary Data (BLS & Investor Acumen)
In October, the change in Nonfarm Payrolls both decelerated and surprised to the downside. The median forecast for the Nonfarm Payrolls anticipated growth to slow from 297,000 (0.19%) to 180,000 (0.11%), however, actual growth was 150,000 (0.10%) representing a -0.09% deceleration and a - 0.01% downside surprise. It is notable that nonfarm payrolls numbers for the previous two months were revised down by a total of 101,000 (39,000 for October). This indicates that job growth in the past 3 months has slowed very significantly relative to the previous 3 months.
Most of the 30,000 downside surprises can be directly attributed to the downside surprise in Manufacturing Payrolls (25,000). This in turn, was probably attributable to greater-than-expected impacts from the auto strikes. However, various economists had been predicting impacts to payrolls that were larger than reflected in the consensus numbers. From this standpoint, the downside surprise in payrolls may be “less than meets the eye.”
Establishment Survey
This section of our report will be devoted to analysis of data derived from the Establishment Survey. The first section tracks the rates of change of nonfarm payrolls over several time frames, broken down by industry groups. The second section presents a decomposition analysis of the contributions of various industry groups to the overall MoM change in nonfarm payrolls. The third subsection will review changes in average weekly hours and the fourth subsection will analyze changes in Average Hourly Earnings.
Analysis of Annualized Growth of Major Components of NFP Over Various Time Periods
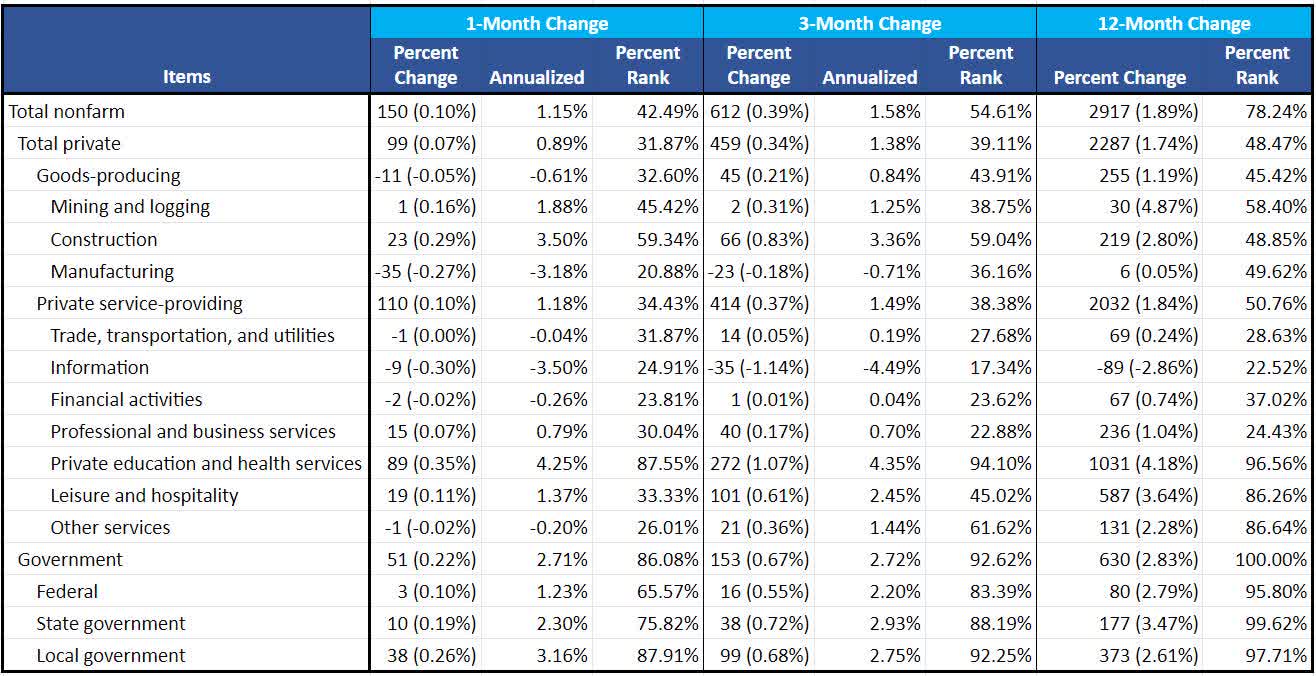
In this section we break down Nonfarm Payrolls (( NFP )) by major industry groups, scrutinizing their annualized growth rates over various time frames (1m, 3m and 12m). The purpose of this analysis is two-fold. Our first purpose is to identify which components of NFP are exhibiting rates of change that are greater or less than than the overall aggregates. Our second purpose is to determine whether, and to what extent, the rates of change of the various components are accelerating or decelerating over various time frames. Nonfarm Payroll figures are displayed in thousands.
Figure 2: Annualized Growth Rates of Key Components
Annualized Growth Rates of NFP (BLS & Investor Acumen)
It is important to note that in the past 3 month period, growth in nonfarm payrolls has decelerated very significantly compared to the 12-month growth rate. Indeed, the growth rate of private nonfarm payrolls has fallen below the historical median (31.9 percentile). Furthermore, this past month, total nonfarm payrolls growth dipped below the median (42.29%) despite the continuation of extremely robust hiring in the government sector (86.1 percentile).
Contributions to Change and Acceleration of NFP: Decomposition Analysis
In this section our analysis is focused on identifying the contributions of various industry groups to the MoM Change and MoM Acceleration of the aggregate Nonfarm Payrolls statistic. Nonfarm Payroll figures are displayed in thousands.
Figure 3: Contributions to Change and Acceleration Attributable to Major Components
Contribution to NFP (BLS & Investor Acumen)
The MoM rate of percent change of overall NFP was 0.10%, with the private sector contributing 0.06% and government contributing 0.03% to that overall figure (figures don’t add exactly to 0.10% due to rounding). Within private sector payrolls, goods-producing industries contributed -0.05% while services producing industries contributed 0.10%.
Overall, the following three components made the largest positive contributions to the rate of change in NFP: Private education and health services (0.06%), Local Government (0.02%) and Construction (0.01%). The largest negative contributors were Manufacturing (-0.02%), Information Services (-0.01%) and Financial Activities (-0.001%).
Average Weekly Hours Worked
In this section, we analyze changes in average weekly hours worked, according to payroll data. This indicator is important for two reasons. First, it is an important indicator of labor demand. Second, it has a significant impact on the earned income component of overall personal income in the U.S. economy. Readers may want to pay particular attention to average weekly hours worked in manufacturing industries as this is considered to be a leading indicator of economic activity.
Figure 4: Annualized Growth Rates of Key Components in Average Weekly Hours Worked
Annualized Growth Rates of Weekly Hours Worked (BLS & Investor Acumen)
Growth in average hours worked was quite weak this past month (10.4 percentile). When looking at the 3-month data, weakness in manufacturing (20.3 percentile) – a leading indicator of economic activity – was notable. Also notably weak has been the 3-month growth in hours worked in private service-providing industries (12.7 percentile).
Average Hourly Earnings
In this section, we analyze average hourly earnings. This is a very important statistic for two reasons. First, wages impact personal income, and therefore have a significant impact on aggregate demand in the economy. Second, wage data serve as an indicator of actual and/or potential wage pressures on US businesses. The rate of change in hourly earnings can have significant effects on business profitability and/or consumer prices.
Figure 5: Annualized Growth Rates of Key Components in Average Hourly Earnings
Annualized Growth Rates of Hourly Earnings (BLS & Investor Acumen)
Average Hourly earnings rose by 0.21% MoM, which was slightly below expectations. Significantly, this rate of wage growth is lower than the current rate of inflation. This suggests further struggles for the U.S. consumer, and potential slowdowns in real consumer spending, going forward.
The Fed will be somewhat relieved that, according to this data, wage pressures in the economy may be easing somewhat..
Household Survey
This section of this report will be devoted to examining changes in the Household Survey. We will begin by analyzing the annualized growth rates of each unemployment rate (U-1 to U-6) and then we follow this up with an attribution analysis that will identify the primary drivers of the change in unemployment rate.
Alternative Measures of Underemployment & Unemployment
In Figure 6, we scrutinize the annualized growth rates of various measures of underemployment and unemployment in the U.S., over various time frames (1m, 3m and 12m). The “official” rate of unemployment is the U-3 figure, while the other measures provide alternative measures of underemployment.. The purpose of this analysis is two-fold. Our first purpose is to identify which, if any, alternative measures of unemployment are growing at a faster or slower rate than the official unemployment rate (U-3). Our second purpose is to determine whether, and to what extent, growth rates are accelerating or decelerating over various time frames.
Figure 6: Measures of Unemployment Rate (U-1 to U-6)
Alternative Measures of Unemployment Rate (BLS & Investor Acumen)
The first thing that should be noted is that the percentile ranks of the most important measures of labor underutilization are very low by historical standards, indicating very high levels of tightness in the U.S. labor market.
Having said that, labor underutilization rates have increased quite substantially off of their lows, and at a rate that is quite high in historical terms. As can be seen from the table, there has been a substantial easing in labor market conditions in the past 3 months. For example the uptick in the 3-month U-6 rate ranks in the 93.2 percentile of all historical data.
Divergences in the behavior of the various measures of labor underutilization can sometimes provide signals about the strength of the labor market. However, over the past year, there have been no major divergences in the change in U-3 unemployment rate (official unemployment rate) and the other alternative measures of labor underutilization.
The remainder of the Household Survey section of the report will be devoted to the analysis of the U-3 measure of underutilization, which is the “official” unemployment rate.
Attribution of the Major Components of Unemployment Rate
In Figure 7, we show a decomposition analysis of the Unemployment Rate, highlighting the contributions of its two primary determinants: Unemployment Level and Participation Rate. We further break down the participation rate into changes in participation that were caused by changes in the working-age population and changes in the percentage of the working-age population that chooses to participate in the labor force.
Figure 7: Contribution of the Primary Components of the Unemployment Rate
Contribution to Unemployment Rate (BLS & Investor Acumen)
*Note: Due to the mathematical properties of ratio statistics, the estimates of contributions of specific components to the change in the unemployment rate and participation rate (both of which are ratios) are not exact, but represent very close approximations.
As can be seen above, almost all of the rise in the unemployment rate this past month can be attributed to the increase in the unemployment level, as opposed to changes in the participation rate. This is significant, as it tends to reinforce the signal of a moderate easing in labor market conditions.
Top Movers
The purpose of this section is to see what categories experienced the largest positive and negative changes this month. Positive changes in unemployment indicate that unemployment rose, while negative changes indicate that unemployment fell.
Figure 8: Top Movers MoM Percent Rank
Top Movers by Percent Rank (BLS & Investor Acumen)
In this table, we can see that the unemployment rate for young men and women rose very significantly. Also, permanent job losers rose significantly. These categories are cyclically quite sensitive, so it would be significant such trends continued.
Unemployment eased significantly in the 20-24 age group as well as the 45-54 age group.
Implications for the US Economy
The single most important background fact that readers need to keep in mind is that US labor market conditions are extraordinarily tight by historical standards. In this particular regard, the first thing that should be noted is that the current unemployment rate of 3.9% is historically in the 14.9th percentile and is 0.52% below the estimated Non-Accelerating Inflation Rate of Unemployment ((NAIRU)) of 4.4%. Put differently, the U.S. employment rate of 96.1% is significantly greater (0.52%) than the estimated rate of “full employment.” However, this past month, the unemployment rate ticked up from 3.8% to 3.9%, slightly alleviating the pressure on this particular front.
It was quite notable that private nonfarm payrolls grew this past month (and the past 3 months) at a rate that, if maintained, would ease wage pressures in the economy. We estimate that the “breakeven” level of private nonfarm payroll growth in the US (the level of payroll growth that would keep the unemployment rate unchanged) is currently around 175 thousand per month (this includes growth of the labor force and some level of increase in labor force participation). However, the actual estimated payroll growth over the past three months has averaged 153 per month. The implication is that labor market conditions, which have been extremely tight, are becoming less tight.
Turning our attention to wages, average hourly earnings grew moderately and below expectations. Wage growth is an extremely important indicator for the Fed, because a rise in wages that significantly exceeds the Fed’s target inflation rate of 2.0% would make it difficult for consumer price inflation to fall to said target. Wage growth impacts inflation via increased business costs and/or growth in consumer demand (that exceeds the potential growth in labor-constrained domestic U.S. aggregate supply). Data from this past month indicate that pressure on the wage front may be easing.
If we look deeper at the internal details of this report, there is one factor that should give pause to any “celebrations” regarding a weakening in labor market conditions: The auto strikes. The auto strikes may well have had an outsized and relatively unexpected impact on the data this month. However, the auto strikes are now over, and it remains to be seen what overall labor conditions will look like after conditions in the manufacturing sector have normalized.
Fed officials have clearly indicated that they do not believe that tight labor market conditions of the sort that have characterized the U.S. economy in the past few months are consistent with the Fed’s objective of bringing down the U.S. rate of consumer price inflation to its target of 2.0% (and stabilizing it at that level). Fed officials have indicated that monetary policy will remain tight, or even be made tighter, unless labor market conditions weaken somewhat.
So, the question is: Will this employment report change the way that the Fed and financial market participants have been evaluating the current state and/or trajectory of labor market conditions? Today’s soft data on nonfarm payrolls, unemployment and average hourly earnings will probably cause the Fed to extend its “pause” on rate hikes and slightly relax the tone of its hawkish communications.
However, due to the extraordinary impacts of the large auto strikes, I think the Fed will remain in a very cautious mode. We believe that it would be premature to make too much of the soft employment data this past month.
In sum, it is our view that the data in this month’s Employment Report would not justify a shift in the medium-term outlook for labor market conditions. However, the 1-month data were softer than expected and financial conditions are likely to ease in the short-term.
Implications for Financial Markets
The immediate reaction in financial markets has been for the implied probability of further rate hikes to fall substantially and for yields on long-term US Treasury bonds to fall very significantly. The S&P 500 (SP500) has rallied about 0.90% in sympathy with the bullish move in the Treasury market. In this section, we seek to address two questions. First, why has the market initially reacted the way it has? Second, keeping in mind that “the first move is usually the wrong move,” what can we expect going forward?
First, the initial reaction of the market is understandable in light of the softer-than expected numbers. This is one of the few months over the course of the past year and a half in which employment data has significantly surprised to the downside. At the same time, the downside surprise is “moderate,” raising hopes of a “soft landing.”
Second, going forward, we think that the initial market reaction may be maintained, as the internals of the report broadly support the impression of moderate softening in labor market conditions.
With today’s spike down in long-term Treasury yields after the Employment Report, our conviction has grown that we have seen the top in long-term yields for this cycle.
In terms of US equities, the substantial decline in long-term Treasury Yields will likely prove to be supportive of the US equity market in coming days.
Concluding Thoughts
We think that for most investors, a significant repositioning of portfolios would not be warranted in light of today’s data. Although the data were clearly bullish for bonds and equities in the short-term, our medium term outlook for long-term treasury securities remains positive and we remain cautious on equities in the medium-term. At Successful Portfolio Strategy, we have been gradually preparing for significant downside in the equity market during the next few months as well as significant upside in long-term Treasury instruments.
For further details see:
October Employment Report: Easing Of Labor Market Conditions, But Can You Trust It?