USOI - Oil's Recession Warning
2023-07-06 01:50:43 ET
Summary
- Oil prices are lackluster and barely holding long-term support levels, despite a healthy current supply-demand balance.
- US total refined products supplied have been above the 7-year seasonal average for 12 of the past 13 weeks, indicating strong demand.
- The International Energy Agency forecasts 2023 global oil demand to jump 2.4 million bbl/day to a record high of 102.3 million bbl/day.
- If OPEC and IEA estimates are correct, oil prices should trade into the $90 to $100/bbl range for Brent in the second half of this year.
- The only way to square the current weakness in oil prices with a tightening supply/demand balance is to anticipate a global recession in the second half of 2023.
Here's a question I've received a lot lately:
Why are oil prices so weak?
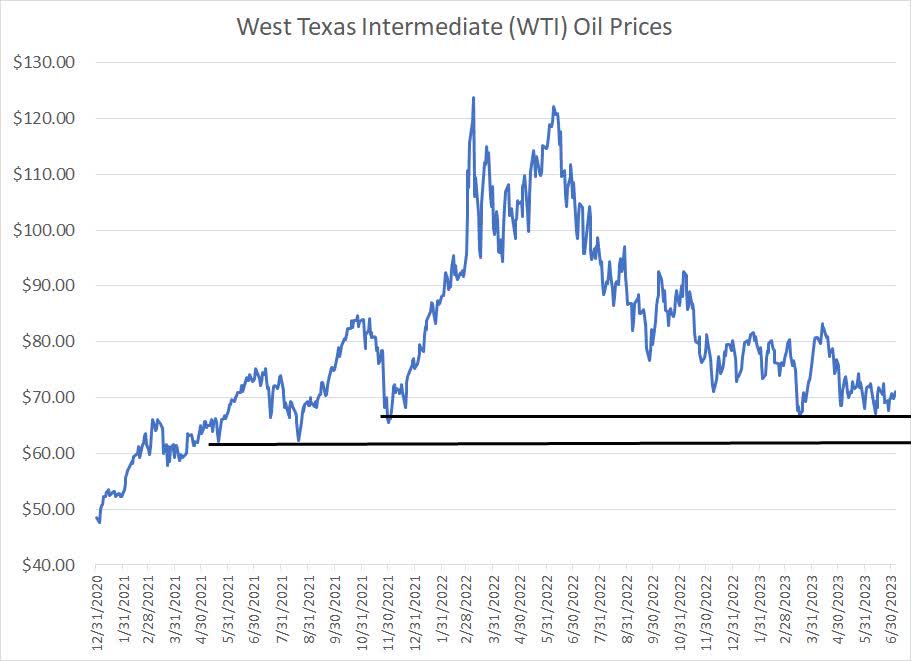
Whether you care to watch Brent or West Texas Intermediate ((WTI)), prices are not only down sharply from last year's peak, but also barely holding long-term support levels:
For WTI this roughly $63 to $68/bbl region I've marked on the chart acted as resistance for crude in early 2021 and support since the middle of the same year.
So far in 2023, we've tested that region on multiple occasions.
Supply, Demand and the "Call on OPEC"
Yet, step back from the chart for a moment, and the supply-demand balance in oil markets looks healthy and likely to tighten into the second half.
The US is the world's most visible crude oil market as the Energy Information Administration releases data on inventories, demand and refinery activity on a weekly basis.
And, for now at least, demand is holding up well:
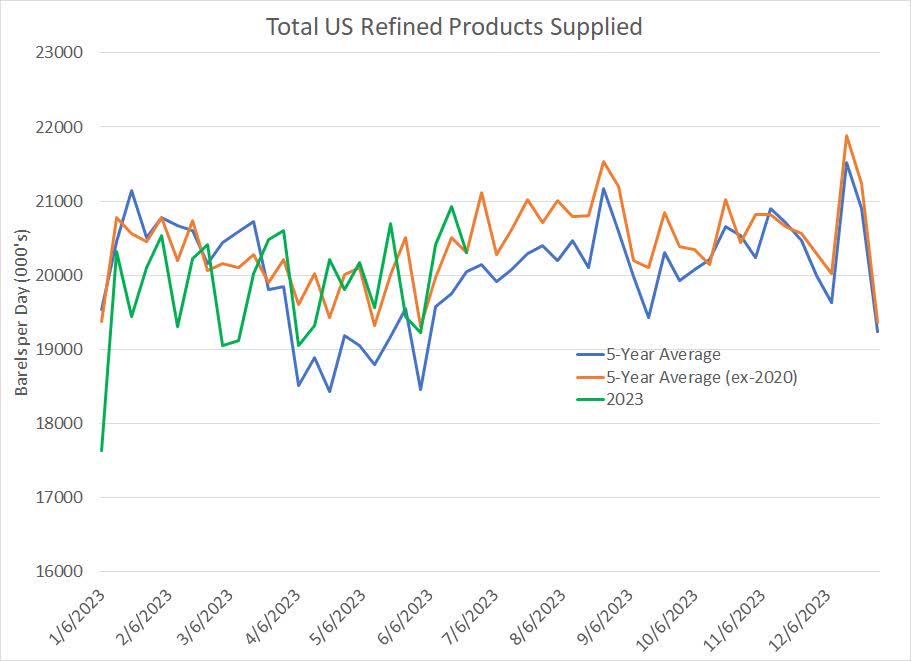
Total US Refined Products Supplied (Energy Information Administration (EIA), Bloomberg)
This chart shows total US refined products supplied, a measure of demand for products like diesel, gasoline and jet fuel. It's a seasonal chart, with the current year data in green compared to the 5-year average in blue. I've also included a modified 5-year average in orange that excludes data from 2020 when COVID lockdowns artificially depressed demand.
As you can see, weekly demand started out 2023 on the weak side; however, since April, demand has been running at or above both average lines on my chart.
You can also see this in the seasonal chart of US gasoline inventories as we approach the key summer driving season:
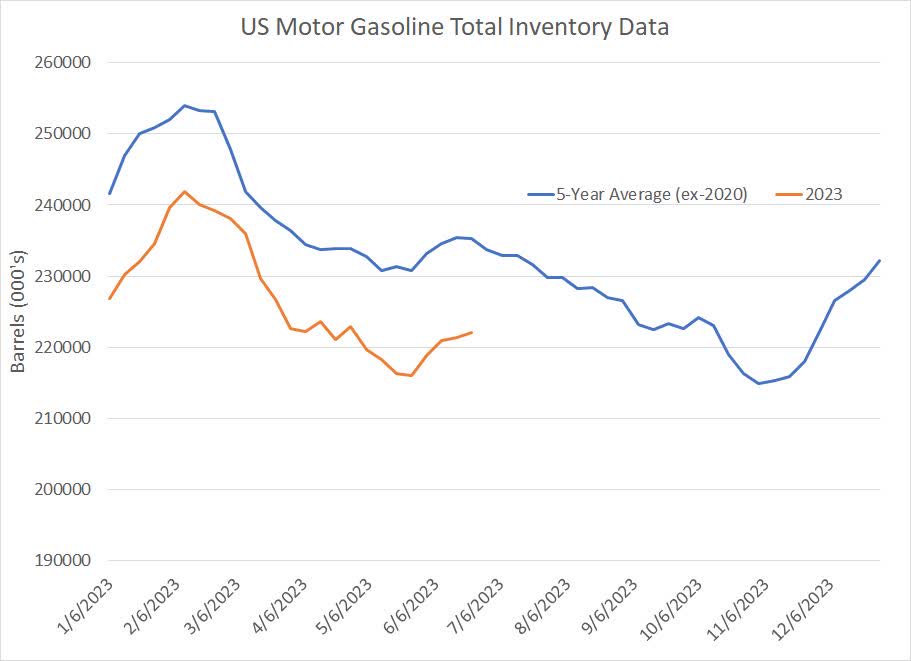
US Motor Gasoline Inventories (Energy Information Administration, Bloomberg)
This chart shows 2023 motor gasoline inventories in orange compared to the 5-year seasonal average (excluding COVID-impacted 2020) in blue. As you can see, gasoline inventories have been consistently below the long-term average this year. Indeed, as recently as the end of May, US gasoline inventories stood at the lowest seasonal levels since 2014.
And it's not just gasoline -- US inventories of oil and distillates (diesel) are both below their 5-year seasonal averages.
The latest Oil Market Report from the International Energy Agency ((IEA)) forecasts 2023 global oil demand to jump 2.4 million bbl/day this year to a record high of 102.3 million bbl/day.
And here's a look at OPEC's latest forecast:
OPEC estimates for 2023 Oil Supply and Demand (OPEC)
This chart breaks down OPEC's expectations for oil supply and demand for each quarter of this year. It's part of the cartel's monthly oil market report, in this case, the June 2023 report issued on June 13, 2023.
On the demand front, shaded in green, this table divides the world into two categories - OECD (developed) and non-OECD (emerging markets). As you can see, OPEC is looking for demand to jump from roughly 100.8 million bbl/day in Q2 2023 to 102.0 million bbl/day in Q3 and 103.25 million bbl/day in Q4.
Some of this is due to normal seasonality - 90% of the world's population lives in the Northern Hemisphere and the summer months (third quarter) represent summer driving and travel season, a period of peak demand for oil.
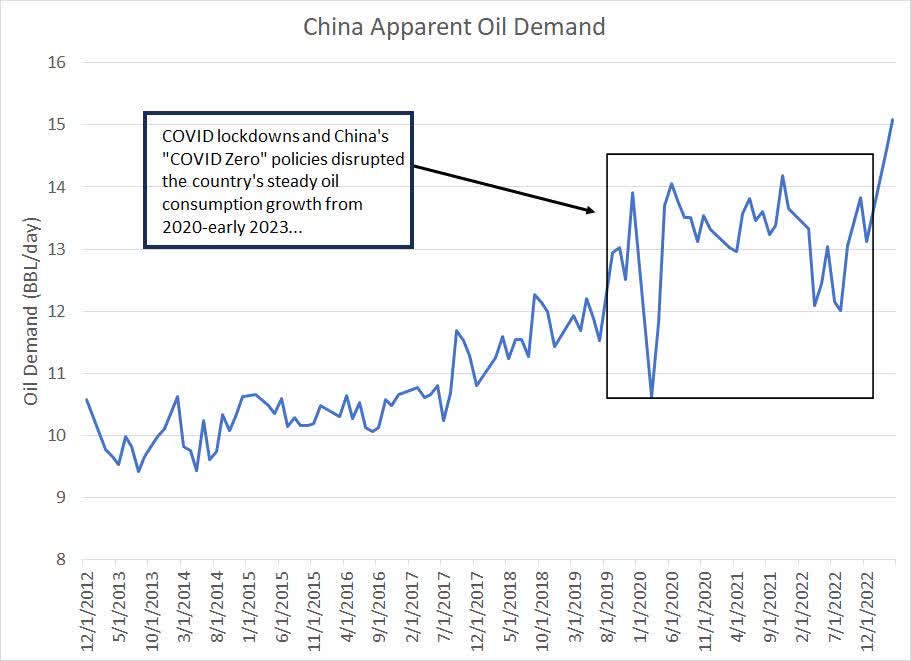
There's a second important component. You can see demand for oil in non-OECD countries like China and India is expected to see a dramatic increase from Q2 to Q4 2023, even larger than the normal seasonal uplift. That's primarily a result of expectations for a recovery in Chinese crude oil demand as the economy reopens.
Indeed, oil demand reached a record high of 15.1 million bbl/day in China for the month of April 2023, the latest month for which we have data:
Now, let's flip over to the supply side highlighted in red on my table.
As you can see, this category is broken down into non-OPEC production (production from countries like the US, Brazil and even Russia) as well as OPEC natural gas liquids (NGLs). The reason OPEC breaks out NGLs production from within the cartel is that some NGLs output is not subject to OPEC production management quotas.
That leads us to the "Call on OPEC" category. Basically, this is the amount of oil OPEC would need to produce each quarter to balance the market - the calculation is simply total oil demand less non-OPEC production and OPEC NGLs production.
If OPEC produces more than the "call," the global oil market is in surplus, and you can expect global oil inventories to rise. All things equal, an oil market in surplus is bearish and the consequent rise in global inventories is bearish crude.
The opposite applies to a deficit - if OPEC produces less than the "call," the implication is that oil-consuming countries would need to draw down inventories to meet demand and falling inventories are likely to act as a tailwind for prices.
As you can see, in Q1 the call on OPEC was 28.37 million bbl/day and the cartel produced 28.82 million bbl/day, which means the global oil market was oversupplied to the tune of about 450,000 bbl/day. However, look at how the call is projected to evolve over the course of the next 3 quarters.
In Q2 - the current quarter - the "call" is roughly flat with Q1 because seasonally low demand in Q2 is offset somewhat by an expected decline in non-OPEC production. Some of that is the result of seasonal maintenance and normal weather-related production disruptions in Q2.
However, OPEC also revealed the cartel's production was 28.773 million bbl/day in March, 28.529 in April and 28.065 in May 2023.
This decline in OPEC production is largely the result of announced production cutbacks with steeper production cuts phasing in starting on May 1st. The implication here is OPEC production was above the "call" in March and April, but fell below the "call" by May 2023. That suggests global oil inventories should have begun to draw down in May-June.
Now, let's step this analysis forward. Saudi Arabia announced a unilateral production cut of 1 million bbl/day in July 2023; on Monday, July 3rd Saudi Arabia announced it will prolong its 1 million bbl/day through August 2023 and potentially longer than that. On top of that announcement, Russia has announced a 500,000 bbl/day output reduction for August 2023.
These represent voluntary production cuts above and beyond what the countries have already agreed to do in OPEC's ongoing production management plan.
It's quite possible Saudi Arabia will decide to extend that cut through the rest of the year, especially if Brent oil prices remain below that $80/bbl region. And, while Russia has a checkered history of abiding by output reductions, Saudi Arabia has a long history of following through on planned cuts.
This implies OPEC production falling further from that 28.065 million May 2023 level by July 2023. A drop to 27.5 million bbl/day on average in Q3 (higher than Saudi Arabia's latest cuts would suggest), for example, would imply an oil market undersupplied by some 2.35 million bbl/day for Q3 2023 (the current quarter) alone.
Of course, the situation would grow even more dire into yearend should OPEC's estimates of a Q4 2023 "call" of almost 30.6 million bbl/day prove valid. Should the oil market truly face a deficit of 2+ million bbl/day in Q3 and Q4, or even 1 million bbl/day, that would be unequivocally bullish for oil prices into the second half of the year.
Here's a table showing OPEC's estimates for how the oil market evolved in 2022:
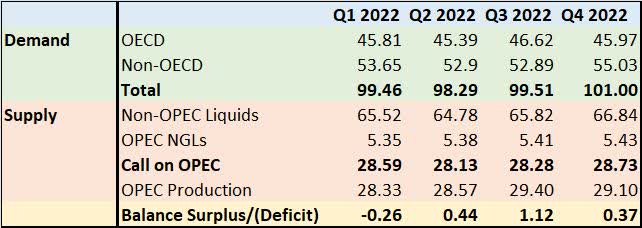
Last year, based on OPEC estimates, the oil market was actually oversupplied in every quarter except Q1 2022; yet, oil prices still spiked into the summer based on fears Russia's invasion of Ukraine would disrupt the supply side of the equation.
In the second half of this year, however, there's risk of a real supply-demand deficit based on OPEC's estimates that would result in an unsustainable draw on global commercial oil inventories.
Thus, the outlook for oil supply and demand into H2 2023 from OPEC - and broadly similar estimates from IEA - do NOT match the reality on the ground of oil testing multi-month lows in the high-$60's to low-$70's/bbl for WTI and low to mid-$70's/bbl for Brent.
Something has to Give
There are two possibilities:
Pricing in the oil market is "wrong," and we'll see significant re-rating of prices higher into H2 2023 as demand picks up, and OPEC supply is inadequate to cover the "call" and fill the gap.
If demand holds up per OPEC's latest estimates, I'd expect to see Brent oil prices rise to the $90 to $100/bbl range. That's because the International Monetary Fund ((IMF)) estimates Saudi Arabia needs Brent oil prices near $81/bbl just to balance its budget, and I suspect they'd look for a comfortable margin over that level before considering easing up on production cutbacks aimed at supporting prices.
Alternatively, it's possible OPEC and IEA are wrong, and demand estimates are way off for H2 2023. Should the expected H2 2023 demand surge not materialize that would put the call on OPEC well below the 29.9 to 30.6 million bbl/day estimates outlined in OPEC's June report.
Non-OPEC supply simply can't adjust higher fast enough to drive a second half glut of oil that would account for the discrepancy between official estimates and the current price action in global oil markets.
So, the only scenario I can see that could forestall the OPEC-projected tightening of the oil supply/demand balance into H2 2023 enough to account for current lackluster crude oil price trends is a global recession that drives down demand.
Indeed, the current situation echoes 2008:
OPEC Supply and Demand estimates for 2008 (OPEC )
This chart presents forecasts and data from OPEC's December 2007 and January 2009 Oil market reports.
In particular, if you look at December 2007 estimates, OPEC forecast global oil demand to recover from a seasonal low in Q2 2008 of 85.62 million bbl/day to reach 88.7 million bbl/day in Q4 2008. The absolute level of these numbers is different from the current oil market because demand is much higher today than in 2008; yet, the pattern is similar -- a strong second-half recovery in demand after a weak start to the year.
Look at how the year actually evolved based on the latest data OPEC had as of January 2009.
Actual demand was far lower than OPEC forecast in late 2007 in every quarter of the year and OPEC overestimated global oil demand to the tune of almost 1.6 million bbl/day in Q4 and 2.38 million bbl day in Q4.
That's a huge miss. The global economy entered recession around the end of 2007, but the financial crisis at the heart of the downturn intensified in the summer and fall of 2008, leading to a sharp drop in demand.
As it turned out, OPEC's forecasts for non-OPEC supply and OPEC NGLs were also too high in December 2007. Those two trends are related because the collapse in demand in the second half of 2008 coupled with a collapse in prices prompted non-OPEC producers to cut back on activity and output.
However, of course, the decline in output wasn't rapid enough to offset the hit to demand that year.
That's why the call on OPEC crude -- the amount of oil needed from OPEC -- was much lower than the cartel anticipated to the tune of 610,000 bbl/day in Q3 2008 and 900,000 bbl/day in Q4 2008.
I'm not saying global oil demand will collapse in the second half of this year as it did in 2008. The 2007-09 Great Recession and financial crisis was arguably the most severe and intractable economic downturn since the 1930's and the economy hit a wall starting in Q3 2008, leading to the extreme drop in demand.
However, with OPEC cutting oil production, and demand holding up well, the only way to square recent weakness in oil prices with OPEC/IEA estimates for tightening supply/demand balances in the second half is if OPEC/IEA demand estimates are far too high.
In my view, oil prices do not have significant downside risk from the current quote unless the recession proves far more severe than anything currently anticipated. Saudi's unilateral cut starting July 1st and now extended through at least August, suggests the Kingdom is looking to support oil prices even if that means there's a hit to their oil revenues in the short run.
However, when given the choice of betting the oil market is right or the IEA and OPEC are right about the global economy, I'll always side with the collective knowledge of the millions of traders who comprise the market.
There's also a major discrepancy between the message in commodity and equity markets right now.
Favor Gas over Oil
Given the uncertainty surrounding oil demand into the second half, I continue to see more upside in natural gas focused exploration and production companies (E&Ps) than in oil-focused producers.
I covered the outlook for natural gas in my May 23, 2023 article on Seeking Alpha titled " United States Natural Gas Fund: Much Better Ways to Go Long Natural Gas " and I penned a bullish piece on Southwestern Energy ( SWN ) on Seeking Alpha back in May 4th " Southwestern Energy: Undervalued Natural Gas ."
The key point to note is that to derive a fundamental target for SWN well above the current quote, one doesn't need to pencil in a major recovery in US gas prices. Rather, should gas prices simply evolve according to what's already priced into the futures curve, SWN looks cheap.
An earlier version of this article was originally posted on The Free Market Speculator .
For further details see:
Oil's Recession Warning