PCTY - Paylocity: Now Looking Cheap Using Cash Flow Returns On Investments Analysis
2023-11-19 10:58:42 ET
Summary
- Paylocity appears undervalued using Cash Flow Returns On Investments based DCF tools.
- Given stronger growth and improving margins, the company deserves to be on higher valuation multiples compared to peers.
- We initiate Paylocity with a buy rating and FY24 warranted DCF value of $206.
Paylocity is trading (NASDAQ: PCTY ) approximately 35% below its 52-week high and over 50% from an all-time high of $314. This is a high-growth high-quality company that is not only profitable but is demonstrating improving margins and efficiency.
As the company matures, revenue growth is expected to be slower. Given management's FY1 and long-term revenue growth target of 20%, along with improving margins, we would like to see PCTY on a higher valuation multiple. The company is currently trading at an FY1 PE of 25x and FY2 of 22x.
PCTY is looking undervalued using our associate's ROCGA Research valuation tools, a methodology based on Cash Flow Returns On Investments. PCTY also looks undervalued when compared to its peers.
The Company
PCTY provides an array of human resource management tools to its 36,200 clients. These include payroll, benefits, tax, recruitment, employee management, and among others, time and labor management.
They invest heavily in new technologies to provide new features and functionalities. Including capitalized R&D, total expenses were $108.5m, $145.1m, and $219.6m for the years 2021, 2022, and 2023, respectively. This equates to 17.1%, 17.0%, and 18.7% of total revenues.
Revenue retention is 92% for PCTY. This is at par with Automatic Data Processing (NASDAQ: ADP ) but significantly higher than Paychex (NASDAQ: PAYX ) 82-83%. The number of clients has been increasing at a 12% compound annual growth rate.
Financials
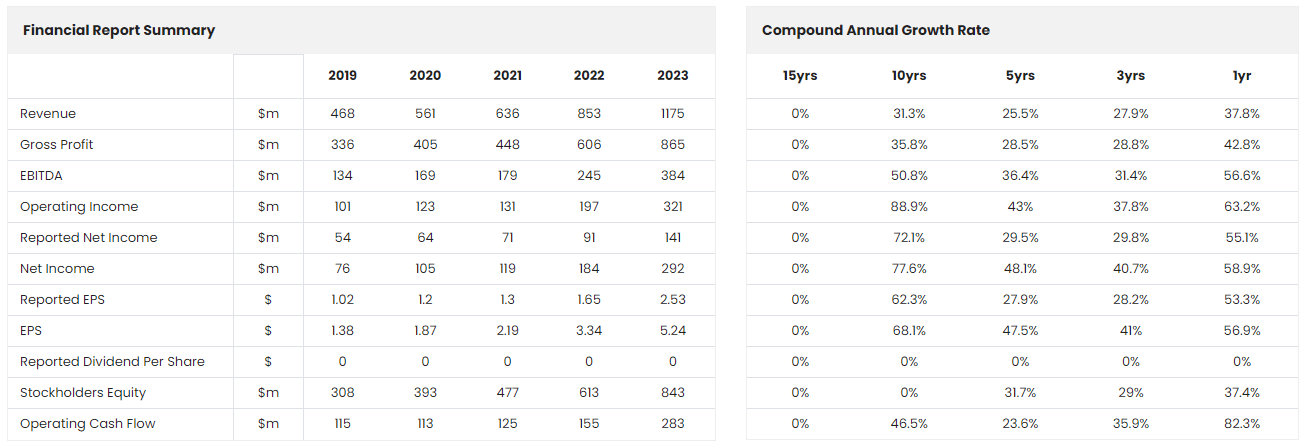
PCTY reported its Q1 results ending June 2023 on the 2nd of November. Revenues rose 25% and non-GAAP EPS rose 43% to $1.4 per share. Though higher than industry averages, this is significantly lower than the company's historical growth rates, revenue CAGR of 31.3%, and EPS of 68%. Management estimates 19% revenue growth for Q2 and reiterated its guidance of 20% revenue growth for FY24. Investors were disappointed and share prices fell 15% from $171.5 to $145.
Historically, PCTY has shown spectacular growth, while improving margins and efficiency. We can see in the figure above that growth across the board, ranging from revenues to EPS has been strong.
Paylocity Profitability And Gross Margins (ROCGA Research)
In the figure above, shorter-term margins and returns are greater than the longer-term numbers. This is an indicator of improving margins, as can be seen in the gross margins chart.
So far we have seen strong growth, improving margins, and stable asset turnover, all pointing to improving returns. Asset turnover is the amount of assets (investment) required to generate revenues.
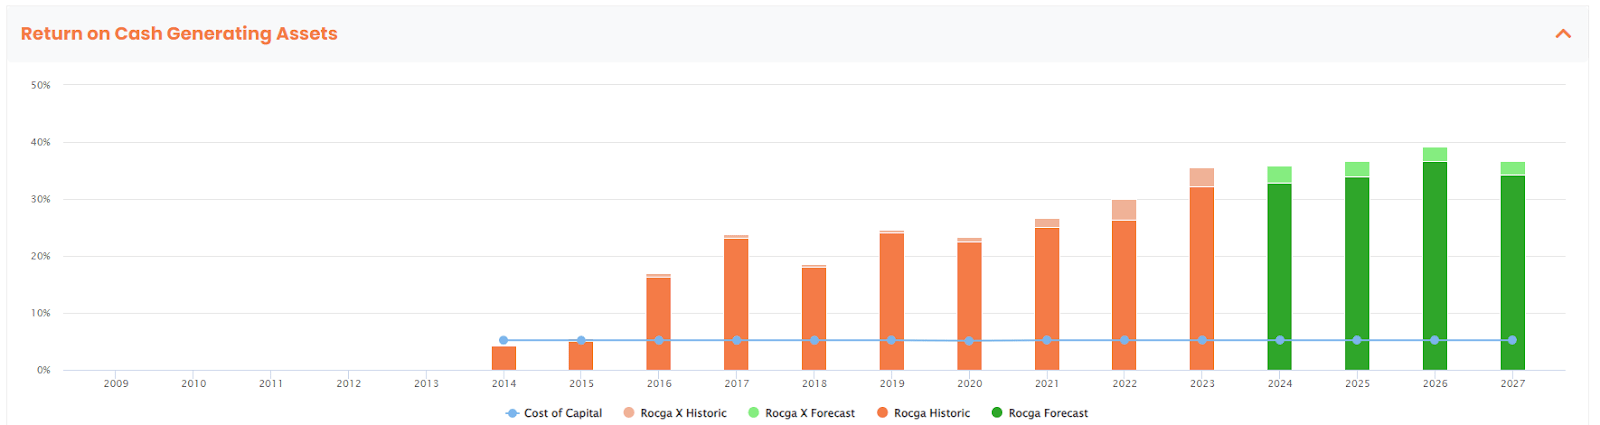
We see improving Returns On Cash Generating Assets (ROCGA), a methodology based on Cash Flow Returns On Investments, a measure of economic performance. To add value, you need returns higher than the cost of capital and growth. PCTY fits all the criteria required to be a serial value creator.
More information on how ROCGA is calculated including gross assets, gross cash, and Cash Flow Returns on Investments can be found in Bartley Madden's paper " The CFROI Life Cycle ". Bartley Madden has been a significant contributor to the Cash Flow Returns on Investment methodology.
Risks
PCTY does not score well on share price performance momentum and there may be some further downside before this becomes a deep-value stock. However, given that slower growth seems to be baked into the current share price, further downside risks seem to be minimal. Further risks faced by PCTY is the possibility of client poaching by competitors, but given the retention rates, and potential issues with switching providers this would be minimal. Also, switching can go both ways.
On the plus side, PCTY has a strong balance sheet with no outstanding debt and cash as of September 2023 of $305m.
The company is highly cash generative giving it room to grow organically, as well as take on debt for significant inorganic growth.
Conventional Valuation
As mentioned earlier, PCTY is currently trading at an FY1 PE of 25x and FY2 of 22x with revenue growth expected to be approximately 20% for FY1 And 17.5% for FY2, and EPS growth of 18% for FY1, tapering to 13.7% for FY2.
Automatic Data Processing’s FY1 PE is 25x and FY2 is 22.9x. These are very similar, but revenue growth is mid-single digit and EPS growth is around the 10% mark, half of PCTY growth.
Paychex FY1 PE is 24.9x and FY2 is 23.4x. Revenue growth is estimated to be mid-single digit and EPS 10.5% for FY1 and 6.4% for FY”, significantly lower than PCTY.
Both these companies enjoy similar valuation ratios, but PCTY is offering significantly superior growth.
Cash Flow Returns On Investments Valuation
To value a company, we use our affiliate ROCGA Research's quantitative and systematic Cash Flow Returns On Investments based DCF valuation and modeling tools. The first step involves modeling the company, back-testing the valuation for correlation with the historical share prices, and using that same model to forecast forward.
Value is a function of returns and growth in cash-generating assets. The total value of the company takes into account the present value of existing assets and the present value of growth.
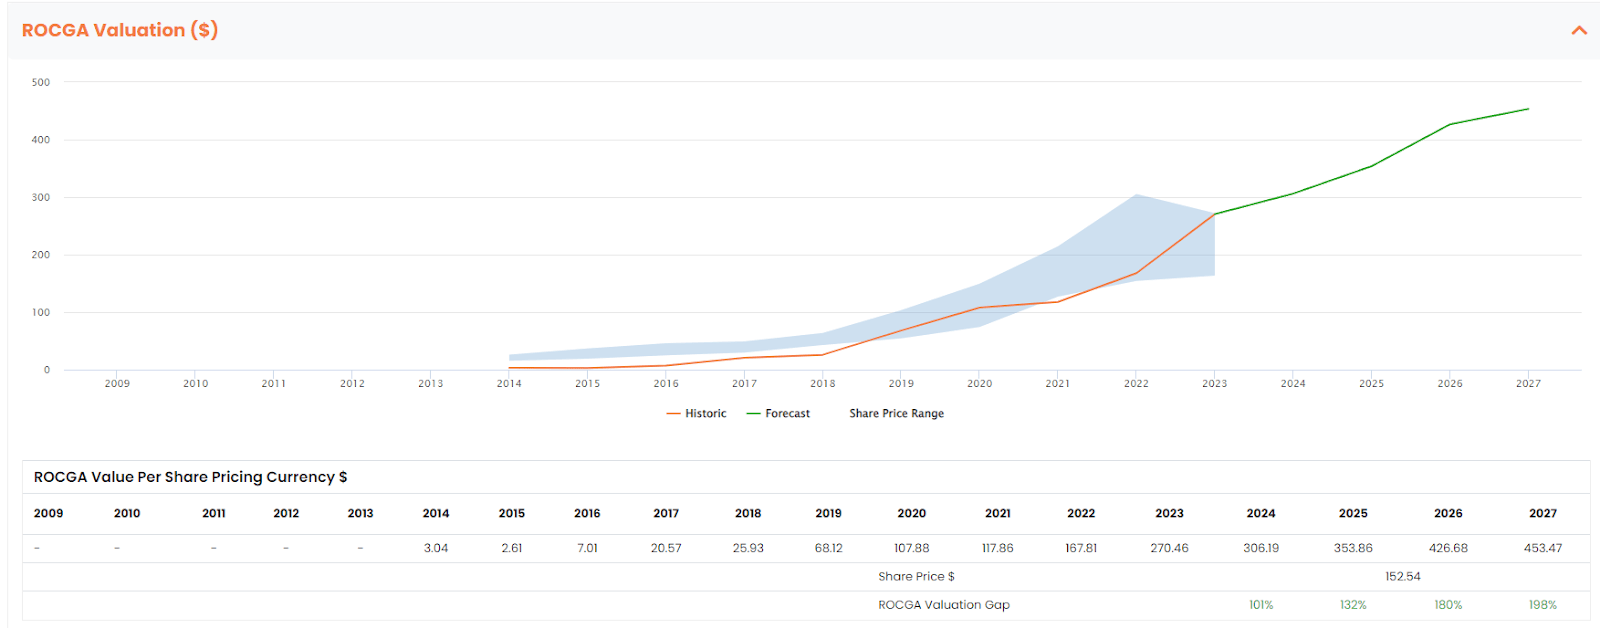
PCTY Default Valuation (Chart created by the author using ROCGA Research platform)
The blue band above represents the share price highs and lows for the year and the orange line is the DCF model-driven historic valuation. The green line is the forecast warranted value derived using the same model along with consensus earnings and default self-sustainable organic growth. Self-sustainable organic growth is a ratio of investable free cash as a ratio of invested capital. This has been capped at 15%. We have used consensus EPS of the forecast years.
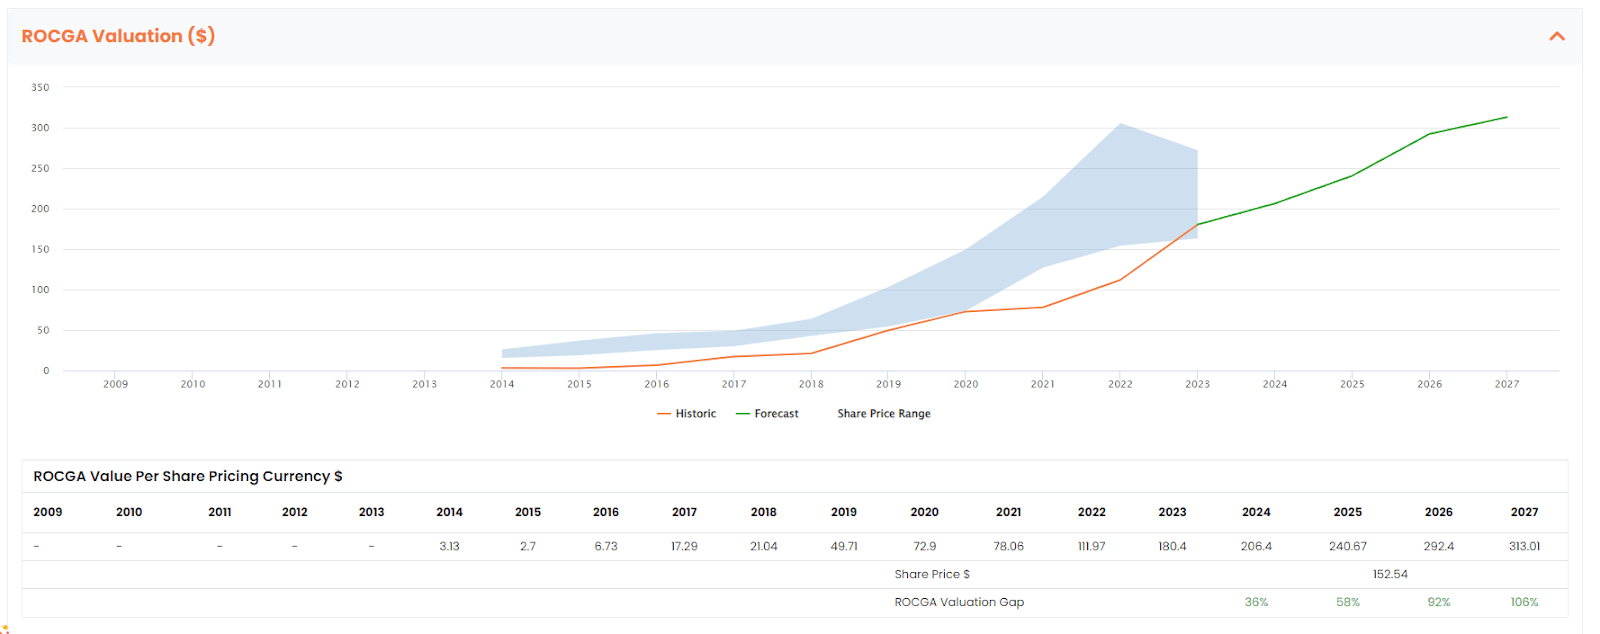
The valuation model above has worked well in the past, but we know that the dynamics of PCTY have changed to a more mature and lower-growth company. We amended the model from a life cycle stage 2 to a life cycle stage 3 to evaluate a price target for FY24 and FY25.
PCTY Adjusted Valuation (Chart created by the author using ROCGA Research platform)
We see a potential upside of 36% with an initial target price of $206. In the chart labeled Returns On Cash Generating Assets, we see the forecast returns are to remain high and well above the cost of capital. With revenue growth of 20% and high returns, the model points to the company creating more value over the years.
Conclusion
If we examine PCTY from conventional valuation analysis, given its superior growth, it should be trading at a premium to Automatic Data Processing and Paychex. Our Cash Flow Returns On Investments based DCF valuation tools point in the same direction.
The same model applied to Automatic Data Processing gives a potential upside of 12% and a downside of 30% for Paychex. Of the three, PCTY is our choice and we initiate with a buy rating.
For further details see:
Paylocity: Now Looking Cheap Using Cash Flow Returns On Investments Analysis