PNC - Preferreds Weekly Review: Taking A Longer-Horizon View On Preferreds Valuations
- We take a look at the action in preferreds and baby bonds through the first full week of July and highlight some of the key themes we are watching.
- Preferreds continue to recover slowly from their previous drop in early June, supported by lower credit spreads.
- We take a longer-term view of preferreds valuations to place the current sell-off in context.
- And highlight some ex-div-related price action in NYMT preferreds.
This article was first released to Systematic Income subscribers and free trials on July 11.
Welcome to another installment of our Preferreds Market Weekly Review, where we discuss preferreds and baby bond market activity from both the bottom-up, highlighting individual news and events, as well as top-down, providing an overview of the broader market. We also try to add some historical context as well as relevant themes that look to be driving markets or that investors ought to be mindful of. This update covers the period through the first full week of July.
Be sure to check out our other weekly updates covering the BDC as well as the CEF markets for perspectives across the broader income space.
Market Action
Preferreds had a good start to the month as the broader rally in credit has been a strong tailwind. Even the back-up in Treasury yields this week was not enough to push the sector into negative territory. That said, June was clearly a very tough month and it will take some time for the sector to claw its way out.
Systematic Income
A sharp tightening in credit spreads caused the overall yield in the sector to head lower, however it still remains historically elevated and attractive in our view.
Systematic Income Preferreds Tool
Market Themes
A good way for investors to maintain a sense of direction and context is to simply understand how the current valuation of any given asset fits into its broader history. In short, a sense of whether the asset looks expensive or cheap historically can allow investors to see how it corresponds to the underlying fundamentals as well as the investor's outlook for the medium term macro picture. In this section we briefly review longer-term valuations of the preferreds sector from a few different angles.
Let's first take a look at preferreds and Treasury yields over the last decade shown in the chart below. What we see is that outside of the very brief COVID shock, preferreds yields are currently very elevated. This is both a function of the simple fact that Treasury yields are elevated as well as that credit spreads (i.e. the differential in yields between preferreds and Treasuries) have risen as well. It's also important to highlight that the chart below is from 27-May and the preferreds sector has fallen around 5% since then i.e. yields have risen another 0.3% or so.
UBS
Spectrum Asset Management offer another kind of valuation perspective. They compare the current market to three previous credit cycle bottoms in preferreds (they don't include the COVID period) in 2013 (the original taper tantrum), 2016 (the Energy shock) and 2018 (the auto-pilot tantrum).
What we see is that at the end of May, the preferreds market was trading at a credit spread of 3.1% versus an average of 4.25% in these three periods. However, if we take June's weakness into account, it now brings us pretty close to the average valuation of these periods.
Spectrum
Overall, these two perspectives show again that preferreds market is trading at very attractive valuations. None of this suggests that the sector is immune from more pain but adding at current levels is not an obviously dumb thing to do in our view.
Market Commentary
There was some unusual price action the previous week which is worth highlighting. Two of the three NYMT preferreds fell sharply by around 4% despite a stable market overall and no changes in fundamentals.
The culprit as the chart below suggests was likely the ex-div date. Normally, the total return of the stock would be zero on the ex-div date as the drop in price makes up for the dividend that falls out. However, often what we see is a drop in the price way in excess of the size of the dividend. Often, this is likely because of investors playing dividend capture and selling on the ex-div date. And, as the results show, it probably doesn't work out very well for some of those who do. In fact, we would take the other side of the ex-div game, buying on the sizable drops (in total return terms) on the ex-div date as the drop then tends to be reversed over the following week just as it was in this case.
Systematic Income Preferreds Tool
We continue to like NYMT preferreds. We are currently neutral between [[NYMTM]] and [[NYMTN]] as we see them fairly priced relative to each other. As the following chart shows NYMTN does have a sizable yield advantage over NYMTM for a couple of years which then turns into a smaller disadvantage over a longer period of time.
Systematic Income Preferreds Tool
Stance And Takeaways
We have not made changes to our allocation stance this week as the market has, uncharacteristically, been pretty stable since the second half of June. This has been due to the normalization in the relationship between Treasury yields and credit spreads as they have now started to move in opposite directions, muting each other's impact - a big shift from what we saw earlier in the year as both moved together, typically higher.
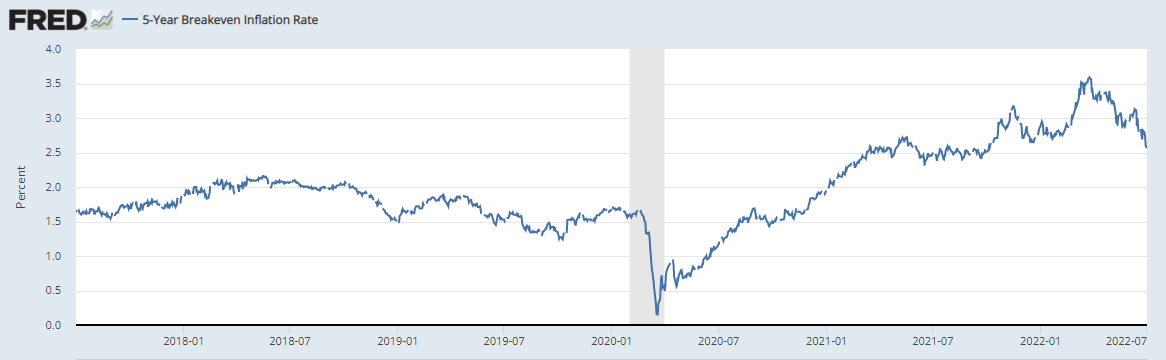
This kind of "normal" market behavior is expected when the market is driven by growing recession worries rather than inflation concerns. Inflation expectations over the next 5 years have fallen a full 1% in Q2 to just 2.6% to the same level of about a year ago, well before the word "transitory" was cancelled by the Fed. And even though the Fed no longer uses the word it does seem like the market has, in effect, resuscitated it. The obvious risk remains that inflation proves to be more persistent than the market imagines.
This is why we continue to favor some allocation to higher-quality, floating-rate (or soon to float) preferreds such as the PNC Financial Services Group 6.125% Series P (PNC.PP) with a 3-month Libor + 4.0675% coupon, the Valley National Bancorp 5.5% Series B (VLYPO) with a 3-month Libor + 3.578% coupon and Annaly Capital Management 6.95% Series F (NLY.PF) with a 3-month Libor + 4.993% coupon when it floats in September. With 3-month Libor expected to end 2022 around 3.25% (it is currently around 2.35%) that would equate to a rise in stripped yields to 7.32%, 7.33% and 9.2%.
For further details see:
Preferreds Weekly Review: Taking A Longer-Horizon View On Preferreds Valuations