META - PSQ: Short NASDAQ On Recession Fears
2023-04-30 03:00:22 ET
Summary
- PSQ is an exchange traded fund that targets daily results equal to the inverse (-1x) of the NASDAQ 100.
- Over the last five years, PSQ has been a poor investment overall, but over short periods when NASDAQ 100 declined, it has performed beautifully by mirroring declines with positive returns.
- Rising interest rates and declining consumer spending are amongst the pressures that could force the US economy into recession.
- NASDAQ large-cap P/E ratios are elevated vs. their five years averages on increased prices and falling earnings.
- I recommend cautious investors generally maintain their best and highest conviction positions while carefully reducing downside risk with a small PSQ position.
ProShares Short QQQ ETF ( PSQ )
PSQ is an exchange traded fund launched and managed by ProShare Advisors LLC. The fund seeks daily investment results before fees and expenses that correspond to the inverse (-1x) of the daily performance of the NASDAQ-100 Index. The index includes 100 of the largest domestic and international non-financial companies listed on The Nasdaq exchange based on market capitalization.
PSQ employs short strategy and uses derivatives such as futures and swaps to create its portfolio. The fund invests in global public equity markets through derivatives in stocks of companies operating across energy, real estate, materials, industrials, consumer discretionary, consumer staples, health care, information technology, communication services and utilities sectors.
How Has PSQ Performed Vs NASDAQ Historically?
First off, PSQ is a convenient way to place a broad bet against the NASDAQ 100, but it is also a horrible long-term investment. Therefore, PSQ is a short-term investing tool rather than a long-term position.
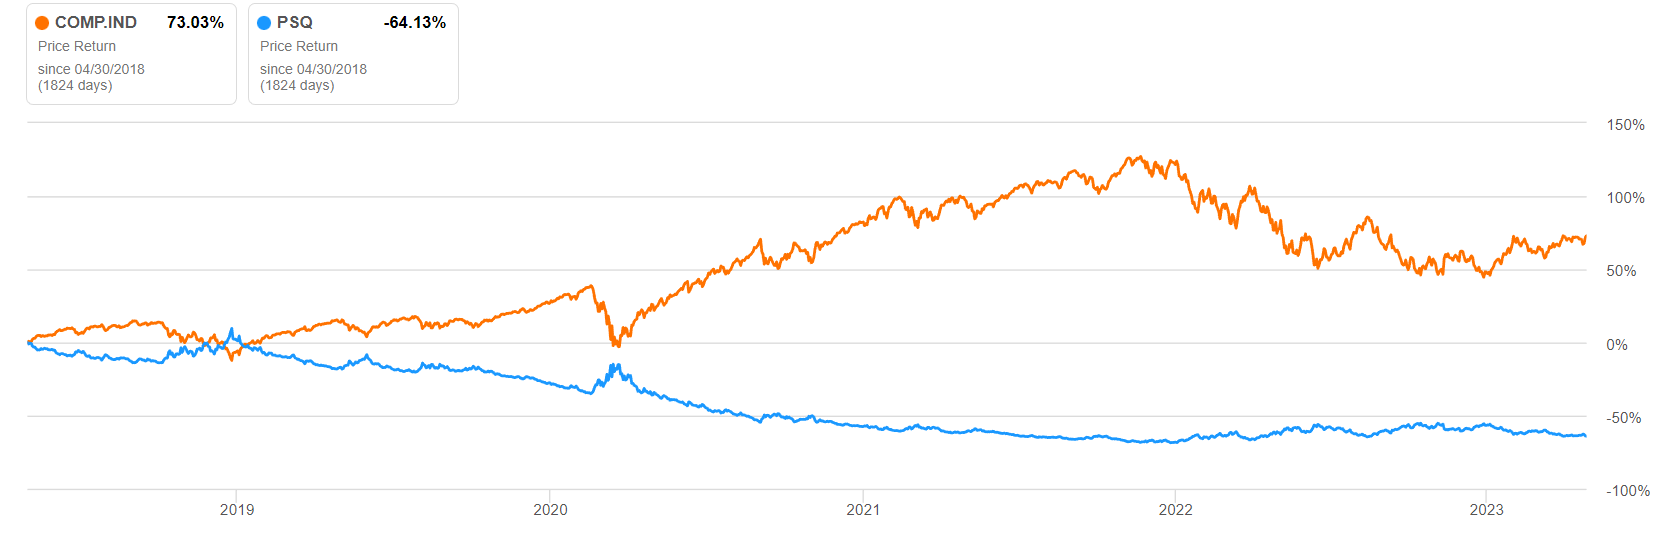
PSQ vs NASDAQ: 5Yr Performance
Over the last five years, NASDAQ Composite Index ( COMP.IND ) gained 73% while PSQ fell 64%. However, during the short pandemic recession from February to April of 2020, PSQ performed as promised.
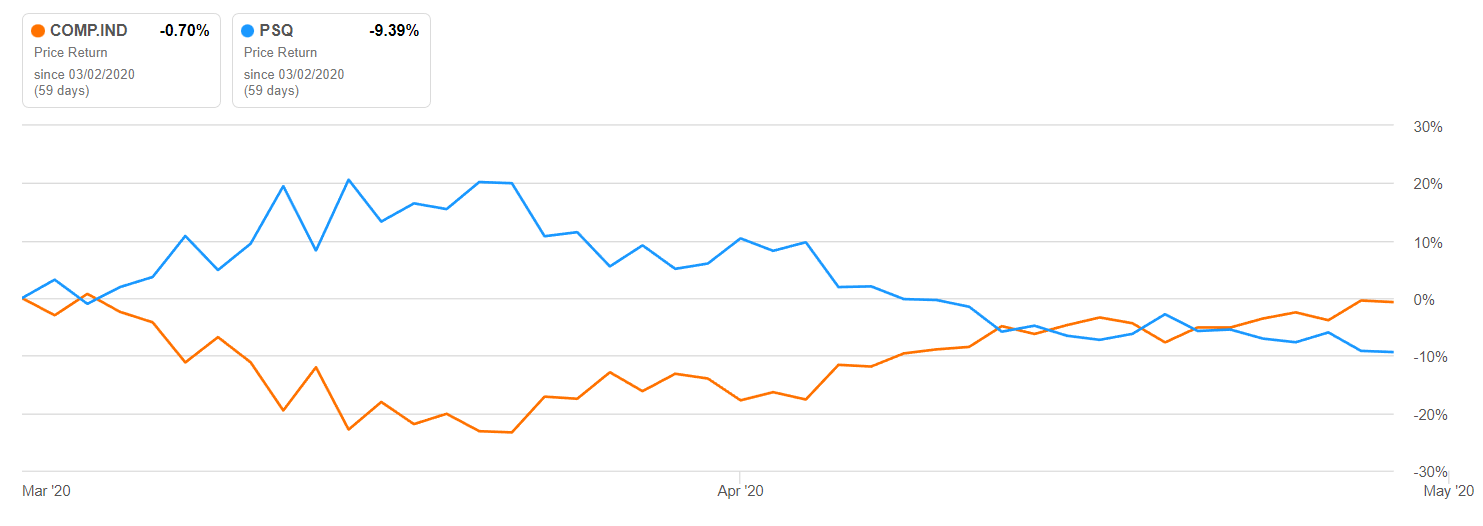
PSQ vs NASDAQ: Pandemic Recession
From March 1st to March 23rd of 2020, NASDAQ fell 23%. Over that period, PSQ mirrored NASDAQ's decline nearly perfectly by climbing 20%.
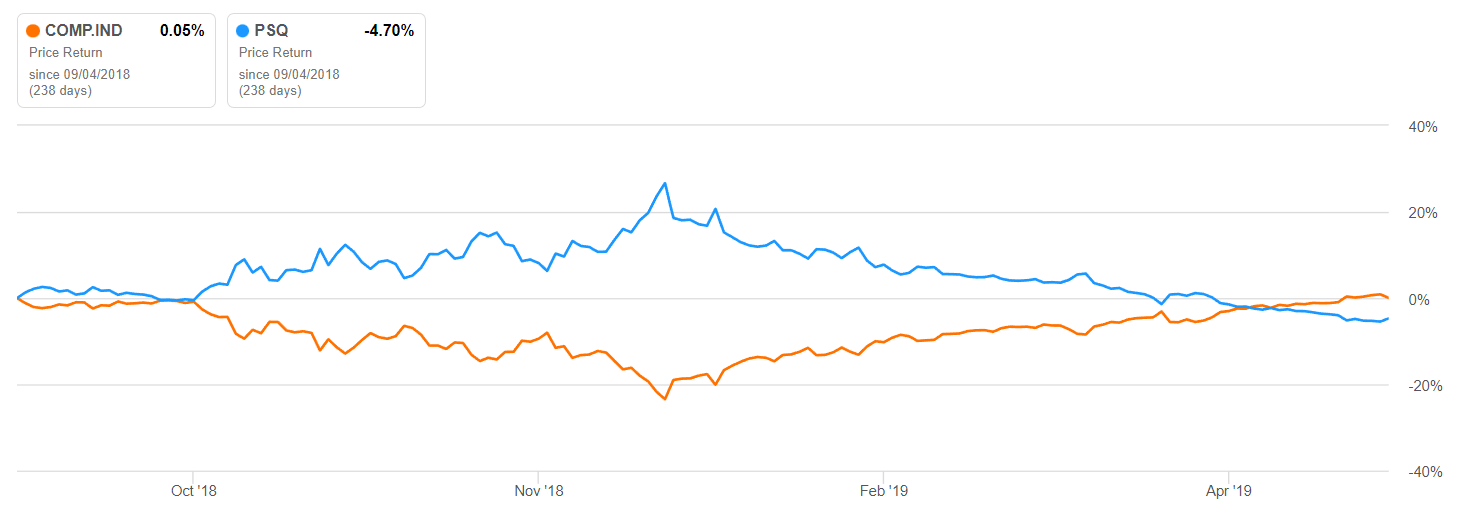
PSQ vs NASDAQ: 9/1/18 - 5/1/19
From September 1st, 2018, to December 24th, 2018, NASDAQ fell over 23%. Over that period, PSQ again mirrored NASDAQ's decline very well by climbing nearly 27%.
Is Now a Good Time to Bet on a Recession?
PSQ is a miserable long-term investment and only outperforms NASDAQ during a recession or when NASDAQ declines. Therefore, setting aside gloomy market chatter, does the data support an impending recession?
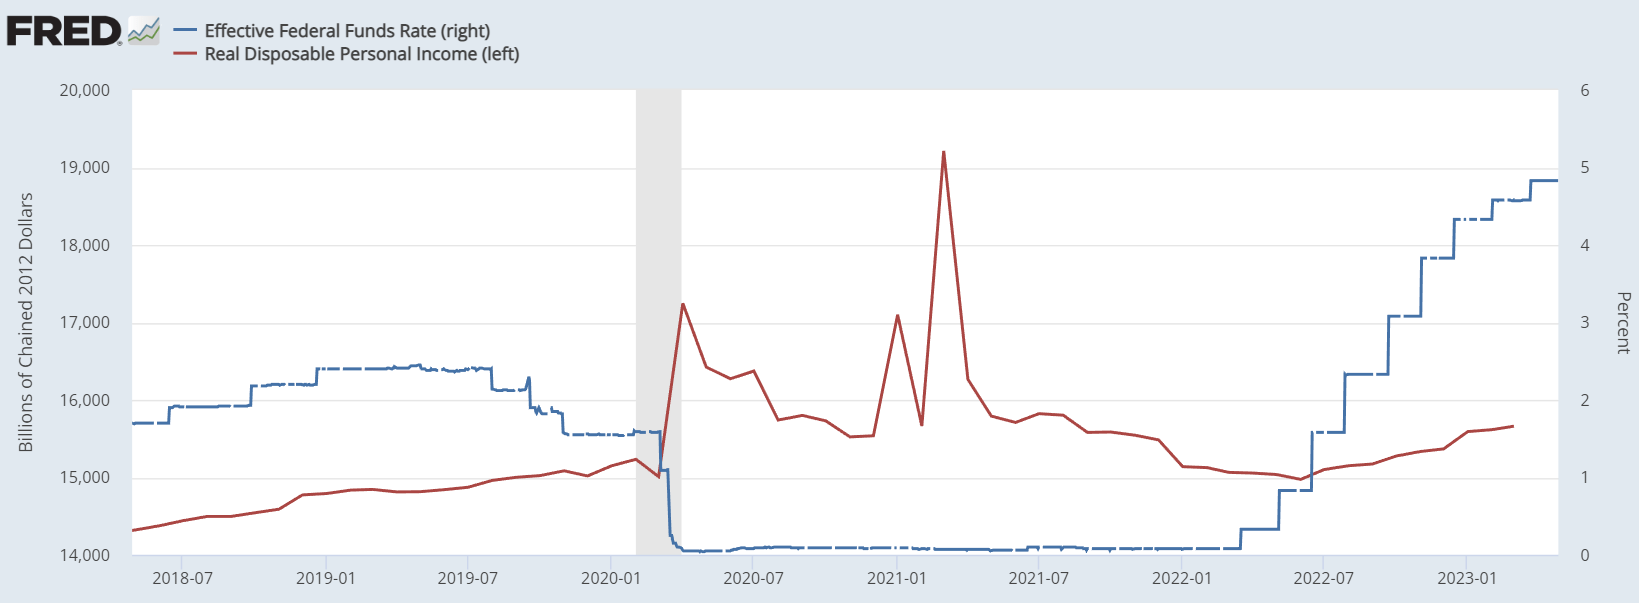
Rising interest rates and falling disposable income are often bad economic news and make a recession more likely. The following plot reflects the Federal Reserve's most recent 0.25% hike.
EFFR and Real Disposable Income
Since mid-April 2022, the Federal Reserve has raised the Federal Reserve Effective Funds Rate (EFFR) from essentially zero to its highest level since late 2007. So far this year the Federal Reserve has raised rates at each of its two meetings by 0.25% to reach nearly 5%. Further, real disposable personal income has fallen substantially from its 2021 highs. Both rising rates and falling disposable income are likely to weigh on future earnings,
Is the Nasdaq Ripe For a Decline?
Over the last five years, positive sentiment, momentum, and (more recently) declining earnings have driven a substantial expansion of NASDAQ large-cap PE ratios.
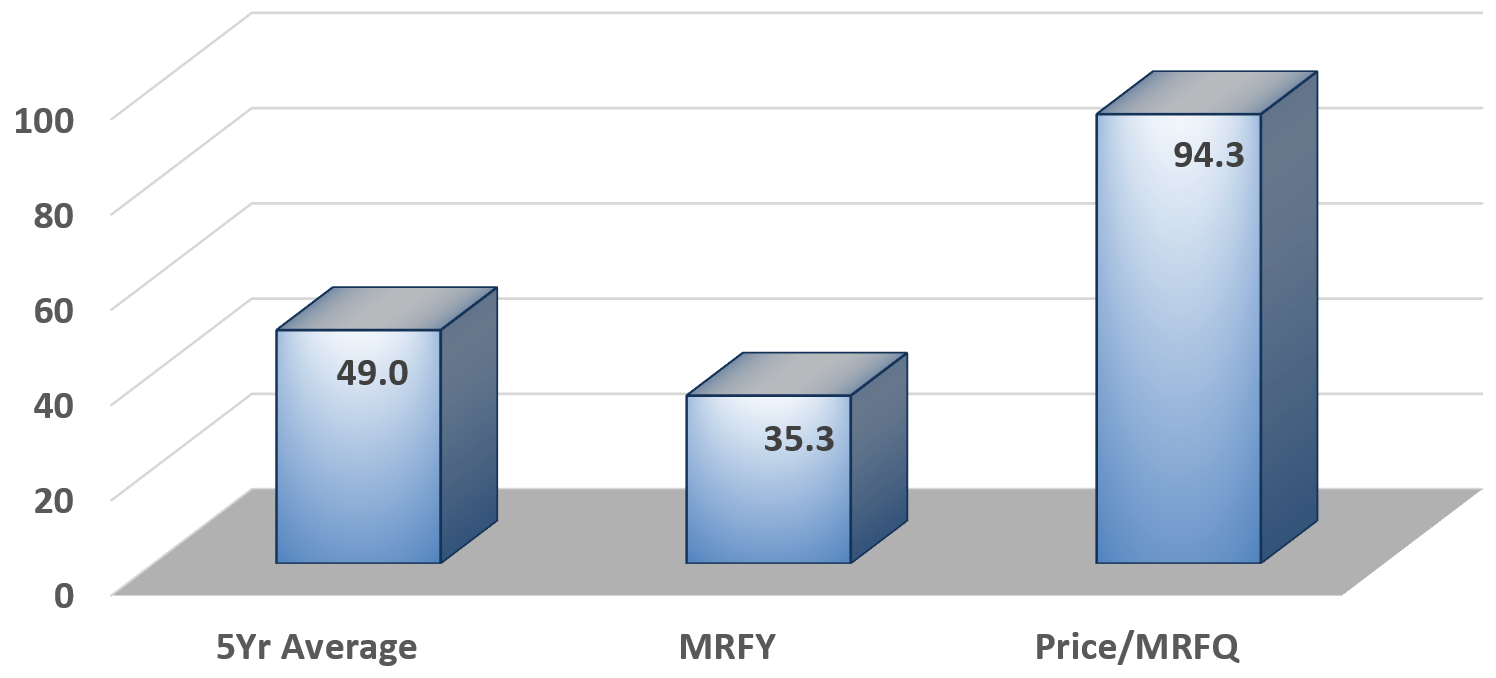
NASDAQ Large-Cap Average PE
The average of 141 NASDAQ large caps' 5YR average PE ratios is 49.0. Over the most recent fiscal year, the average PE fell as share prices generally declined. However, more recently, rebounding share price and reduced earnings have driven the average NASDAQ large-cap PE to 94.3, more than 2x the five-year average.
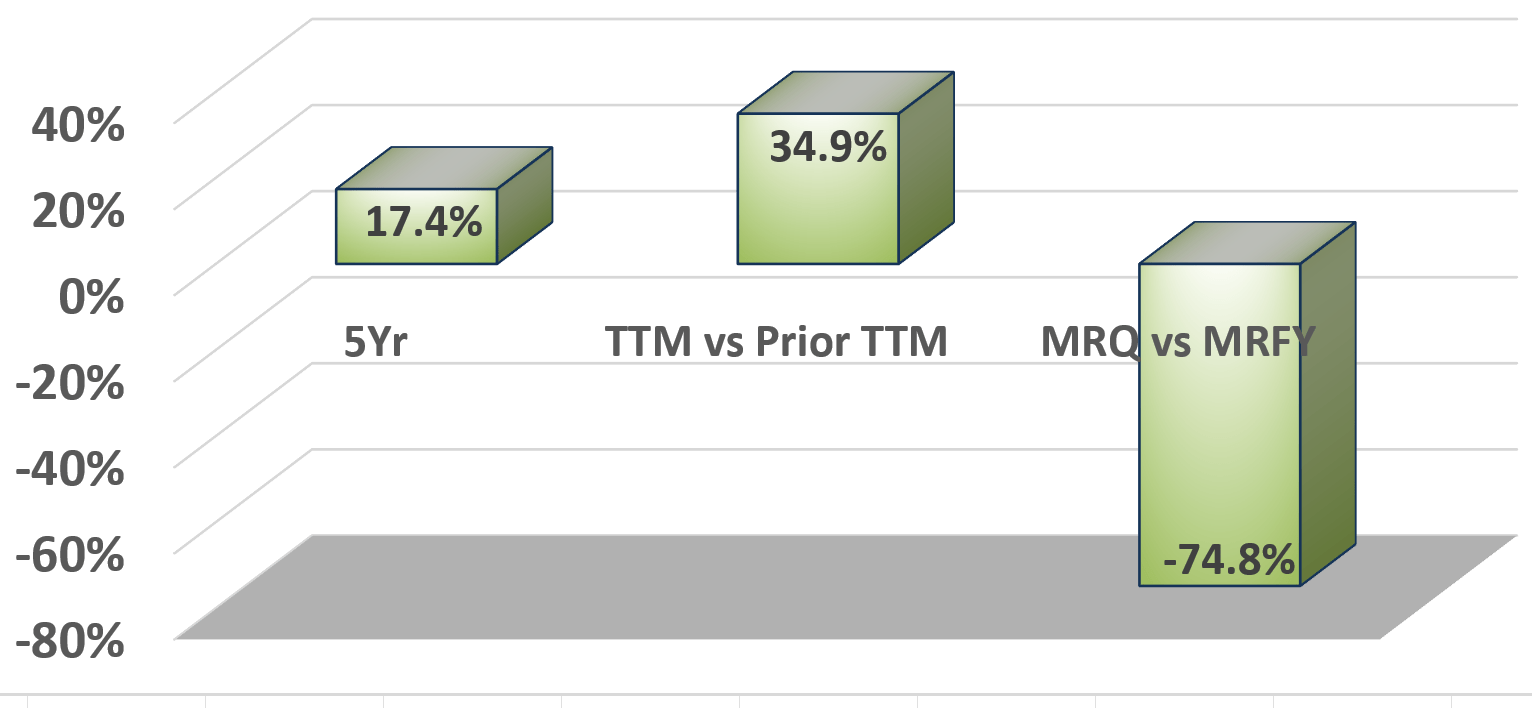
NASDAQ Large-Cap Average EPS
Over five years, the average NASDAQ large-cap EPS has increased 17.4% while increasing 34% in the last 12 months vs the previous 12 months. However, the most recent quarterly average EPS fell almost 75% vs that of the most recent fiscal year.
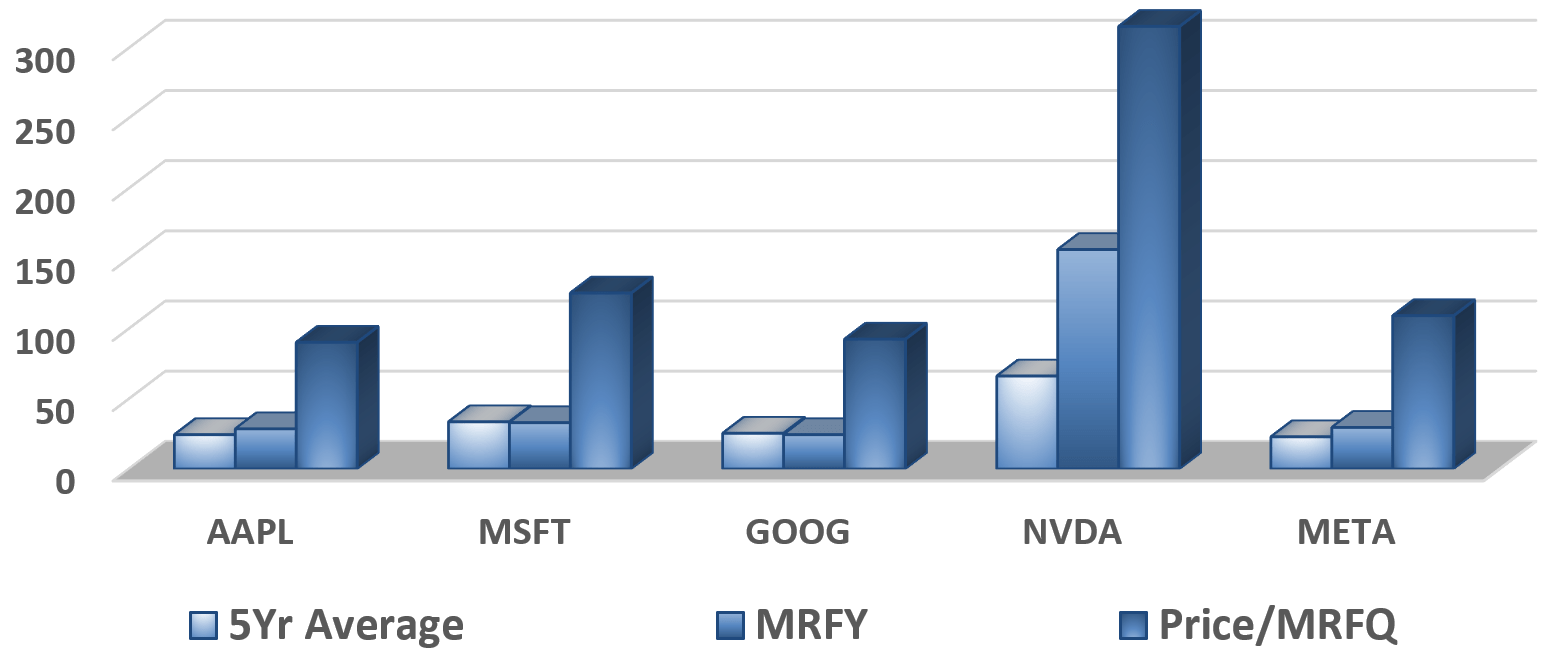
PE: Top 5 NASDAQ Companies
The top 5 NASDAQ companies by market cap are Apple Inc. ( AAPL ), Microsoft Corporation ( MSFT ), Alphabet Inc. ( GOOG ), NVIDIA Corporation ( NVDA ), and Meta Platforms, Inc. ( META ). Over five years, each of these companies' PEs has expanded substantially.
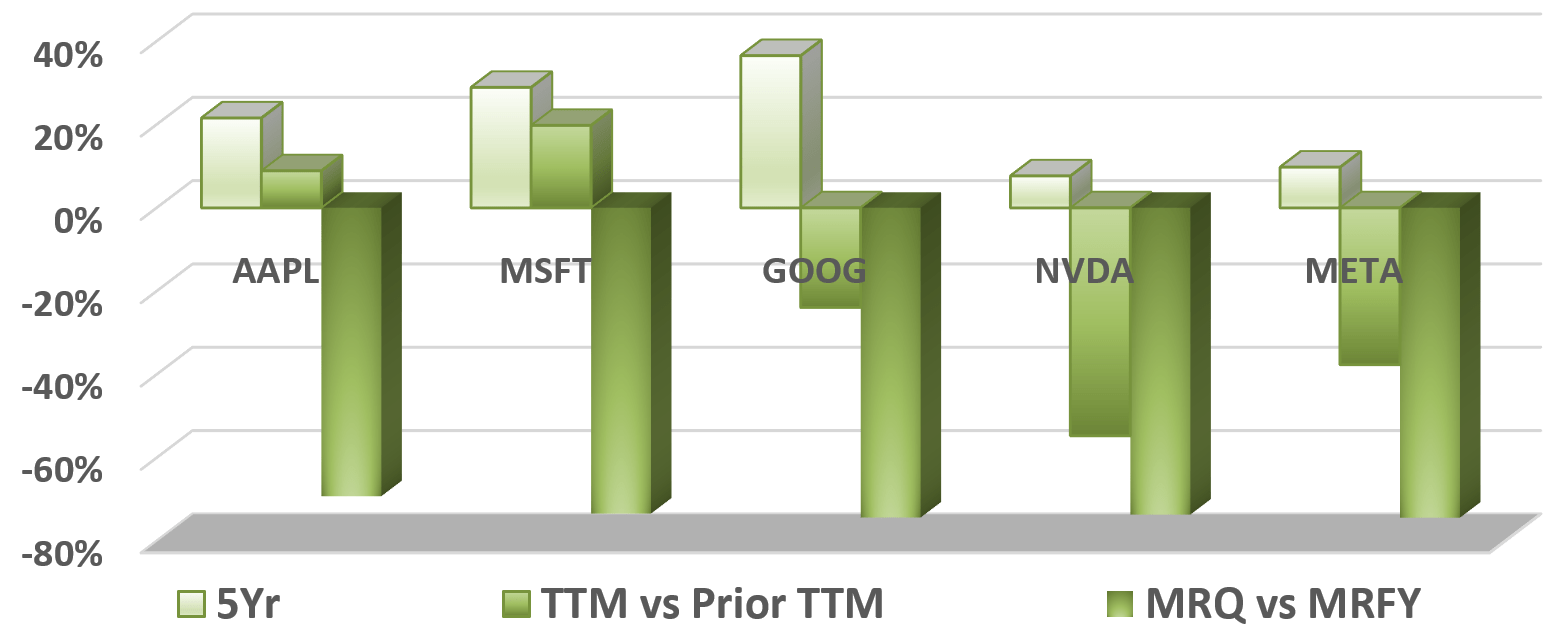
EPS: Top 5 NASDAQ Companies
Over five years EPS has generally increased but each company's most recent quarterly EPS has declined sharply compared to its most recent fiscal year ratio.
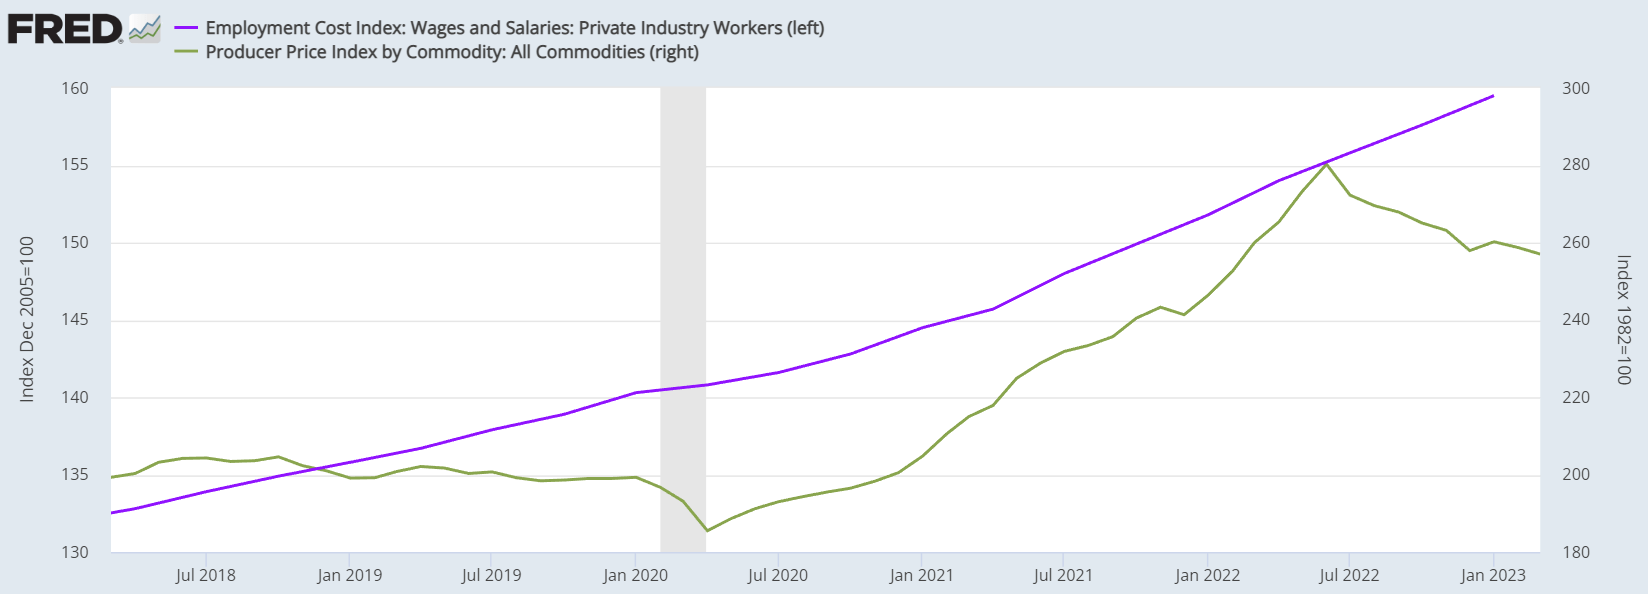
In addition to rising rates and reduced consumer spending, the Federal Reserve reports increased labor costs and rising producer commodity prices.
Private Industry Employment Costs and Producer Price Index
Private Industry Employment Costs have increased steadily over the last five years to record highs while the Federal Reserve Producer Price Index remains higher than most of the previous five years. These trends will add to growing pressure across most US companies' earnings.
Conclusions and Recommendations
Given rising rates, reduced consumer spending, historically high labor costs and elevated producer commodity costs, the NASDAQ 100 is certainly facing severe downward pressure. Despite last month's instability in the banking system, New York Fed President John Williams recently signaled another EFFR hike .
Further, the average large-cap PE is elevated over its 5-year average with sharply reduced EPS reported for the most recent quarter. Notably, PE ratios are based on empirical data but are also largely reflect market sentiment. PE ratios expand when investors are optimistic about future earnings. PE ratios contract when investors are less optimistic. Given the current outlook and falling earnings, investors have reason to feel less optimistic.
I will not go so far as to say a recession is around the corner, but fear of a recession is justly elevated. I would not recommend that investors abandon their long-term winners or give up on their highest conviction stocks. I would recommend that cautious investors cover some of their possible downside by carefully building a PSQ position. Note, PSQ is a position best held over short periods when a decline is expected.
The Federal Reserves is widely expected to raise rates again at its next meeting early next month . I intend to initiate a small PSQ position (about 2-4% of my trading portfolio) before that meetings results are announced on May 3rd.
Many seek to know what they do not yet know; they ought rather to seek to know what they already know. - Zhaungzi
Editor's Note: This article was submitted as part of Seeking Alpha's Best Investment Idea For A Potential Recession competition, which runs through April 28. This competition is open to all users and contributors; click here to find out more and submit your article today!
For further details see:
PSQ: Short NASDAQ On Recession Fears