TA - Revealing One Of My Favorite Buy And Hold Name Of 2023 - Chart Industries
Summary
- Prior to its unexpected $4.4 billion Howden deal, Chart Industries had just posted a record Q3 FY 2022 and offered great FY 2023 EPS and backlog guidance.
- The market was totally surprised by the Howden deal, and Chart shares reversed course, from an all-time high, and quickly got cut in half.
- The market was concerned about the expensive equity and debt financing required to complete the deal and its new leverage profile.
- Despite these valid concerns and the fact that Wall Street felt spurned by the deal, the acquisition makes sense and the new blended company is vertically integrated and should be a force that has multiple tailwinds driving future growth.
Yesterday, was one of my favorite market days in a while. My long term, buy and hold, and high conviction bet/ long thesis on TravelCenters of America ( TA ) paid off. I've owned TA shares, with a cost basis of $41, dating back to September 2021. And fairly recently, bought a lot more shares, around $52-ish, on a surprising and irrational sell-off on what I thought were great Q3 FY 2022 results and solid Q4 FY 2022 forward looking commentary, at TA. On September 30, 2021, I shared my in-depth TA write-up: A Quintessential Turnaround . More recently, on November 19, 2022, within my SA Pro Interview article, Value Investing With Courage & Conviction , I shared an updated thesis on TA and re-iterated my high level of conviction. As a number of my readers messaged me, yesterday, as they loved the TA thesis and owned shares, I decided to share one of my favorite Buy and Hold ideas for 2023, with free site readers.
Today, albeit with a bit of a lag, I'm revealing one of my favorite Buy and Hold ideas for 2023. This is a 'burn the boats' type of bet for me, meaning it is high conviction. The company is Chart Industries ( GTLS ) and this is a core investment name held within my portfolio. Strategy, I run a hybrid approach when it comes to my investment process. There are a number of Buy and Hold investments, representing upwards of 40% to 70% of the portfolio, depending on the moment in time and opportunity set. The remainder of the portfolio contains tactical ideas. Again, Chart Industries, notably at its current valuation, very much falls into the Buy and Hold cohort.
The Thesis
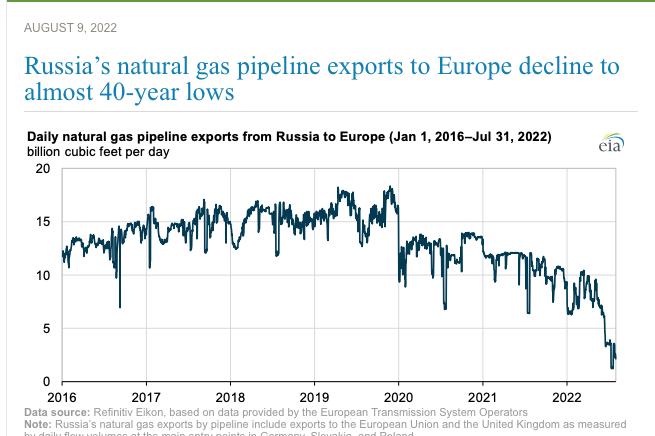
Arguably, Chart is one of the best ways to play Europe's move away from the Nord Stream 1 pipeline and Russian natural gas. For perspective, Russia was Europe's largest supplier of gas, supplying roughly 40% of its natural gas. Per the EIA, Russian gas to Europe was 12.4 Bcf/d in 2020 and 10.9 Bcf/d in 2021. In the U.S., current and total natural gas production is roughly 100 Bcf/d.
What They Do
Chart has four segments: Cryo Tank Solutions, Heat Transfer Systems, Speciality Products, and Repair, Service, and Leasing. I've read and listened to the past three conference calls as well as the November 8, 2022 Howden acquisition conference call. As an aside, Chart conference calls offer some of the most granular and in the weeds details, of almost any other calls I've ever listened to. Chart's CEO, Jill Evanko, is really good at what she does and does a great job getting in the weeds and explaining the business.
As this business is extraordinarily complex, referencing Chart's 10-K, enclosed below please find a somewhat pruned description of these four segments.
Cryo Tank Solutions: This segment designs and manufactures bulk and specialized gas cryogenic solution for the storage, distribution, vaporization, and application of industrial gases. They serve both small and large customers and offer engineered and tailored solutions to cryogenic storage solutions in both mobile and stationary applications. These advanced systems use vacuum insulation technology to store and transport industrial gases at temperatures from 0° Fahrenheit to temperatures nearing absolute zero. Chart supplies cryogenic solutions for storage, distribution, re-gasification, and use of LNG. Chart supplies cryogenic trailers, ISO containers, bulk storage tanks, loading facilities, and re-gasification equipment specially configured for delivering LNG into Virtual Pipeline applications
Heat Transfer Systems: This segment manufactures mission critical engineered equipment and technology driven process systems used in the separation, liquefaction, and purification of hydrocarbon and industrial gases that span most gas-to-liquid applications. Chart provides the natural gas processing solutions that facilitate the progressive cooling.
Chart provides natural gas processing solutions that facilitate the progressive cooling and liquefaction of hydrocarbon mixtures for the subsequent recovery or purification of component gases. Primary products used in these applications include brazed aluminum heat exchangers, cold boxes, pressure vessels, Core-in-Kettle® and air cooled heat exchangers. Chart's brazed aluminum heat exchangers allow producers to obtain purified hydrocarbon by-products, such as methane, ethane, propane, and ethylene, which are commercially marketable for various industrial or residential uses. Chart's cold boxes are highly engineered systems that incorporate brazed aluminum heat exchangers, pressure vessels, and interconnecting piping used to significantly reduce the temperature of gas mixtures to liquefy component gases so that they can be separated and purified for further use in multiple energy, industrial, scientific, and commercial applications. Chart's air cooled heat exchangers are used to cool or condense fluids to allow for further processing and for cooling gas compression equipment. Chart's process technology includes standard and modular plant solutions and comprises detailed mechanical design, Chart manufactured proprietary equipment and all other plant items required to liquefy pipeline quality natural gas.
Speciality Products: This segment supplies highly-engineered equipment used in specialty end markets applications for hydrogen , LNG, biofuels, CO2 Capture, food and beverage, aerospace, lasers, cannabis and water treatment, among others. Management has made a number of smart acquisitions to expand its portfolio of clean production and engineered solutions, including (BlueInGreen, LLC, Sustainable Energy Solutions, Inc., Cryogenic Gas Technologies, Inc., L.A. Turbine, AdEdge Holdings, LLC and Earthly Labs Inc.).
Chart supplies a wide range of solutions used in the production, storage, distribution and end-use of hydrogen while also providing highly-specialized mobility and transportation equipment for use with both hydrogen and LNG, including onboard vehicle tanks and fueling stations. More specifically, Chart's horizontal LNG vehicle tanks are widely used onboard heavy-duty trucks and buses while our recently-released liquid hydrogen vehicle tank enjoys many of the same characteristics. Chart also manufactures specialized cryogenic railcars used to transport not only LNG, but a number of other gaseous and liquid molecules. Additionally, Chart designs and manufactures nitrogen dosing products and other equipment used in packaging as well as the food and beverage industry. These applications include processing, preservation and beverage carbonation.
Chart's water treatment technology is also offered through the Specialty Products segment. Serving both municipal and industrial end markets globally, our water treatment process technology utilizes Chart's cryogenic storage and vaporization equipment to efficiently deliver dissolved oxygen, CO2 and ozone into water.
This segment also designs and manufactures solutions for the liquefaction, storage, distribution, re-gasification and use of hydrogen. There are a number of commercial uses for hydrogen including traditional applications in the chemical, refining and space industries. More recently, hydrogen is increasingly being used as an alternative fuel for the power transportation sectors, with both onshore and marine applications.
Repair, Service, and Leasing: This segment provides installation, service, repair, maintenance, and refurbishment of its product globally as well as offers equipment leasing options.
Aftermarket services include extended warranties, plant start-ups, parts, 24/7 support, monitoring and process optimization, as well as repair, maintenance, and upgrades. Chart performs plant services on equipment, including brazed aluminum heat exchangers, cold boxes, etc.
Chart also installs, services, maintains and refurbishes bulk and packaged gas cryogenic solutions for the storage, distribution, vaporization, and application of industrial gases.
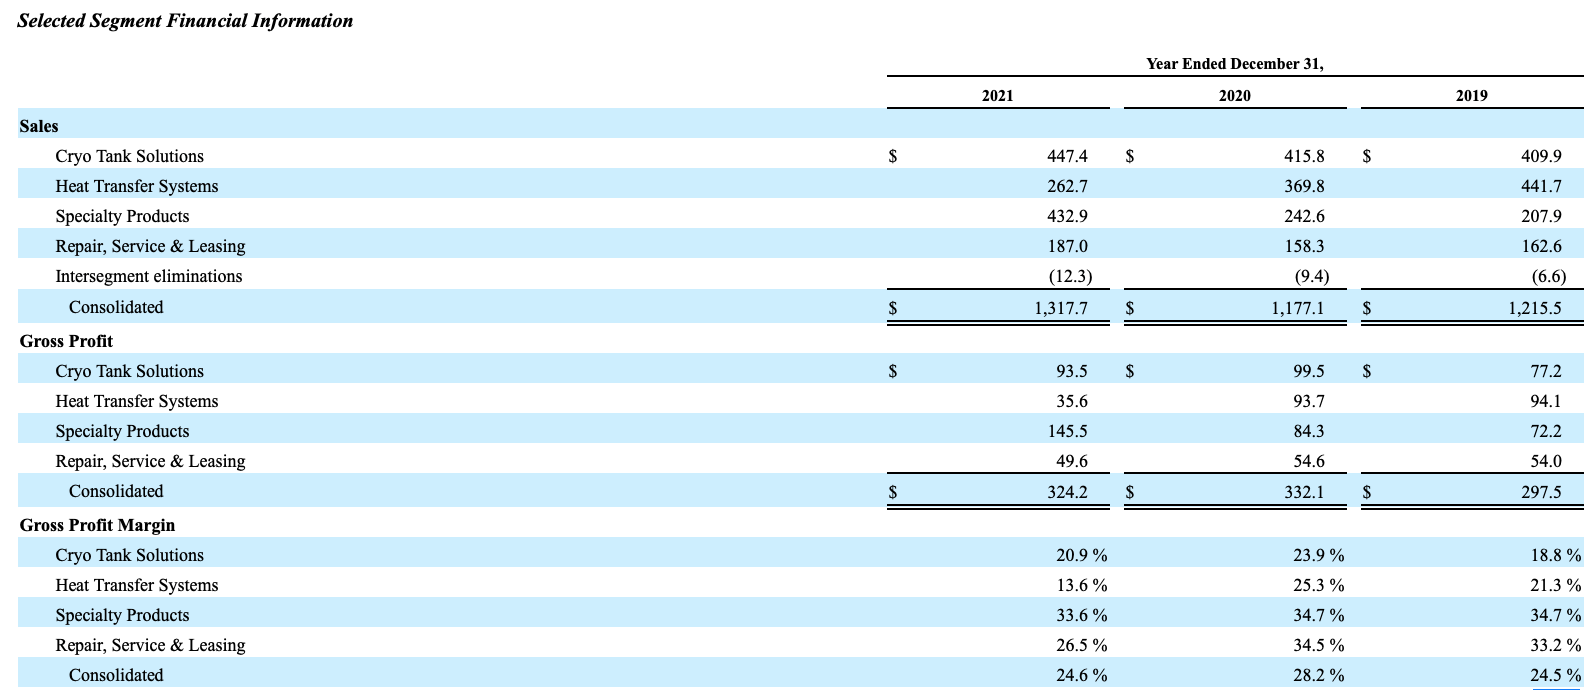
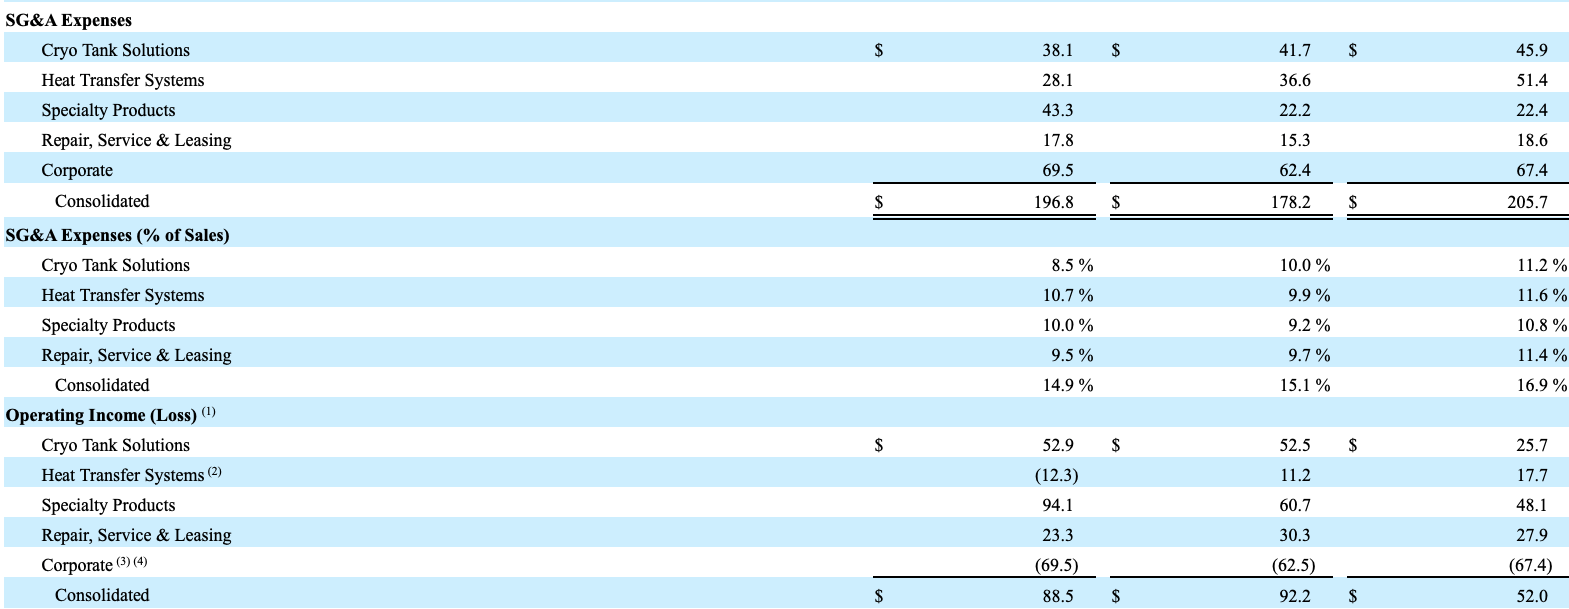
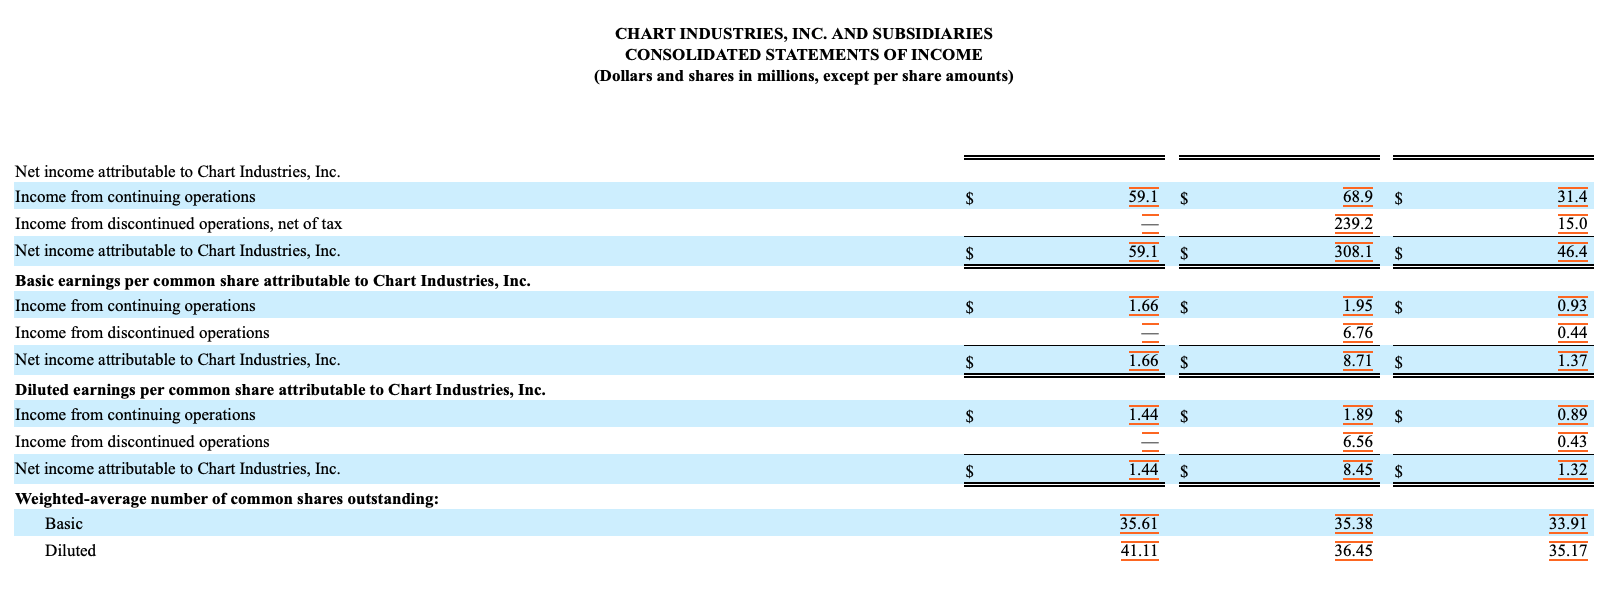
Here are the historical 3 year financials (FY 2019 - FY 2021)
As you can see, from FY 2019 - FY 2021, revenue has hovered in range of $1.17 billion to $1.32 billion.
GTLS FY 2021 10-K GTLS FY 2021 10-K
As you can also clearly see, Chart's income from continuing operations has been lackluster. Well, that has changed in FY 2022 and its FY 2023 EPS outlook is even better.
Why This Opportunity Exists
After really good Q2 FY 2022 earnings and even better Q3 FY 2022 earnings, on November 8, 2022, Chart's stock made a fresh all time high, at $242.59!
However, that night, after the bell, Chart announced a $4.4 billion acquisition of Howden. The market quickly reversed course and the stock gapped down, the next day.
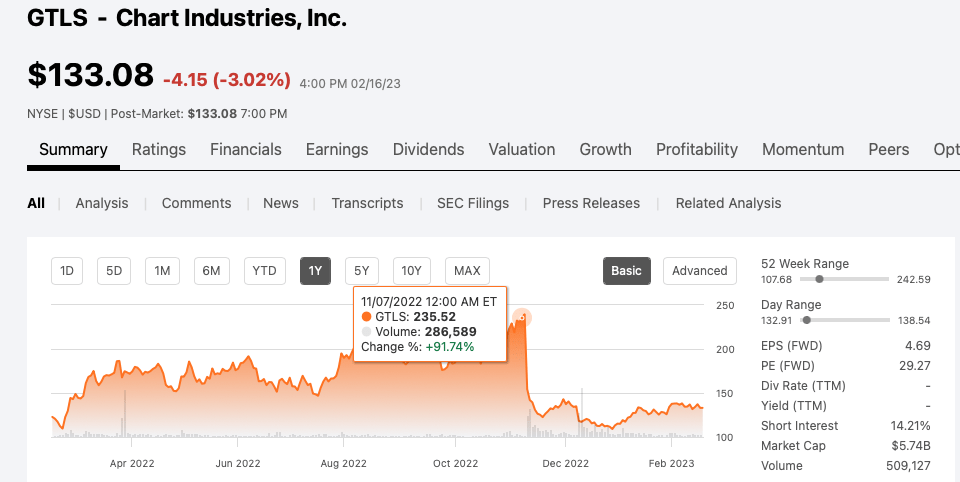
Look at this price action, since the Howden deal announcement.
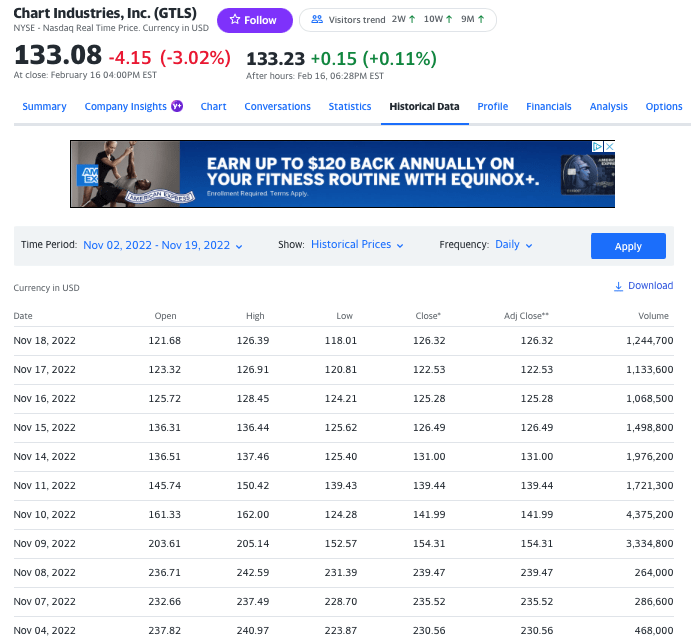
Setting stock prices aside, let's look at how robust Chart's backlog has grown, which explains the stock sprinting to all time highs, before the surprise Howden deal.
September 30, 2022 Backlog ($2.254 billion, up 104.5%, YoY)!
Strong order activity contributed to record ending total backlog of $2,254.1 million as of September 30, 2022 compared to $1,102.2 million as of September 30, 2021 and $1,953.3 million as of June 30, 2022, representing increases of $1,151.9 million or 104.5% and $300.8 million or 15.4%, respectively, which reflects the broad-based demand we continue to see year-over-year and quarter-over-quarter across our product categories. The increase in backlog was largely driven by strong order activity for the three months ended September 30, 2022 of $729.4 million compared to $350.2 million as of September 30, 2021 representing an increase of $379.2 million or 108.3%. Strong order intake in our Heat Transfer Systems segment of $357.7 million for the three months ended September 30, 2022 compared to $41.1 million for the three months ended September 30, 2021, was mainly driven by increased LNG orders including big and mid-scale LNG, liquefaction systems and cold box projects during the three months ended September 30, 2022.
Source: (GTLS Q3 FY 2022 Conference Call)
Next, look at the strong FY 2022 sales guidance as well as FY 2023 sales outlook.
Our outlook for 2022 for sales is in the range of $1.65 billion to $1.70 billion. The change to our prior sales guidance of $1.725 billion to $1.80 billion is driven by currency headwinds and timing of specific project revenue recognition, which is typical in our business.
Our outlook for 2023 for sales is in a range of $2.10 billion to $2.20 billion and is driven by increased confidence due to record backlog, multiple global tailwinds and customers' forecasts. Our 2023 outlook includes only Big LNG projects that are in backlog as of September 30, 2022. Note that this outlook does not include any new or additional mid-size or large projects that could come into the order book between now and the end of the first half 2023 which we would anticipate having sales associated with them in the year. If one or more mid or large-size project comes into the order book between now and the end of the first quarter 2023, we would anticipate recognizing between $50 to $75 million dollars more of revenue into the full year.
Source: (GTLS Q3 FY 2022 Conference Call)
On the EPS guidance front, $5 to $5.25, in FY 2022
So turning to slide 34, our outlook for 2022 for sales in the range of $1.65 billion to $1.70 billion with associated adjusted non-diluted EPS in the range of $5 to $5.25 and approximately 35.87 million weighted shares outstanding with an assumed tax-rate of approximately 17%. The change to our prior sales guidance of $1.725 billion to $1.8 billion, is driven by currency headwinds and timing of specific project revenue recognition, which is typical in our business. We're pleased to share that our adjusted non-diluted EPS outlook remains at or above $5, which demonstrates our third quarter and expected fourth quarter execution of margin improvement actions.
Source: (GTLS Q3 FY 2022 Conference Call)
And FY 2023 EPS guidance of $7.50 to $8.50 and free cash flow of $250 million to $300 million!
And then slide 35, which is really -- the point here -- in our high-level of confidence as we look-ahead to the full-year of 2023. Sales in the range of $2.1 billion to $2.2 billion, which includes only Big LNG projects that are in backlog as of the end of September 2022. Associated adjusted non-diluted EPS is anticipated to be in the range of $7.50 to $8.50 on 35.87 million weighted shares outstanding, assuming a tax-rate of 19% for the year. We anticipate associated free-cash flow in the $250 million to $300 million range for the full year 2023. I want to spend a moment on the buildup from backlog to our old greenfield on the table at the bottom of slide 35.
Source: (GTLS Q3 FY 2022 Conference Call)
So given the huge tailwind across the entire LNG ecosystem, a robust backlog, and finally operating leverage to go along side that strong top-line growth, which is set to (finally) translate to real EPS growth, it kind of makes sense why Chart shares were screaming to an all-time high, as of November 8, 2022.
This brings us to the Howden Deal...
About that Howden Deal
From a business perspective, and I listened to the 70 minute conference call (it might have even been longer), and the analyst Q&A was 50 minutes, I would argue that the Howden deal makes a ton of longer term and strategic business sense.
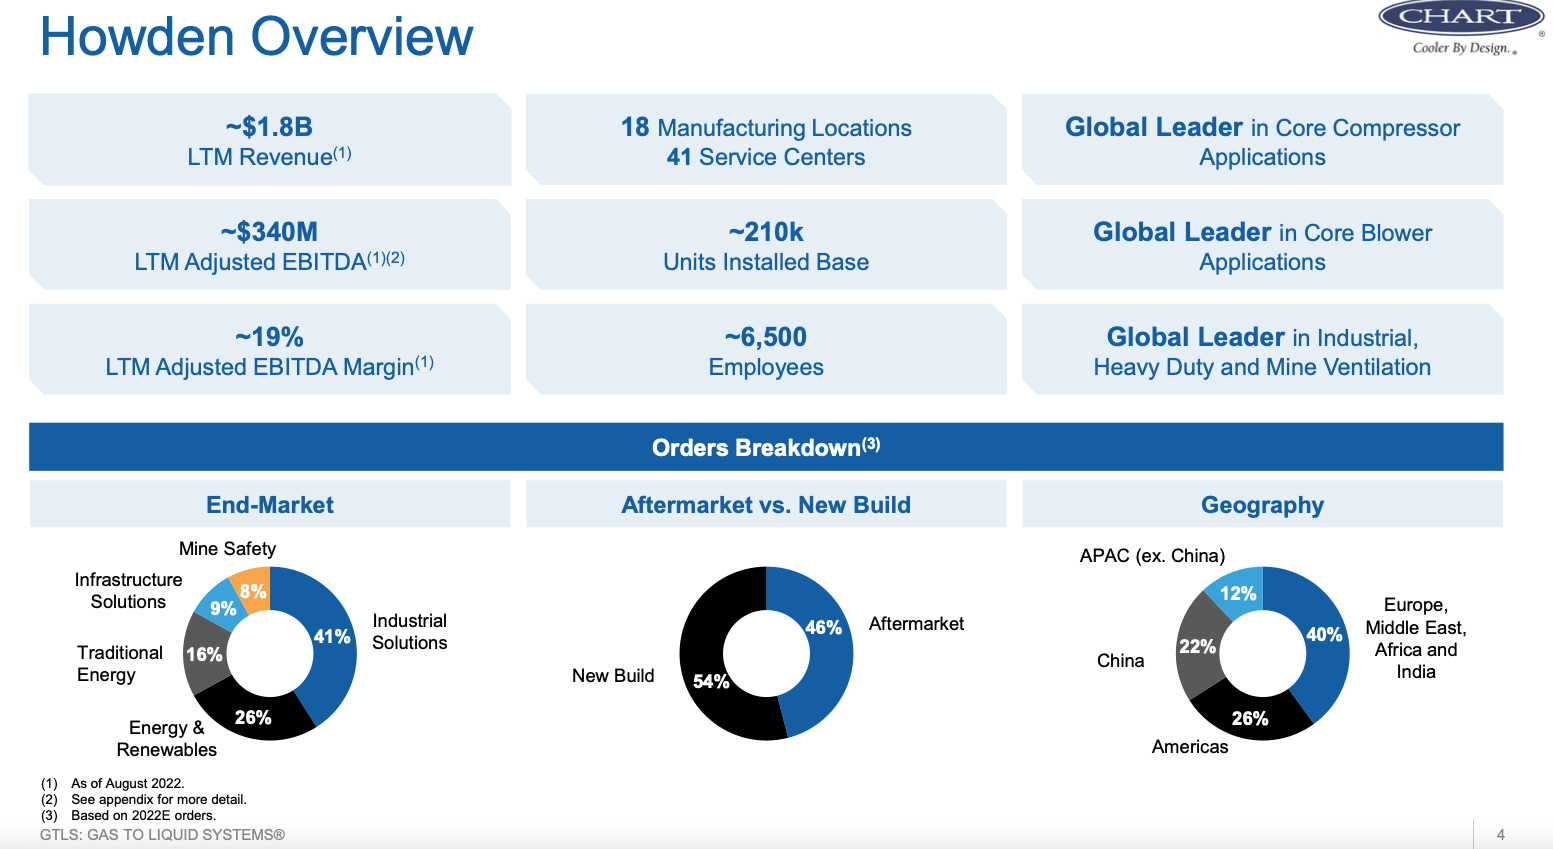
Howden has a much stronger global presence and there is very little overlap. It gives Chart access to new and more profit niche segments as well as relationships with key customers, that are very hard to court and win.
GTLS - Howden Acquisition Slide Deck
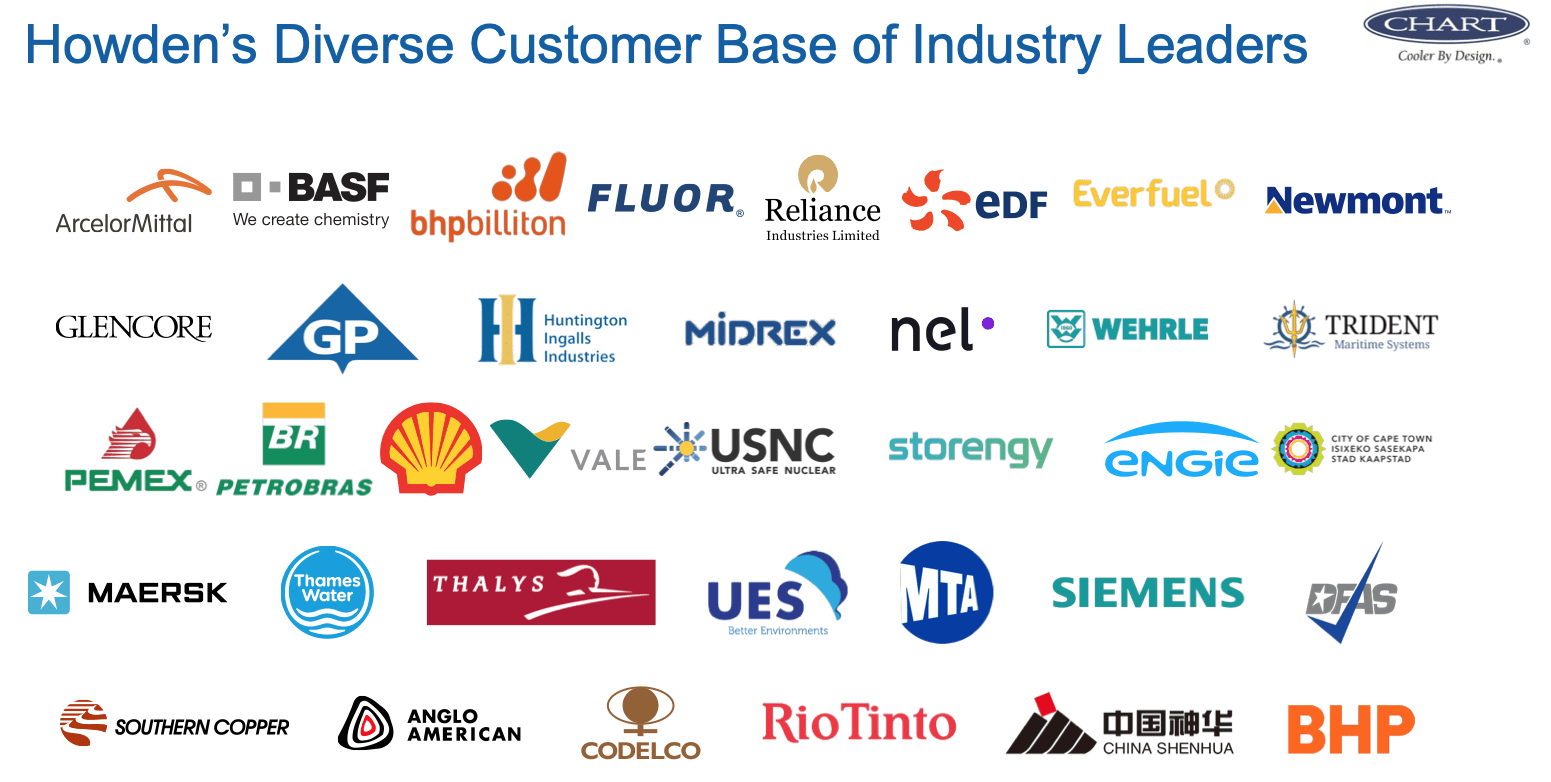
Because Howden has a really strong repair and aftermarket business, which carries a much higher EBITDA margin profile and offers more revenue predictability outside of the boom bust of the LNG cycles, the deal makes sense.
GTLS - Howden Acquisition Slide Deck
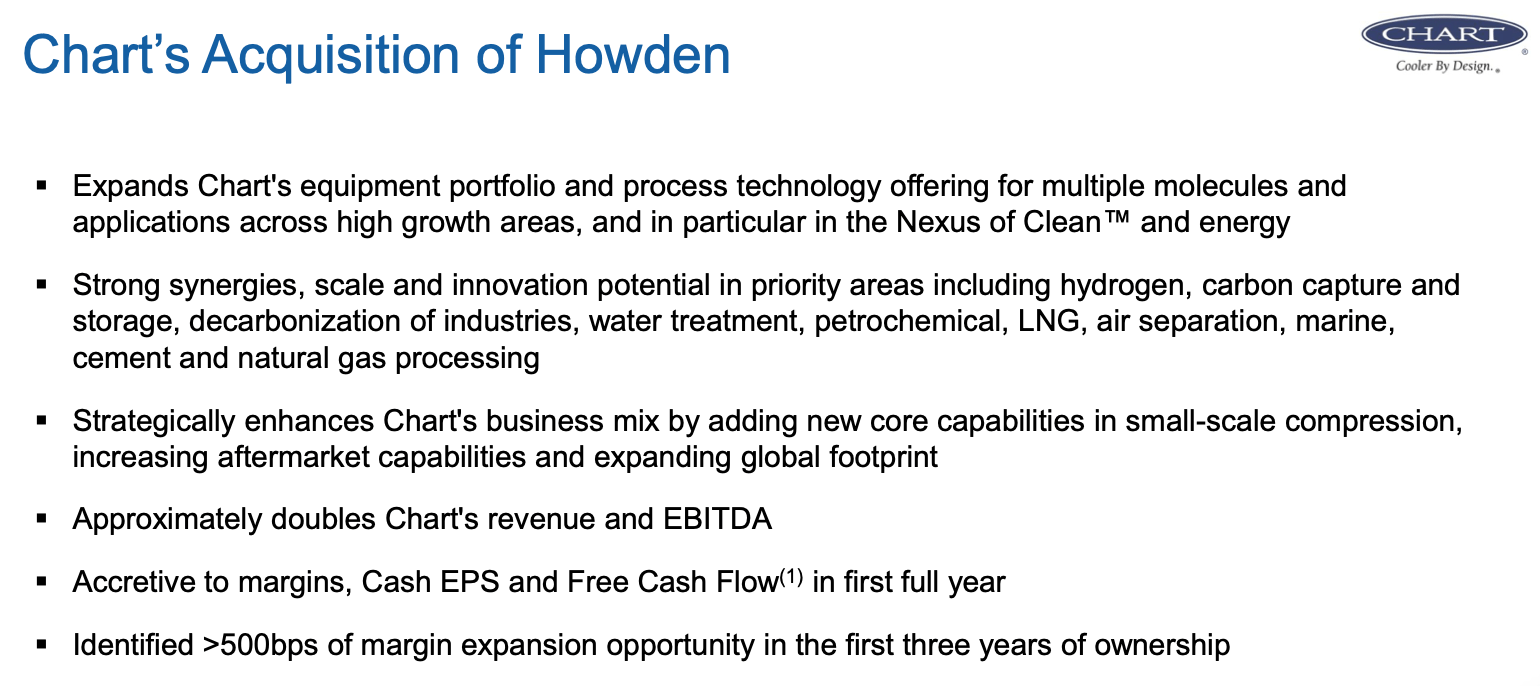
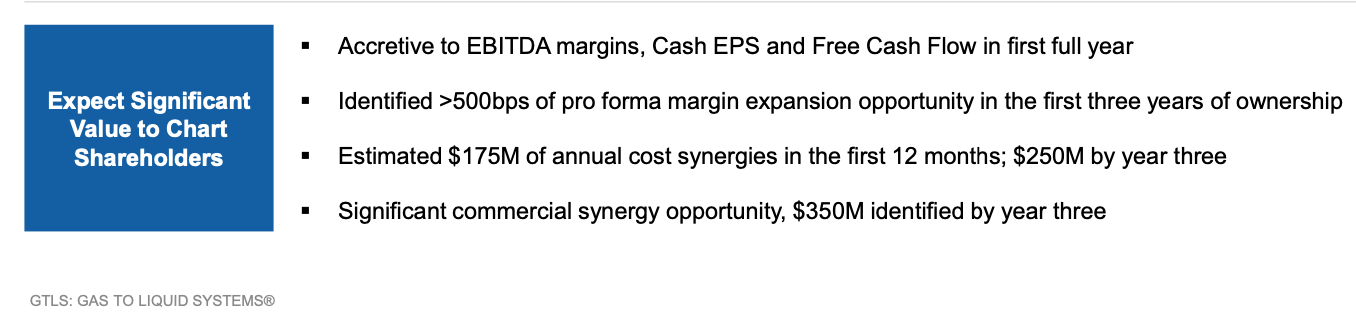
Moving along, the deal will be mostly financed with debt, so if you believe Jill and team can hit the synergy target then the multiple paid wasn't crazy.
GTLS - Howden Acquisition Slide Deck
Chart thinks they can achieve $175 million of year one cost savings.
GTLS - Howden Acquisition Slide Deck
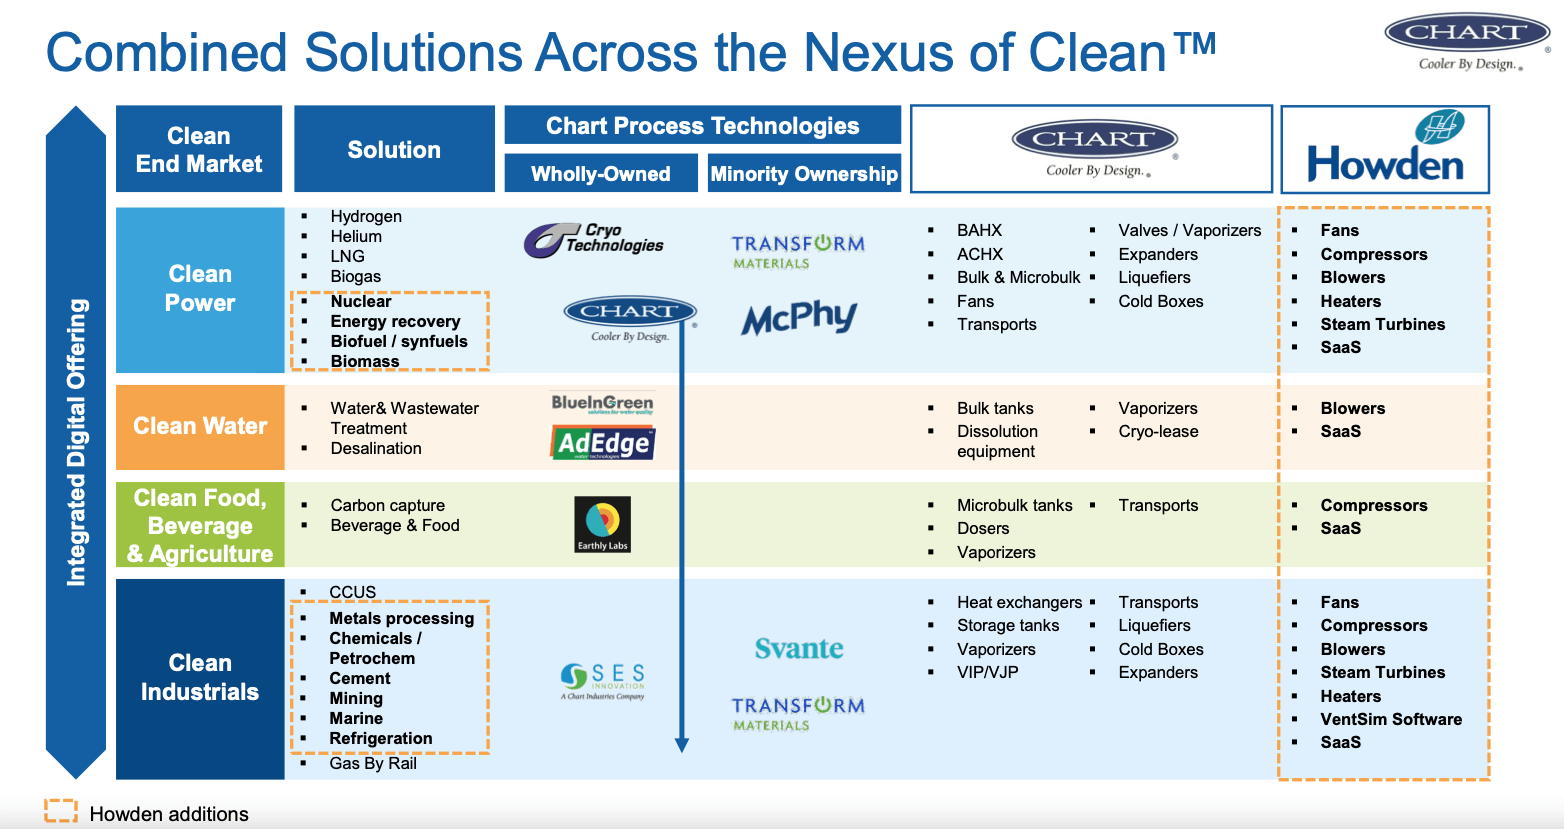
Thirdly, the deal makes Chart vertically integrated. Jill covered this in excruciating detail, on the Howden deal call. One of the biggest issues, for Chart, has been the long lead time get the big subcomponents required to manufacture the finished goods. And in the process, converting its robust backlog into revenue and, ultimately, free cash flow.
GTLS - Howden Acquisition Slide Deck
As the Howden conference call isn't available via a transcript (but you can listen to the webcast via its IR site), as it falls outside of a quarterly earnings release, I will share how one of Chart's sell side covering analyst (Marty Molloy - Johnson Rice) thought about the deal. This observation is very important and well said.
With this deal, on the small scale LNG side, the heat exchanger and hydrogen side of the business, this deal gives Chart all of the in house and vertical integration components (so think heat exchangers, cold boxes, and compressors). The only outside component needed will be the gas turbine.
Why Wall Street Doesn't Like The Deal
Wall Street was in love with Chart for the reasons stated above, in the section before the Howden deal. So you have a huge LNG tailwind driven by Europe completely retooling its entire energy infrastructure to 100% move away from Russian gas. Secondly, Chart is viewed as one of the best ways to play hydrogen, so think 2024 and beyond secular growth tailwinds. Moreover, prior to Howden deal, Chart's balance sheet was relatively un-leveraged.
So fast forward to the deal and Wall Street is saying they are paying healthy multiple to TTM Adj. EBITDA. In order for the deal price to be considered attractive, the year one, $175 million of synergies must be realized. Therefore, the uncertainty surrounding the integration combined with macro headwinds and fear led Wall Street to run for the exits. In addition, the deal will be mostly financed with debt.
Deal Financing Update
On December 8, 2022, Chart issued 5,923,670 shares, at $118.17 per share. They also priced a Mandatory Series B Convertible Preferred. The Convertible Preferred has a 6.75% coupon and will automatically convert by December 15, 2025, at a price range band of ($118.2 to $141.80). Net equities proceeds were just north of $1 billion.
On the debt side, they raised $1.94 billion, accounting for the original issuer discount. The coupons, on the two debt tranches, were relatively expensive, as the combination of higher interest rates, increased balance sheet leverage, and negative overall sentiment were contributing factors.
Chart Industries, Inc. ( GTLS ) ("Chart") announced today that, it has priced its previously announced offering of $1,460,000,000 aggregate principal amount of 7.500% senior secured notes due 2030 (the "Secured Notes") at an issue price of 98.661% and $510,000,000 aggregate principal amount of 9.500% unsecured notes due 2031 (the "Unsecured Notes," and together with the Secured Notes, the "Notes") at an issue price of 97.949%. The offering is expected to close on December 22, 2022, subject to customary closing conditions.
Putting It All Together
If you follow my work closely, you might have noticed, I very selectively love playing contrarian. I'm long Chart at an average of $130 whereas the stock was trading well into the $200s, prior to this unexpected Howden deal. The market hated the deal, as they felted hoodwinked by the record earnings, great guidance, and backlog. Then, and oh, by the way, we made a $4.4 billion acquisition - Surprise!. Chart definitely paid full price for the Howden assets and the financing was expensive in the form of equity, at a low stock price, and coupons on the debt isn't exactly cheap either. That said, essentially, I'm betting on Jill Evanko and her vertically integrated visions. I think Jill is really smart and is a good operator, and Chart has assembled a one of a kind business that has major tailwinds behind it. If you are investing in Chart you are betting on FY 2024 EBITDA and EPS and beyond.
If you take a step back and believe management can realize the stated synergies, then I would argue this deal makes complete sense. It greatly enhances the diversification of the business, both in terms of customers and global footprint, as well as from a product portfolio perspective. Moreover, Howden's strong aftermarket revenue and EBITDA profile greatly bolsters Chart's longer term EBITDA power and EBITDA margin outlook. And as I noted, it makes the revenue cadence more predictable.
Chart is scheduled to report its Q4 FY 2022 results on February 28, 2023. We will learn more then. In closing, I'm not betting on this quarter, this is very much a 12 month to 24 month investment.
For further details see:
Revealing One Of My Favorite Buy And Hold Name Of 2023 - Chart Industries