CA - RWE: Remarkable Disparity Between Operating Performance And Stock Price
2023-04-24 14:48:49 ET
Summary
- 2022 was a remarkable year for RWE as the German energy supplier has been able to profit off of the high energy prices.
- High capital expenditures and therefore a negative FCF undergird RWE’s intentions to accelerate its transformation to a fully green and carbon dioxide-neutral company.
- I believe that the business development and share price show a rare disparity, which gives investors a great opportunity to accumulate shares.
Introduction
It has been roughly a year since I've published my first Seeking Alpha article. The company I chose, RWE (RWEOY), has shown an excellent development of its operating business, but the share price still does not seem to appreciate the company's work. Maybe it is due to the low dividend for an energy supplier, or lack of share buybacks ?could have also disappointed the market. However, I am very pleased about this and fully support the management's decision to put its focus on investing every available Euro into strategic acquisitions and organic expansion by building more wind and solar parks. Before diving deep into RWE I recommend checking my previous article.
Macroeconomic Trends
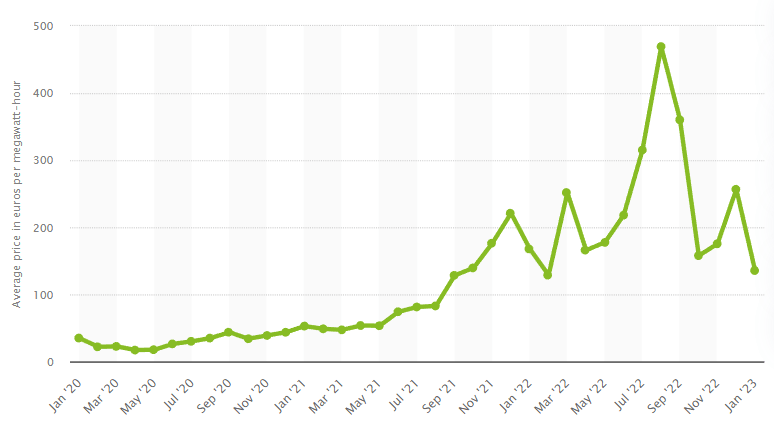
RWE's cash flows immensely depend on electricity prices. The three core markets are Germany, the UK, and the USA. Since the outbreak of the war over a year ago, European energy prices have massively increased.
During 2022, there was a huge unprecedented price spike, which obviously benefitted RWE and other energy suppliers. The price per MWh has already come back down but is still inflated compared to pre-pandemic levels. RWE is very profitable at these current prices and can use the money to further invest in its portfolio. Another advantage of the recent (and partly still ongoing) energy crisis is the increased focus of Germany's government to strengthen its independence. This includes immediate emergency solutions like reactivating already decommissioned coal plants, allowing a longer runtime for the last three German nuclear power plants until April 15, 2023, and building LNG terminals to re-gasify imported natural gas as a temporary solution.
Those measures allow higher short-term revenue but will not influence any future cash flows. More important, in my opinion, is the shifted focus and urgency to speed up the German transition away from coal and lignite and towards being independent of them. The current coalition has stipulated to generate at least 80% of gross electricity consumption by renewables in 2030. Previously, 65% was agreed upon. In line with this, the German offshore capacity shall increase to 30 GW. They also set Onshore wind and solar to increase from 115 GW to 215 GW. The legislation includes that the construction and operation of renewables is in the public interest and necessary for public security. This brings several advantages: Every state in Germany must dedicate 2% of its land to onshore wind farms. Currently, 0.8% of Germany is designated for onshore wind. The projects regarding renewables have become precedents, which ensures accelerated federal approval and removes investment barriers.
In the USA, RWE has become the 4th largest renewable energy supplier after the acquisition of Con Edison Clean Energy Businesses, Inc. Natural gas, responsible for 39.8% of energy production in the United States, has become more expensive over the last year. Nuclear and renewable energy sources are therefore poised to profit from governmental benefits. The inflation reduction act prolonged the support for renewables by 10 years. Newly built projects will be eligible for support by tax credits or investment tax credits. If those projects use American raw materials, there will be an additional tax benefit to strengthen the domestic economy.
Operating Performance 2022
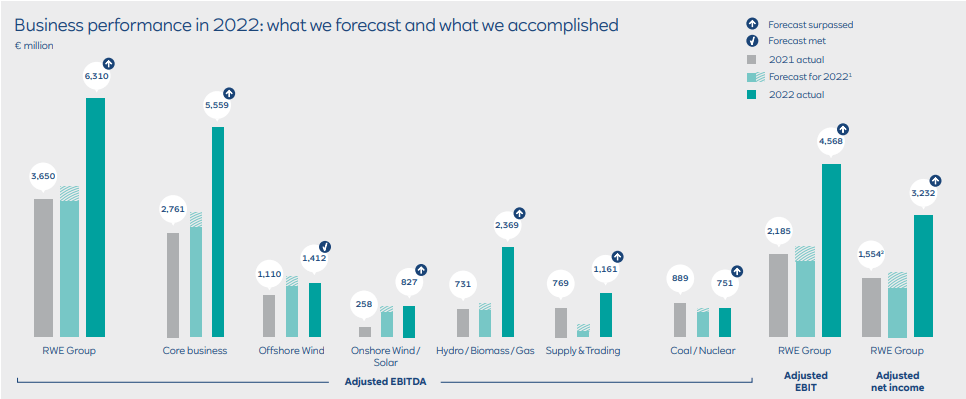
Based on EBITDA and net income RWE easily beat its expectations. A very strong core business performance due to high electricity prices brought RWE a record year. Even the "Coal/Nuclear" segment exceeded the upper end of expectations by 1 million. The runtime extension and reactivation of those plants made this possible. Especially the "Hydro/Biomass/Gas" segment performed extraordinarily well. According to RWE's annual report, the high market volatility will mean a short-term optimization of gas plants besides higher electricity margins.
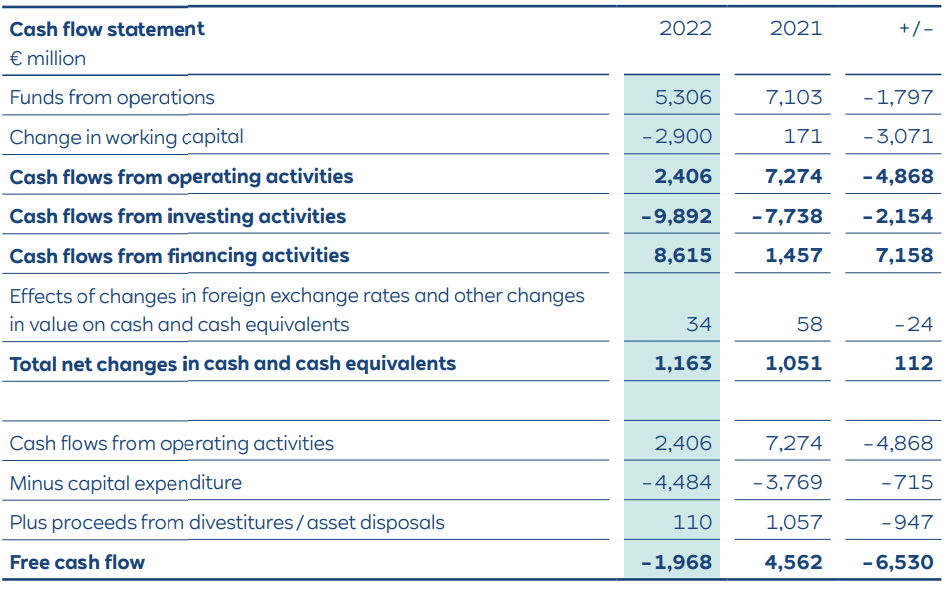
The most important part of a company's annual report is the cash flow statement, because it is the best way to see the actual movements of liquidity. RWE's cash flow from operating activities was only 2,406 million. This is far less than last year and also less than reported net income. So how is this possible? The main reason are high variation margins caused by the unprecedented spike in energy prices over the last twelve months. Those variation margins are necessary as a deposit when energy futures contracts are sold and suddenly increase in worth. In order to protect the buyer of the contract in case of a bankruptcy RWE is obliged to pay money as a surety. However, once the contract is settled those deposits get paid back. Therefore, variation margins are only a temporary outflow. In total, this caused a cash outflow of €4,026 million, while in 2021 variation margins were responsible for a cash flow of €2,154 million, making it a total difference of €6,180 million. This effect should reverse in 2023.
Portfolio And Pipeline
Back in March 2022 when I wrote my last article, RWE had a set goal to expand its renewable portfolio (including gas plants, which can also be used for hydrogen) to 50 GW until 2030. After its recent acquisition of Con Edison Renewables, this goal will likely be exceeded by far.
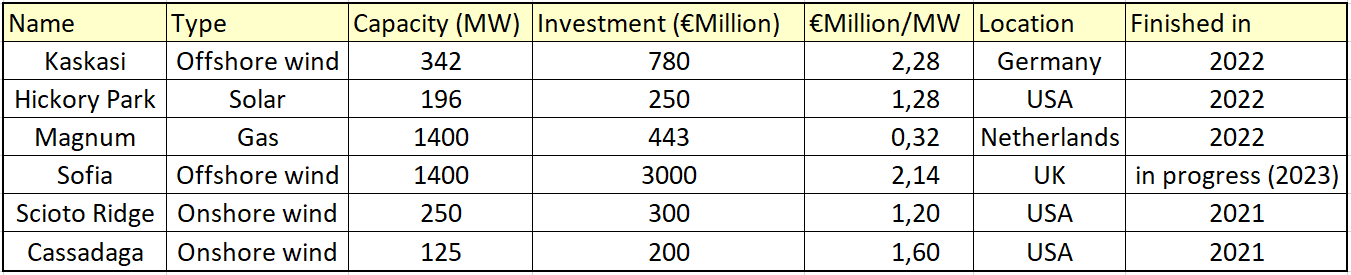
To evaluate whether a project is worth investing in, RWE calculates its IRR (internal rate of return). The current WACC combined with project-specific risk premiums is deducted from the IRR. The result of this calculation needs to be between 100-300 basis points to allow a proper risk-reward ratio. In the following table, you can see some of the most recent projects (and the acquisition of Magnum gas plant).
Graphic made by the author using data from RWE's annual report (Annual report RWE)
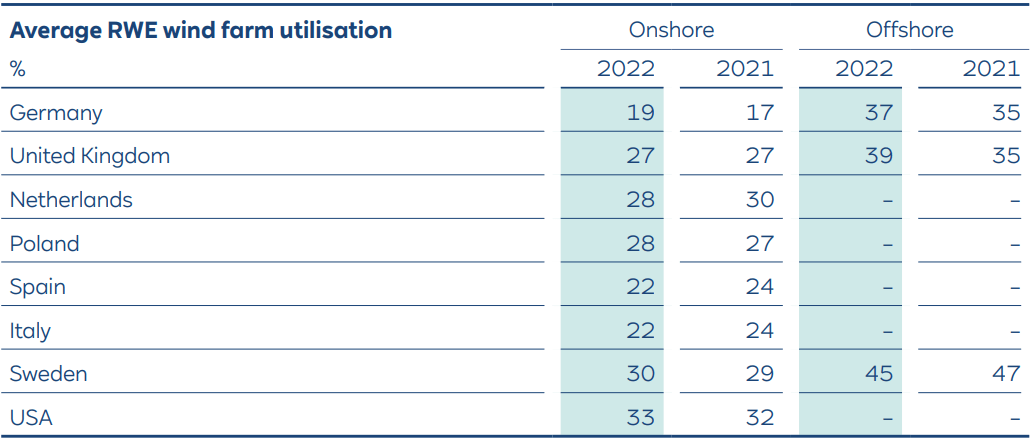
The money invested per MW capacity is by far the highest for offshore wind farms and there is an obvious reason for it. The utilization of wind farms is just much higher offshore. For Germany, the offshore utilization was almost double in 2022 and for Sweden and the UK, which have naturally more onshore wind it was still about 50% higher. The capacity (in megawatts) just shows the amount of electricity (in MWh) produced if the underlying wind farm (or solar farm) worked at a 100% utilization. This is of course never the case, as the sun doesn't always shine nor is there always an appropriate wind force.
Kaskasi for example is at the northern German coast and should therefore have a utilization rate of around 37%. Multiplying the capacity of 342MW with 8760h (hours per year) the output is 2995.92 GWh. Now considering the utilization rate of 37% the expected output for 2023 might be around 1108.5 GWh. Going back to the electricity price chart at the top (135.6€/MWh), I can calculate an expected revenue of around €150 million for Kaskasi. Obviously, this highly depends on the development of electricity prices. RWE assumes a runtime of 25 years for wind farms and depreciates the value over that period. Renewable energy has high EBITDA margins as there are no material costs (i.e., coal, lignite, fuel rods, gas). Although the "Coal/Nuclear" segment alone produced 69,143 GWh in 2022 the EBITDA was only at €751 million. Meanwhile, the renewable "Offshore wind" segment only generated 10,203 GWh but contributed €1.412 billion EBITDA.
Strategy And Growth Prospects
RWE has a set goal on which it puts its whole focus: Going green. They prioritize high capital expenditures on the renewable portfolio over dividend increases and stock buybacks. If you have a long-term horizon as a shareholder I think that the company trades on a really cheap level and the management does excellent work. The recent acquisition of Con Edison's (ED) renewable business was partly funded by issuing mandatory convertible bonds to a subsidiary of the Qatar Investment Authority. This will increase share count by 9.1% after conversion. However, I would not overestimate the dilution for existing shareholders as the QIA did most likely invest with a long-term horizon as well. Comparing this to the tremendous advantage RWE gains in the United States it seems like a superb deal for shareholders. Con Edison boasts 3.1 GW of renewable generation capacity (~90% of which is solar) and a development pipeline of over 7 GW. This makes RWE the fourth-largest renewable energy producer in the USA. At the end of 2022, RWE had an installed capacity of 39.3 GW comprising 14.3 GW of gas (36%), 13.0 GW of renewables (33%), and 11.9 GW of fossil fuels (31%).
Peer Group And Valuation
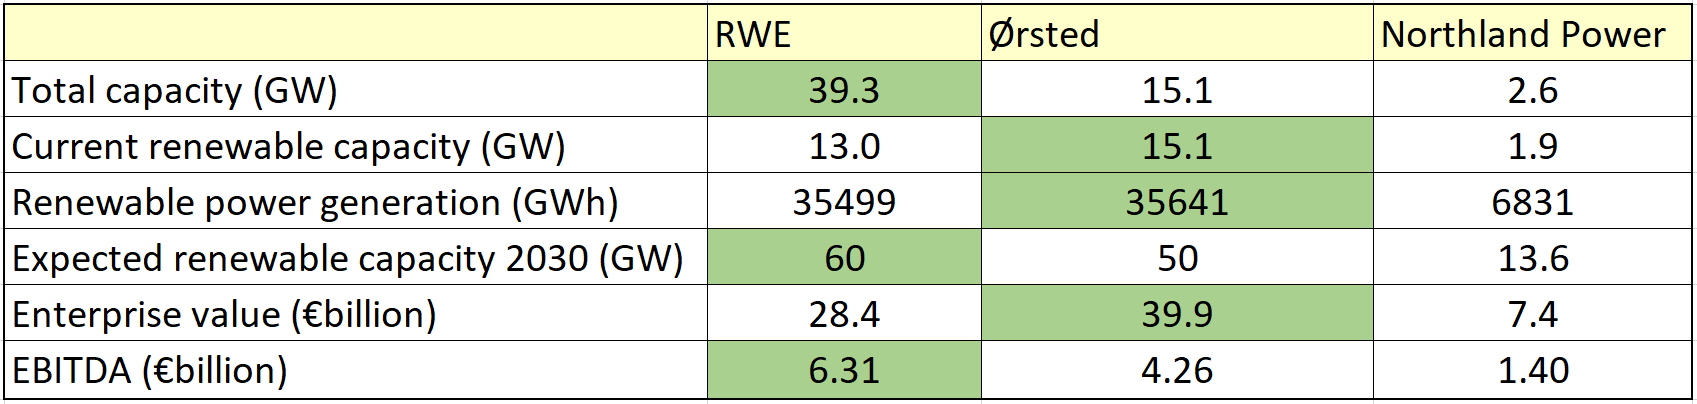
In my last published analysis, I used the installed capacity of renewable energy sources for valuation. I think that this gives a good indication of a company's cash-generating ability. However, it is also important to consider the location and therefore the utilization of those. For example, a 6 MW offshore windmill generates more MWh than the same windmill at a low wind onshore location. As a peer group, I used Northland Power (NPIFF) and Ørsted (DNNGY).
Graphic made by the author using data of the annual reports (Annual reports of RWE, Orsted and Northland Power)
By sheer size, RWE is considerably larger. However, Ørsted has the largest renewable capacity and, even though its utilization is slightly lower, also produced the most renewable electricity. The enterprise value per TWh of renewable energy in 2022 is an interesting metric: For RWE, an investor has to pay slightly over 0.800 €billion/TWh, for Ørsted it is 1.120 €billion/TWh and Northland Power trades at the highest ratio of 1.405 €billion/TWh. Assuming, the above listed companies all meet their disclosed (or by me calculated) target for 2030 RWE has the highest growth rate at 24.4% CAGR, Northland Power is in the middle at 21.4%, while Ørsted is last at only 18.7%. It is important to know that RWE includes around 16 GW of flexible gas-powered energy plants in its renewable capacity. These plants are necessary for flexible production and can be used with hydrogen in the future. At a 2030 Capacity/EV ratio RWE has the cheapest valuation at 2.11 GW/€billion. Northland is quite close at 1.84 GW/€billion and Ørsted is in last place again at 1.25 GW/€billion. I expect RWE's share price to trade at a similar valuation as soon as the transformation will have completed. Using the average of the two peers, the market cap should increase by 29.5%. This would be a share price of €53.2 and it does not even consider a higher valuation due to more capacity and higher cash flow, but solely the discrepancy of current valuation. I presume Northland has a higher valuation due to being a monthly dividend payer yielding over 3.5%, while RWE and Ørsted are both around 2%. Therefore, I think that while the Canadian company is at a fair valuation, RWE is too cheap and Ørsted is too expensive. Don't get me wrong, the Danish company is performing well, but at the current valuation, I still see some downside.
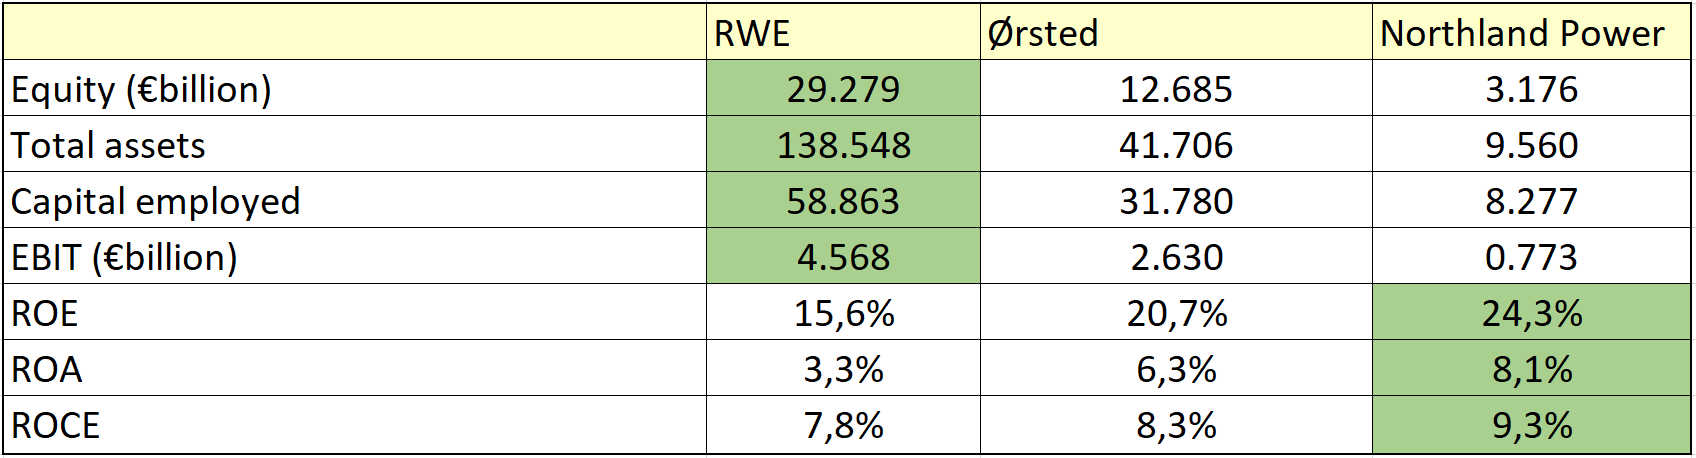
Renewables are an asset-heavy business. It is not scalable like some software companies and needs lots of investment to succeed. "Return on assets" (ROA), "Return on capital employed" (ROCE) and "Return on equity" (ROE) are three metrics suitable to evaluate these companies.
Graphic made by the author showing different return metrics (Annual reports of each company)
You can see that RWE is the largest of the three. However, Northland Power is top at ROE, ROA and ROCE. The low ROA is common in the electricity business. Due to high current assets, which include derivatives and sureties to mitigate electricity price risk the balance sheet looks inflated at first glance. ROCE is similar and it indicates that all three can increase debt to fuel growth (as long as the cost of capital is less than ROCE). To not cause any confusion to readers who are familiar with Ørsted: According to its 2022 balance sheet, the ROCE is 16.8% instead of the 8.3% I calculated. Ørsted used "total non-current assets" subtracted by "total current liabilities" instead of "total assets" subtracted by "total current liabilities". This eliminates "current assets" from the calculation, which include above mentioned derivatives and sureties. Frankly, I do not know why they do that.
Risks
Market risks are the biggest "problem" RWE can face. A deterioration in electricity prices can diminish cash flows and severely hinder future investments mandatory for growth. In 2022, €1.9 billion in write-backs were applied to gas and coal plants as well as mines. A price decline will lose billions of Euros of impairments. However, RWE uses derivatives to sell electricity forward and therefore mitigates risks. Another point mentioned in the risk section of RWE's annual report are regulatory risks. The recent energy crisis has shown that governments (i.e., Germany, UK) will intervene and impose revenue caps, if necessary. However, I do not think that this will be problematic in the future. Those revenue caps were set to mitigate the large price increase for retail customers and make electricity affordable. Even if those caps will stay for longer it just means that RWE is making a ton of money.
Conclusion
RWE remains a highly attractive investment in the long term. A strong balance sheet paired with high future cash flows will enable acquisitions and investments in its renewable portfolio. I expect the share price to align with the business performance and meanwhile just lean back, collect dividends (a dividend increase to €1.00 per share has been proposed by the management) and enjoy RWE becoming a fully renewable energy company.
Thank you for reading my article. If you have questions, do not hesitate and ask. I happily answer all of them.
For further details see:
RWE: Remarkable Disparity Between Operating Performance And Stock Price