ACTV - S&P 500: A Crucial Test - Week Starting Feb 27th (Technical Analysis)
Summary
- The S&P 500 is reacting to 'higher for longer' rate expectations and has dropped into key support in the 3940-50 area.
- This crucial technical area could decide how the first half of the year unfolds.
- What to watch in the S&P 500 in the week ahead.
Last week's question of whether the S&P 500 ( SPY ) was making a bullish consolidation or rolling over was answered decisively on Tuesday's re-open as markets traded sharply lower. This was the largest drop of the year so far and continued into the crucial 3940-50 area, a cluster of support which has been highlighted in each of the last three weekend updates. Friday saw a decent recovery off 3943, but was this enough to signal a low is in?
In an attempt to answer that, a variety of technical analysis techniques will be used to look at probable moves for the S&P 500 in the week ahead. The S&P 500 chart will be analyzed on monthly, weekly, and daily timeframes, then the information collated into an actionable summary at the end with both bear and bull scenarios guided by inflection points.
The Market Narrative
'Higher for longer' rate expectations remain at the fore of the narrative and were aggressively priced in this week. Rising yields across the curve pushed the 10-year to 3.978%, the 6-month to new cycle highs at 5.11% and the 1-year to 5.06%. The 1-year yield is now higher than the dividend yield of all but 20 of the stocks in the S&P500 and also higher than its earnings yield. It's a compelling alternative.
Rate cut expectations for Q4 always looked optimistic have been mostly priced out again. The CME FedWatch Tool shows a 91% probability the Fed Funds Rate is over 5% in December 2023 and a 20% probability it is in the 5.5%-5.75% band.
The issue in the coming weeks is whether markets are overreacting. Data in January is traditionally noisy and if the February figures cool off, the Fed may dismiss recent releases as seasonal one offs. Hikes in March and May look certain, but there is a long way to go until June and data could still go either way.
S&P 500 Monthly
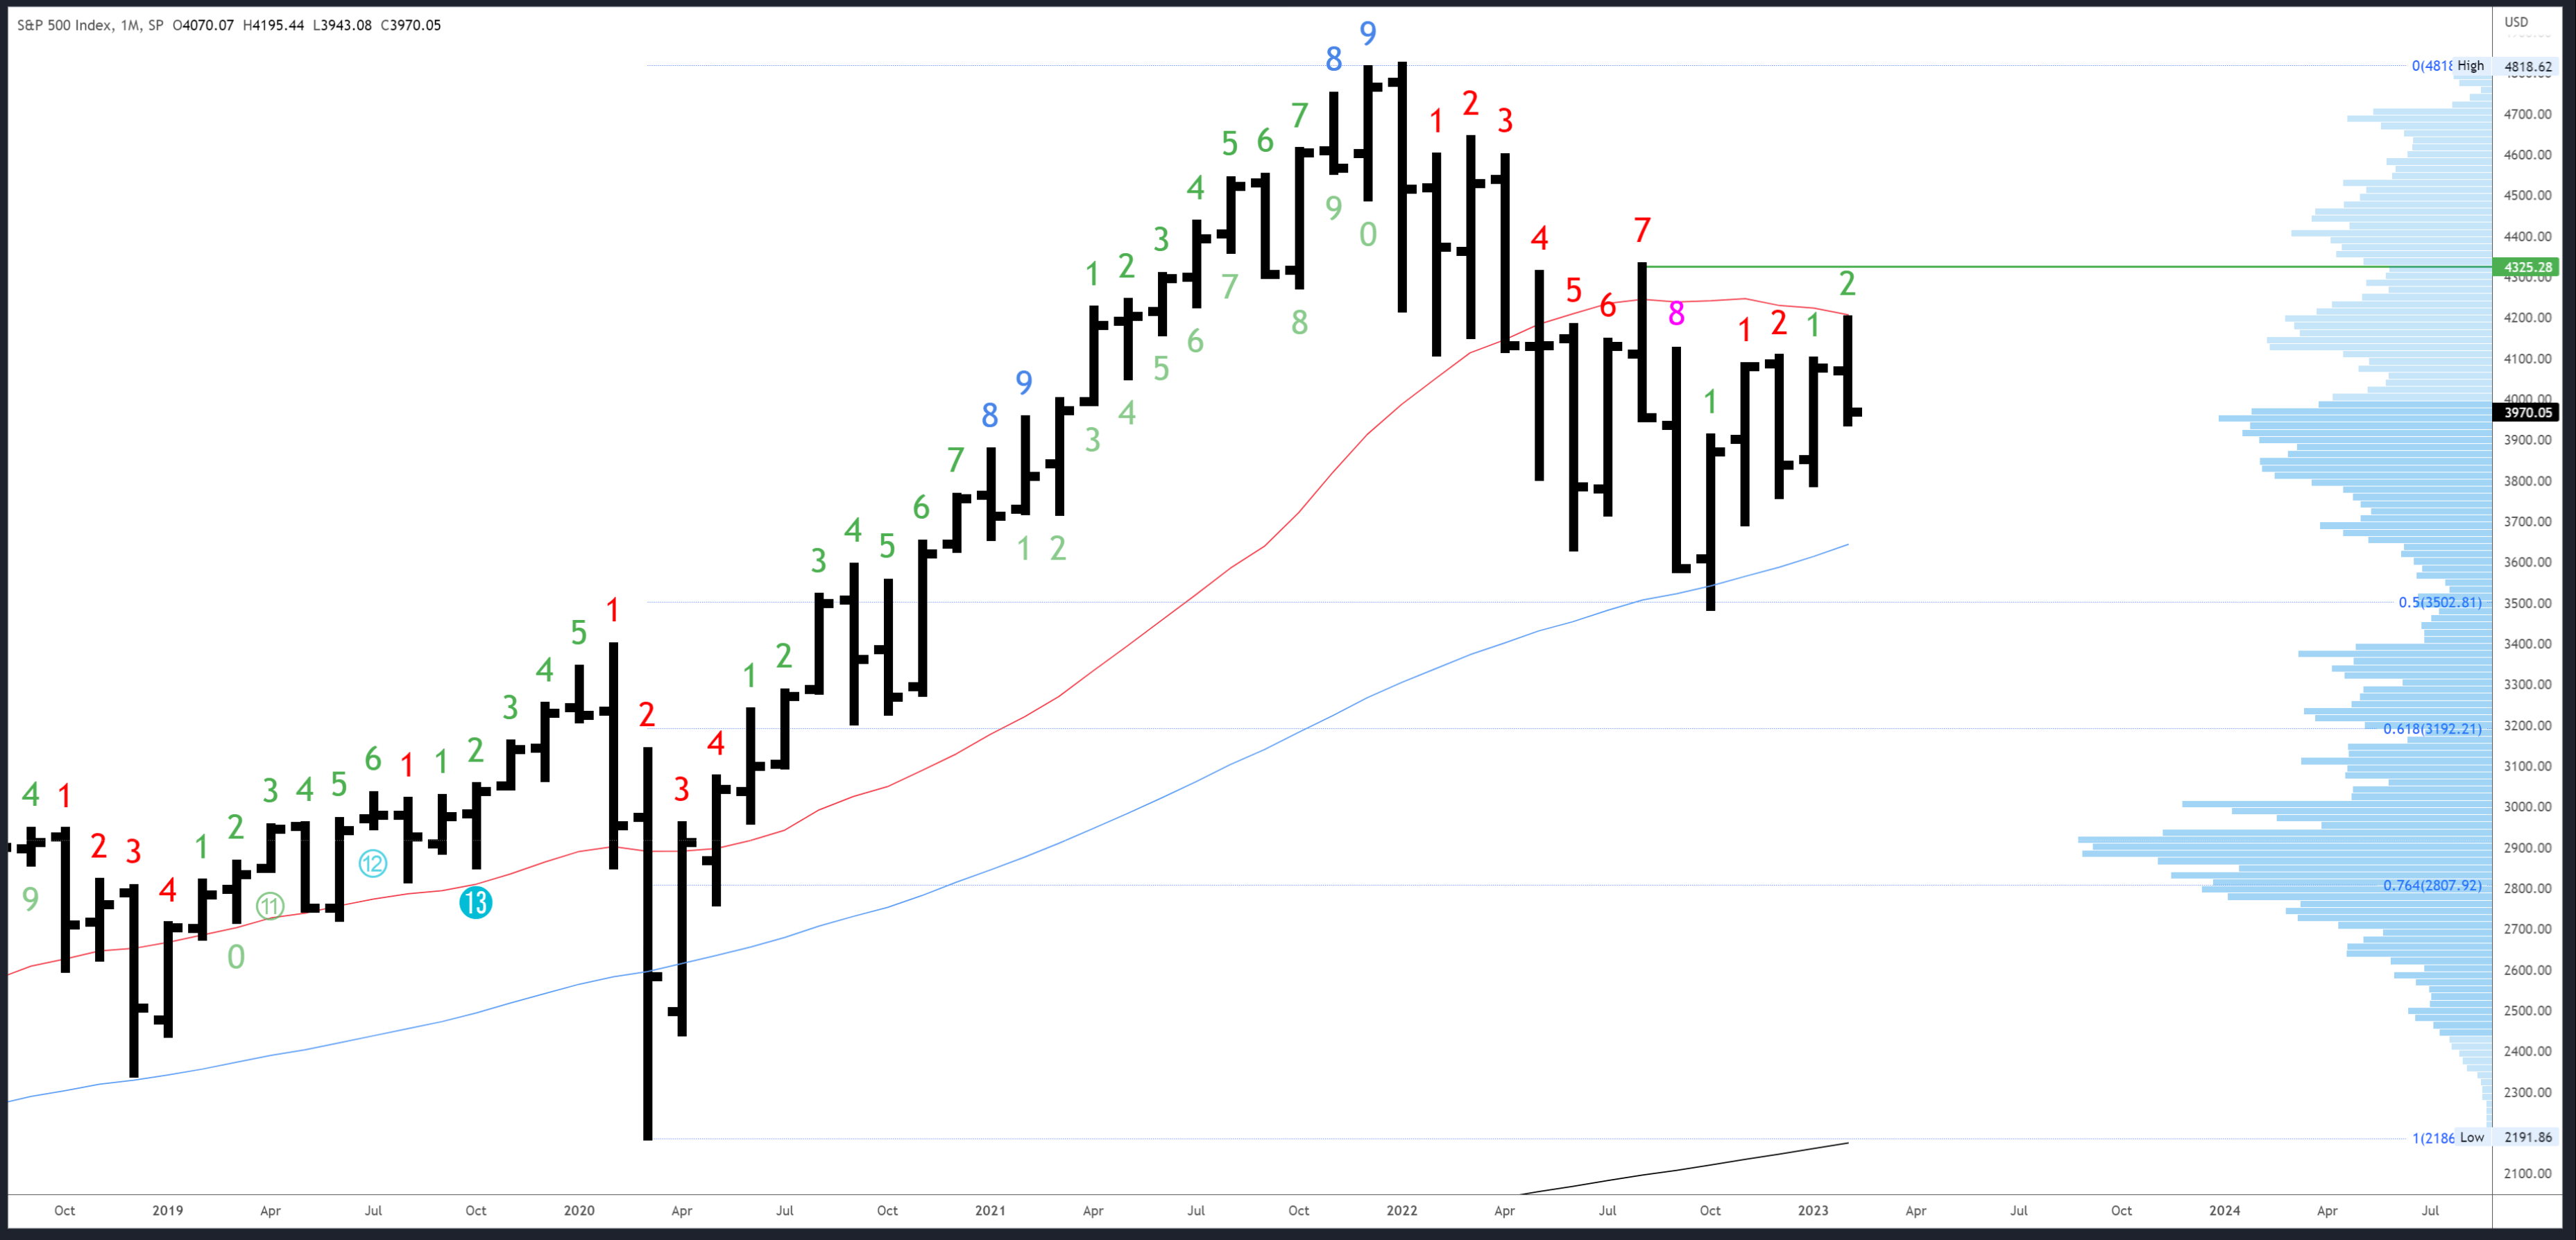
The February bar will close on Tuesday, so barring an unlikely 100 point rally over the next two days, it will close under 4070 and lower for the month. After making higher highs above the January bar, this would create a reversal pattern off the 20MA at 4195. Traders looking for the next leg of the bear market will want to see a higher timeframe reversal, and in two days they could get one.
The 4195 high and the 20ma remain initial resistance, followed by 4325 at the high of August.
Initial support comes in at 3794 and the January lows, with the 50MA a distant 3643.
There are no exhaustion signals in either direction (using Demark methods), although downside exhaustion was very nearly registered in October, so we can say this is being reset with the current rally.
S&P 500 Weekly
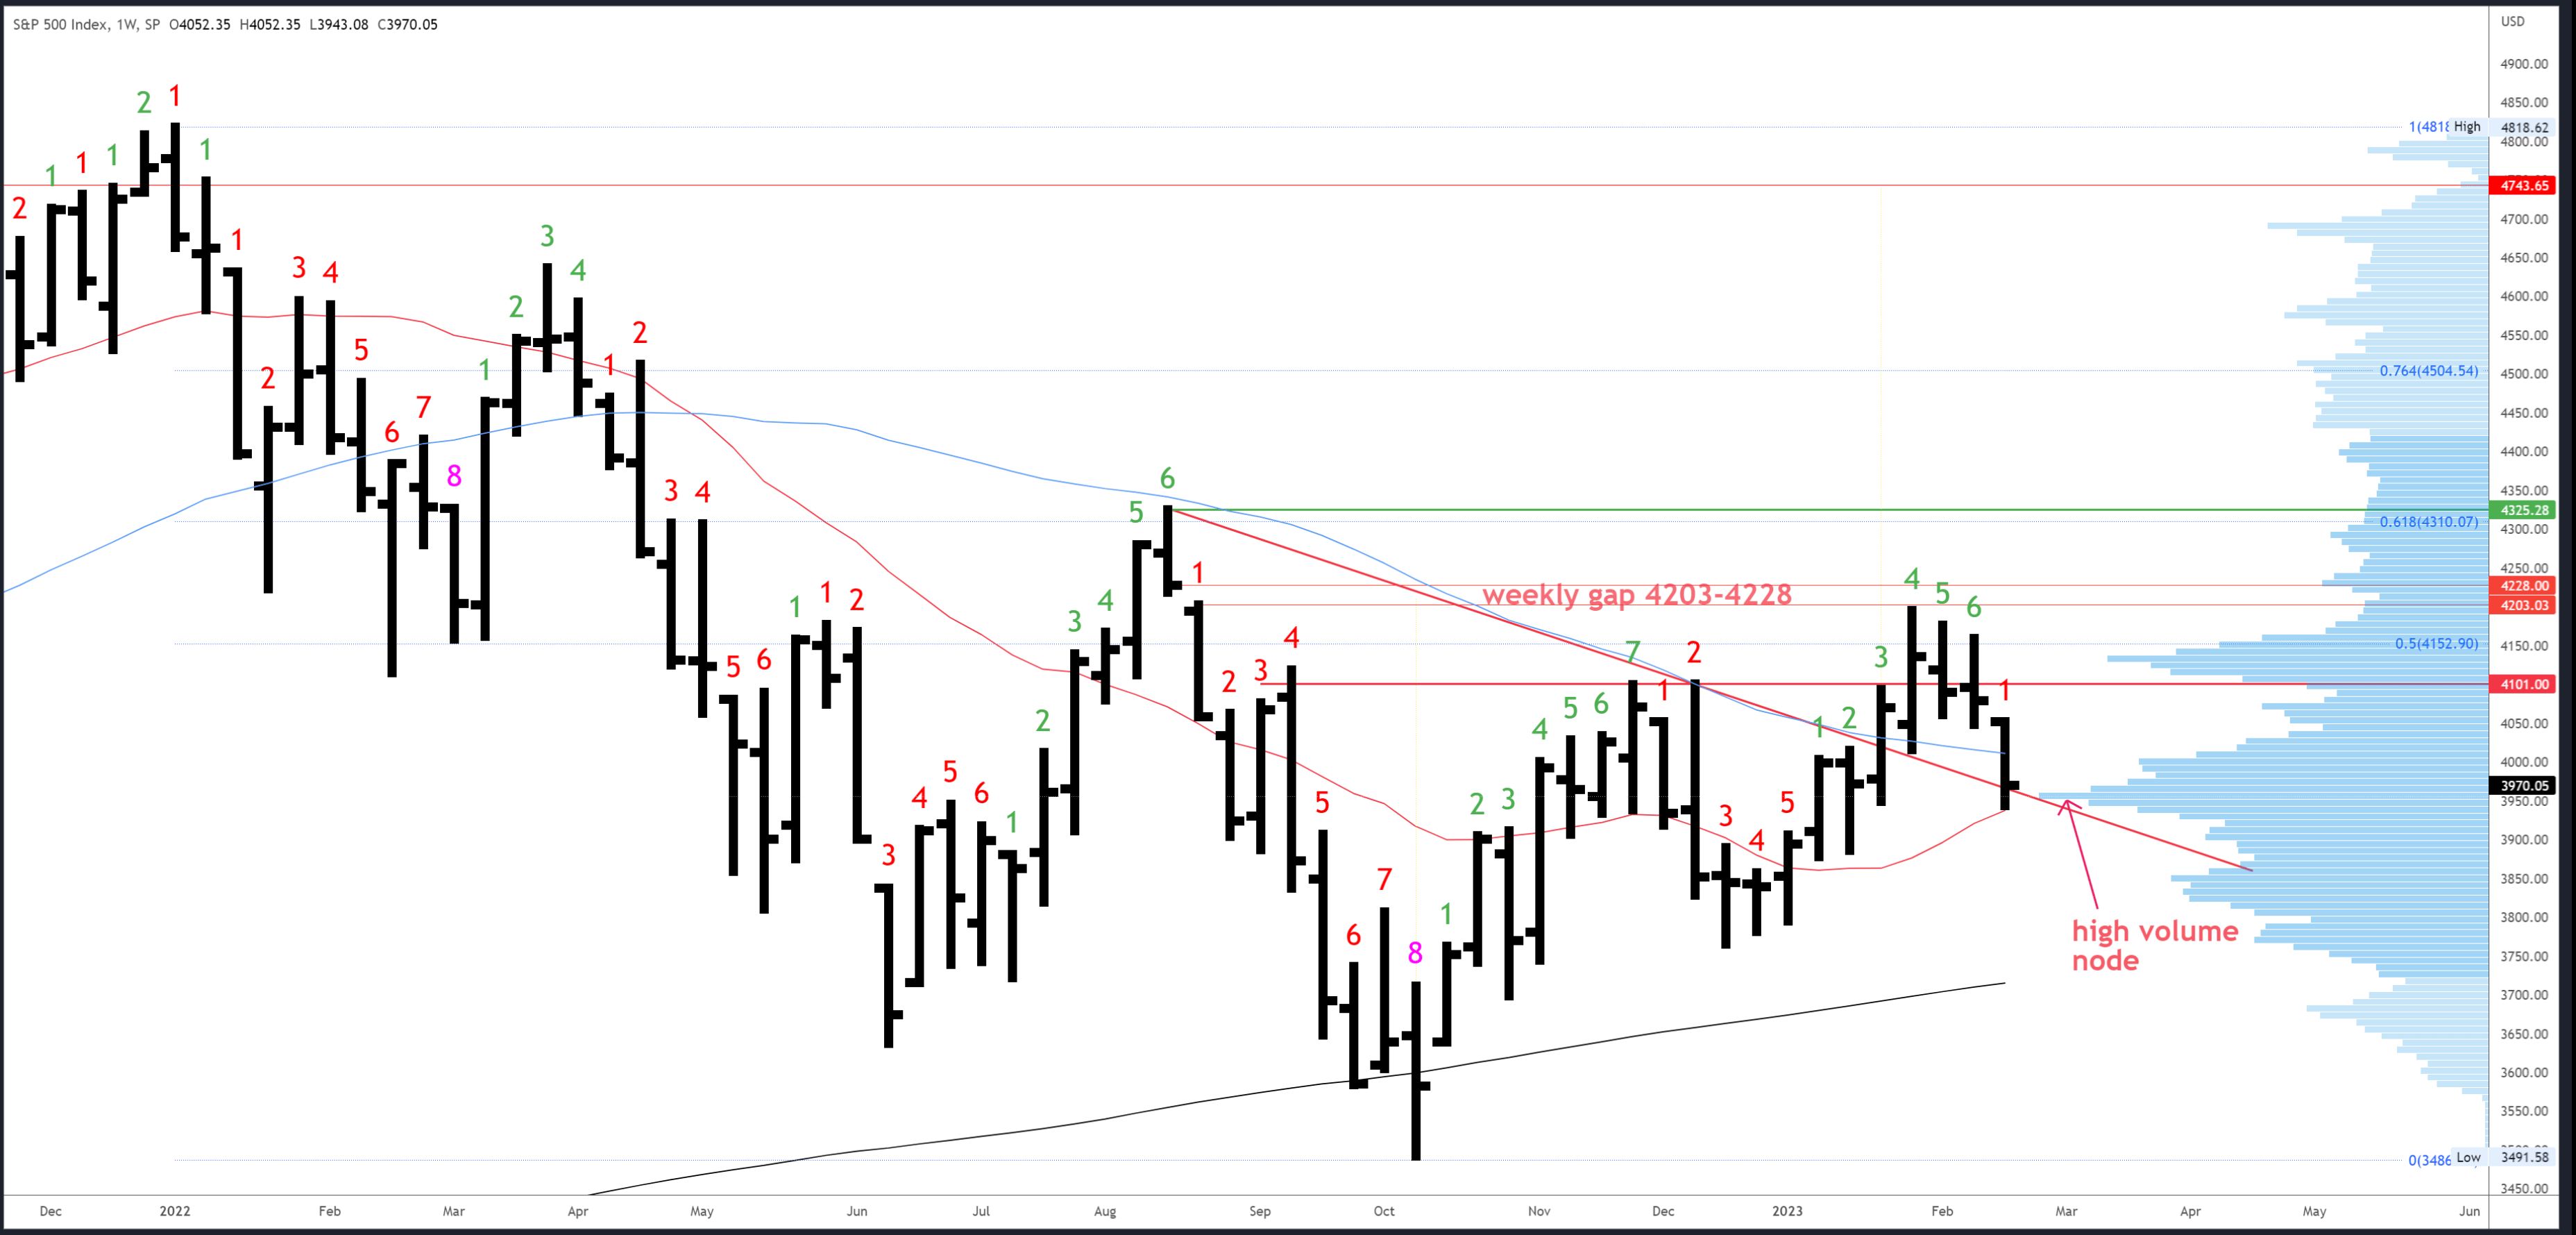
Last week's bar broke the bullish momentum and flushed lower to test some key levels. The low was right on the 20MA, and the close held the trendline re-test and the high volume node at 3950. More volume has traded at 3950 than any other price since the 2022 top.
Holding key levels is a plus, but the weekly bar shows no real signs of reversal and there could still be a lower low.
Resistance is at last week's high and the breakdown point of 4047-4052, then 4101.
All good supports in this area have been tested and the January low of 3794 and the 200MA at 3715 are the next references. The 20MA and trendline will be around 3954 next week so bulls will want to see a close over this area.
The upside exhaustion count failed (which itself is a bearish sign) and a downside count will be on bar 2 (of a possible 9) next week.
S&P 500 Daily
With so many potential supports in one area, it can get confusing as to which one will work (if any). The expansion pattern at this week's lows reflects this indecision as traders kept buying for a bounce but never held strong against one specific level.
SPX Expansion (15 minute chart) (Tradingview)
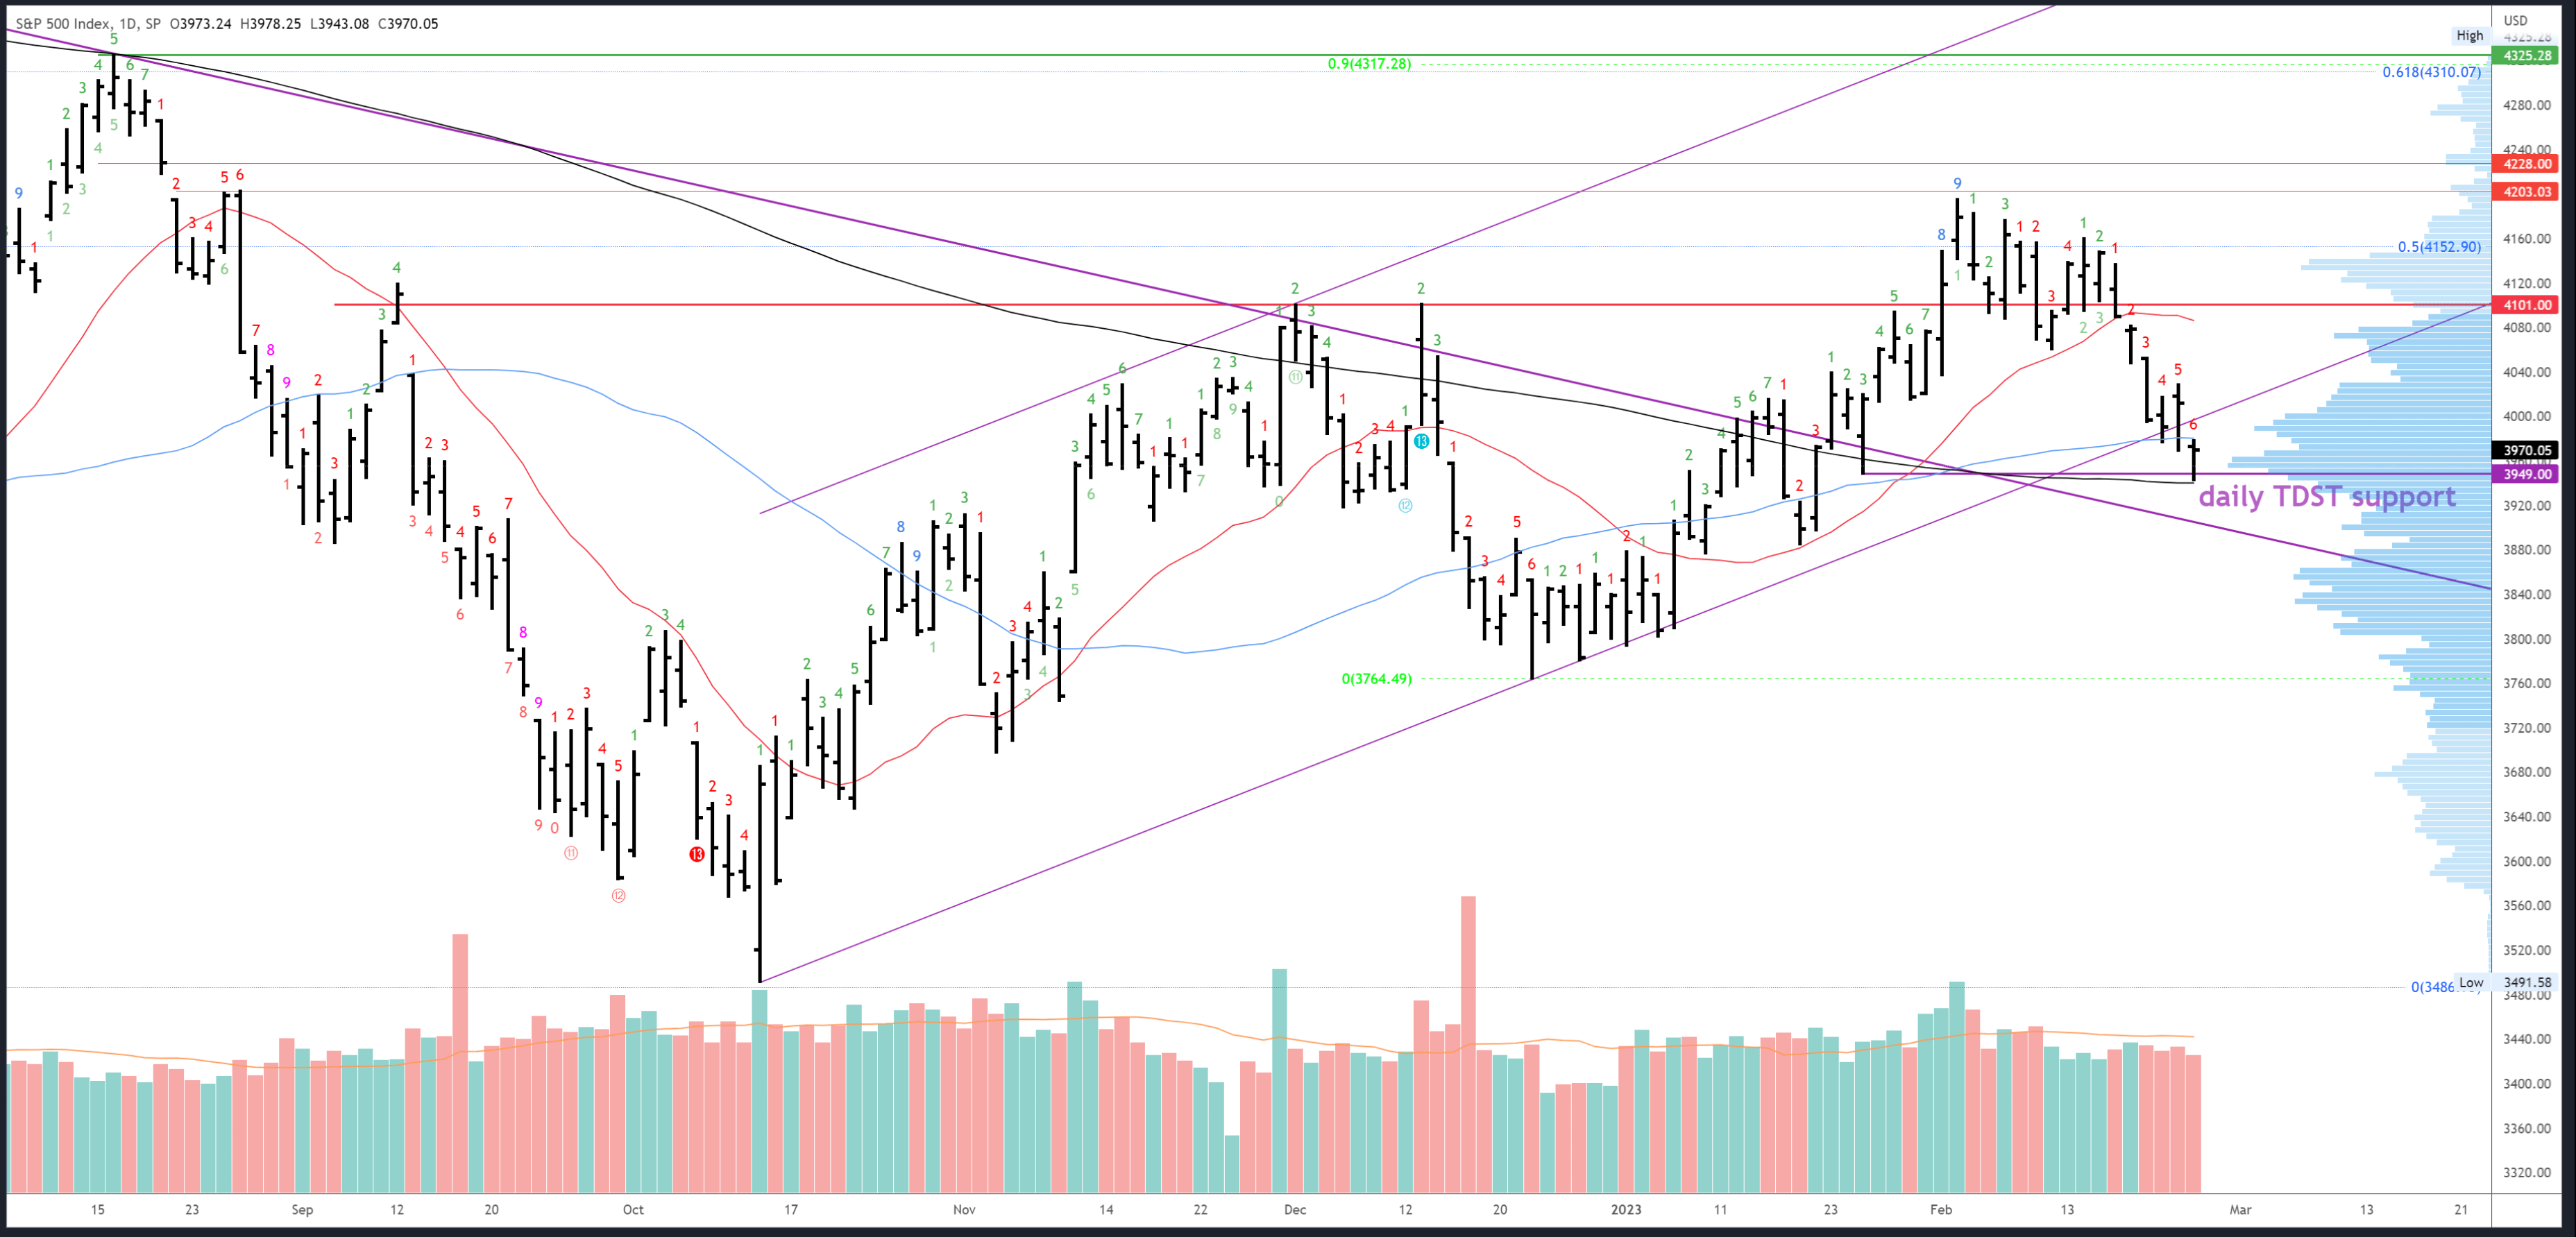
I tend to look for confluence where two supports are very close together and at the very least there should be a reaction. Last week the 50dma and trendline support were together at 3978 and I called a bounce there ahead of Wednesday's open (see last week's comment section) but also warned 3950 would still come.
Friday's eventual reversal from 3943 came just above the 200dma at 3940 and TDST support. Key levels held, but is the reversal bar enough to signal the low is in? It's actually a very similar bar to the previous Friday and we all know what happened next. Furthermore, broken supports on the way down will act as resistance and hinder attempts to rally.
Initial resistance is now at the 50dma and Friday's high 3978-80. 4028 and Thursday's high is the bigger level and a close above would likely signal the low is in for the week.
Similar to the weekly chart, most good support levels in the area have now been tested. Dropping through 3940 and the 200dma would target the trendline re-test at 3900 and there is very little below.
A downside exhaustion count will be on bar 7 (of a possible 9) on Monday. We could therefore see exhaustion on Tuesday / Wednesday leading to a recovery.
Scenarios for Next Week
Bullish
The S&P 500 has tested key levels and held them. Holding the 3943 low would be a major plus and closes above 4028 and 4052 would take it out of the danger zone and bulls can look for cooling data to ignite the rally again. The weekly close should really hold 3954.
Bearish
Breaking 3940 would target 3900 and closing below 3954 (and even better, 3940) would completely take the wind out of the bulls sails. While the decline should try to make lower lows next week, bears shouldn't be discouraged if these fail and bounce back up again to the 4050s. Significant support clusters can take time to break and a correctional rally would reset any downside exhaustion signals due to register on Tuesday/Wednesday.
Conclusion
The S&P 500 is reacting to 'higher for longer' rate expectations and has dropped into key support in the 3940-50 area. This has held, as it should on the first test, but will be a key battleground over the coming weeks.
For further details see:
S&P 500: A Crucial Test - Week Starting Feb 27th (Technical Analysis)