ACTV - S&P 500: Bear Targets - Week Starting March 13th (Technical Analysis)
2023-03-12 09:37:28 ET
Summary
- The narrative has shifted bearish, supports have broken and bears are in charge.
- What to watch in the S&P 500 in the week ahead.
- Key technical levels and probable outcomes.
The S&P 500 (SPY) made a 'bearish engulfing' candle this week, a move driven by a more hawkish Fed and the largest bank failure since the GFC. Closing below the 200dma on heavy volume puts the bears in control, but can they maintain the momentum?
In an attempt to answer that, a variety of technical analysis techniques will be used to look at probable moves for the S&P 500 in the week ahead. The S&P 500 chart will be analyzed on monthly, weekly, and daily timeframes, then the information collated into an actionable summary at the end with both bear and bull scenarios guided by inflection points.
The Market Narrative
It took Fed Chair Powell just 34 days to pivot from the dovish leaning of the February 1st meeting back to this week's ultra hawkish stance. Powell's comments confirmed the Fed has been rattled by the re-strengthening of data and 'higher for longer' rates are likely needed to cool the economy. A 50bps is even on the cards, depending on "the totality of the data," which presumably refers to NFP, which was inconclusive (a beat of the headline number was offset by higher unemployment and a lower-than-expected rise in average hourly earnings), and CPI next week. A weak CPI number could ensure a 25bps hike and undo most of this week's drop.
The situation has been complicated by the collapse of Silicon Valley Bank ( SIVB ). Fears of contagion weighed heavily on the banking sector. Some say it could get the Fed to pause again, some say it could lead to crash; it's probably neither, but it's also not to be ignored: the divergent move lower in yields and the USD while the S&P500 remained under pressure is noteworthy. Expectations for the terminal rate have already declined from Tuesday's peak of 5.7%, to 5.3% on Friday, with rate cuts expected to take the Fed Funds Rate below 5% at the end of the year.
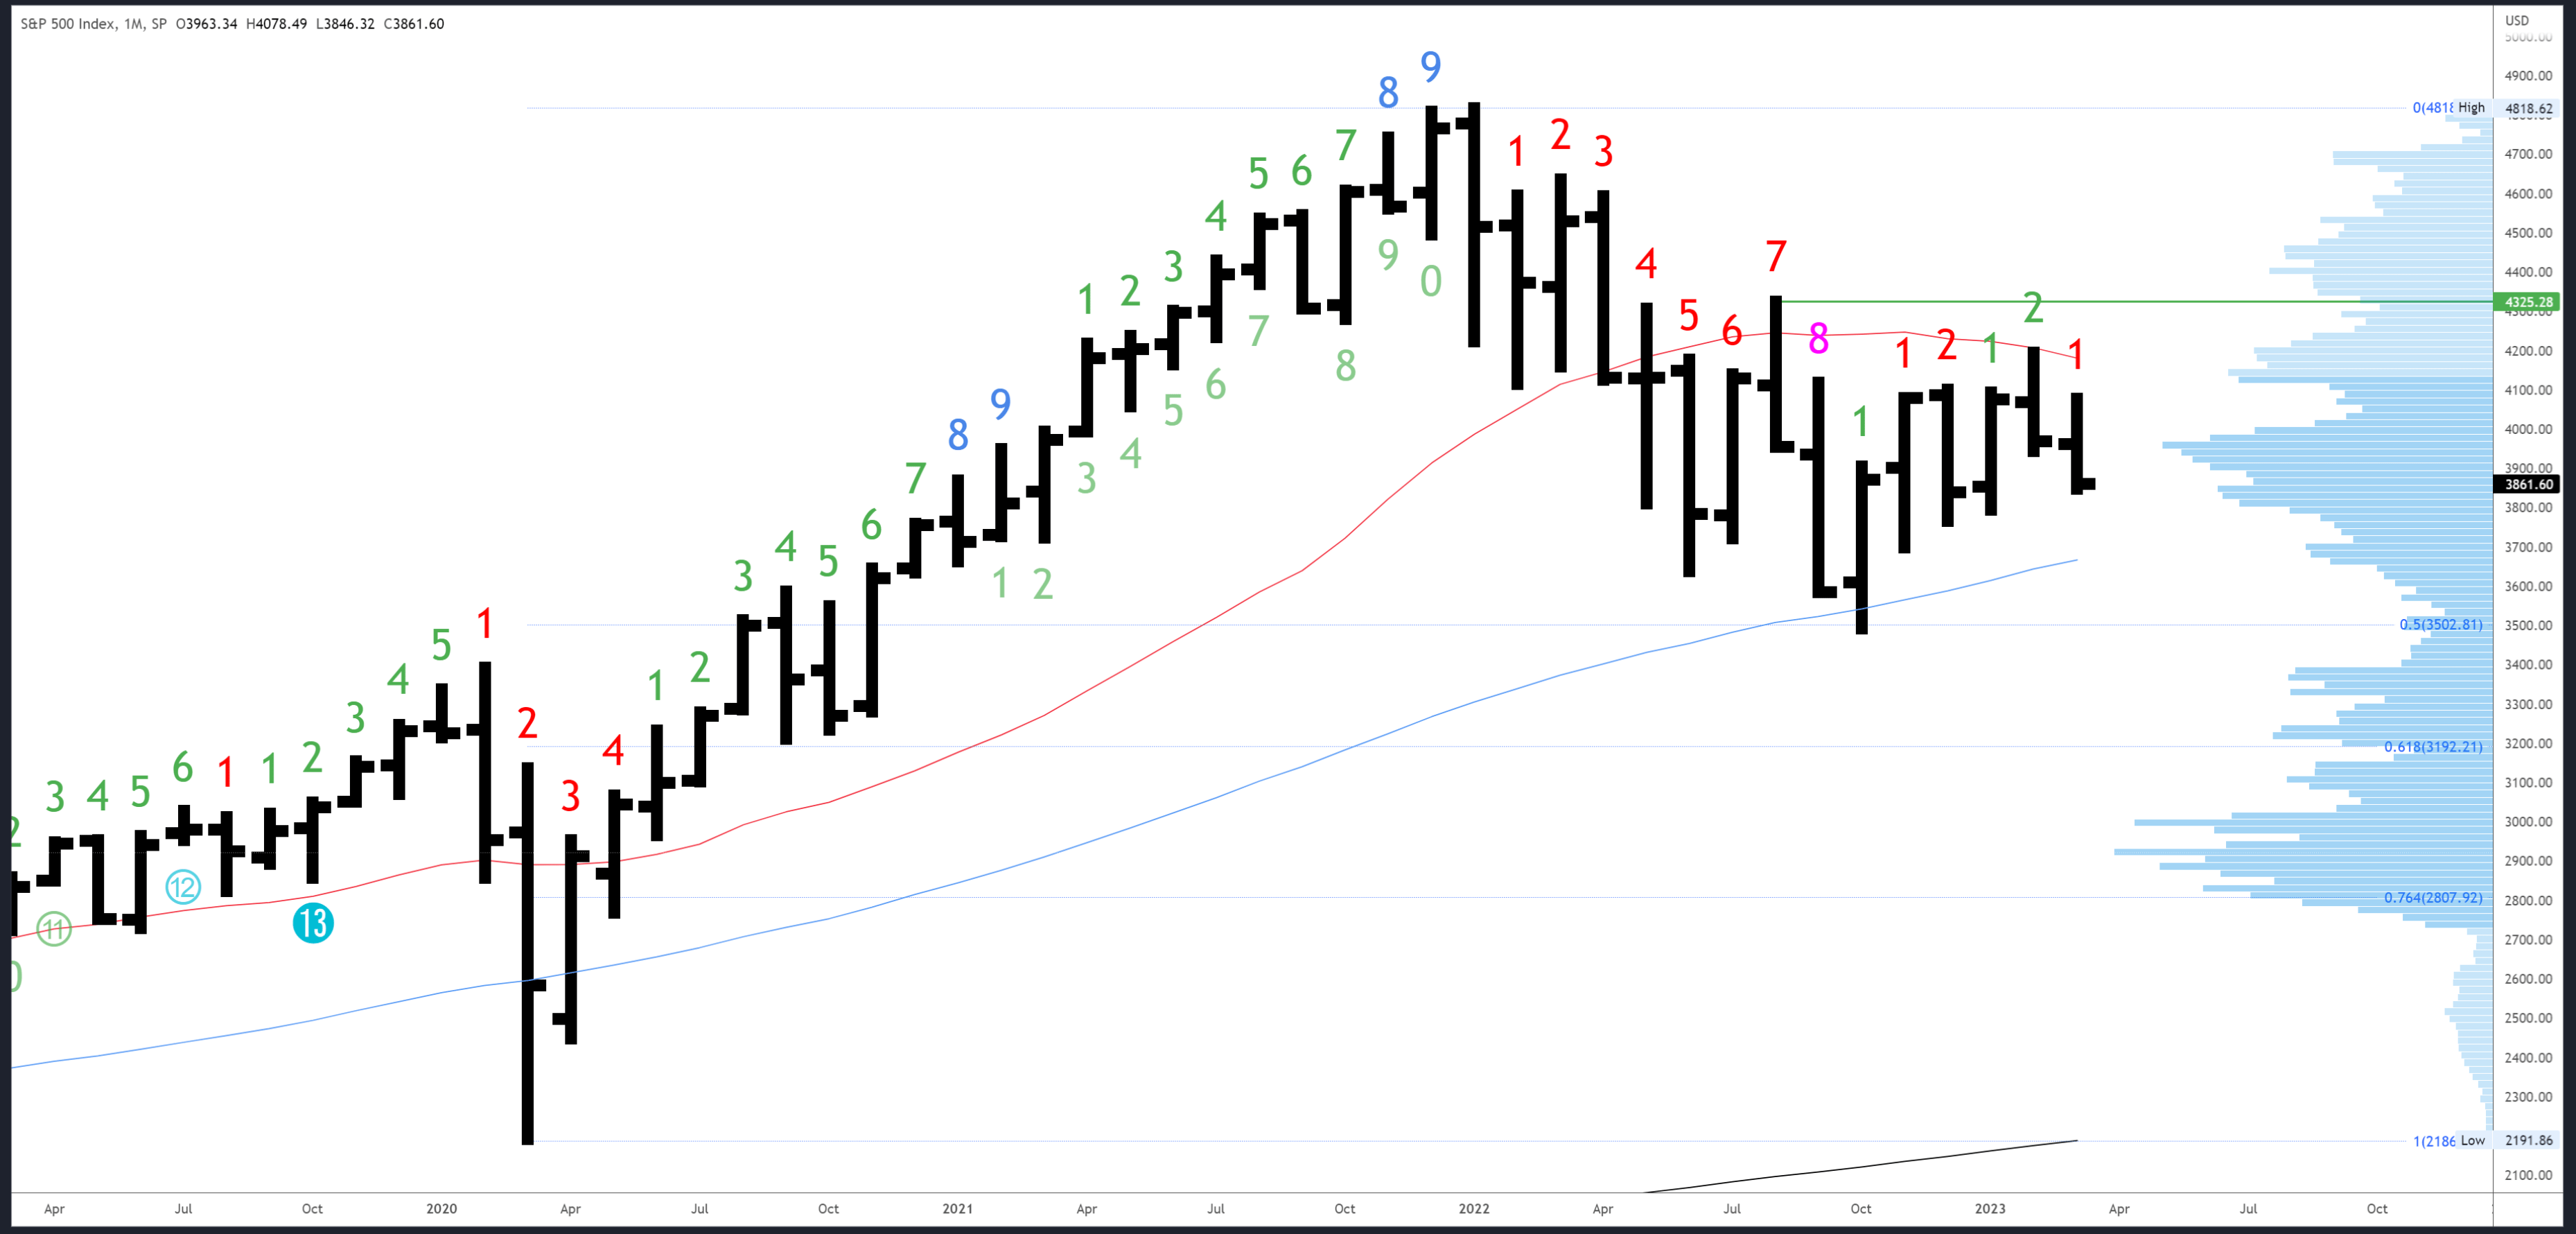
S&P 500 Monthly
After February's reversal, the March bar is testing lower. This month's 3846 low is very near the 2022 close, and the Q1 bar has now formed a doji (the open and close near the same price), although there is obviously some time before the bar closes. Support at the January has yet to be tested.
The 4195 high and the 20MA (now slightly lower at 4189) remain the first major resistance levels, followed by 4325 at the high of August.
Support comes in at 3764-3794 at the December and January lows, with the 50MA at 3670.
There are no exhaustion signals in either direction (using Demark methods), although downside exhaustion was very nearly registered in October, so we can say this is being reset with the move from that low.
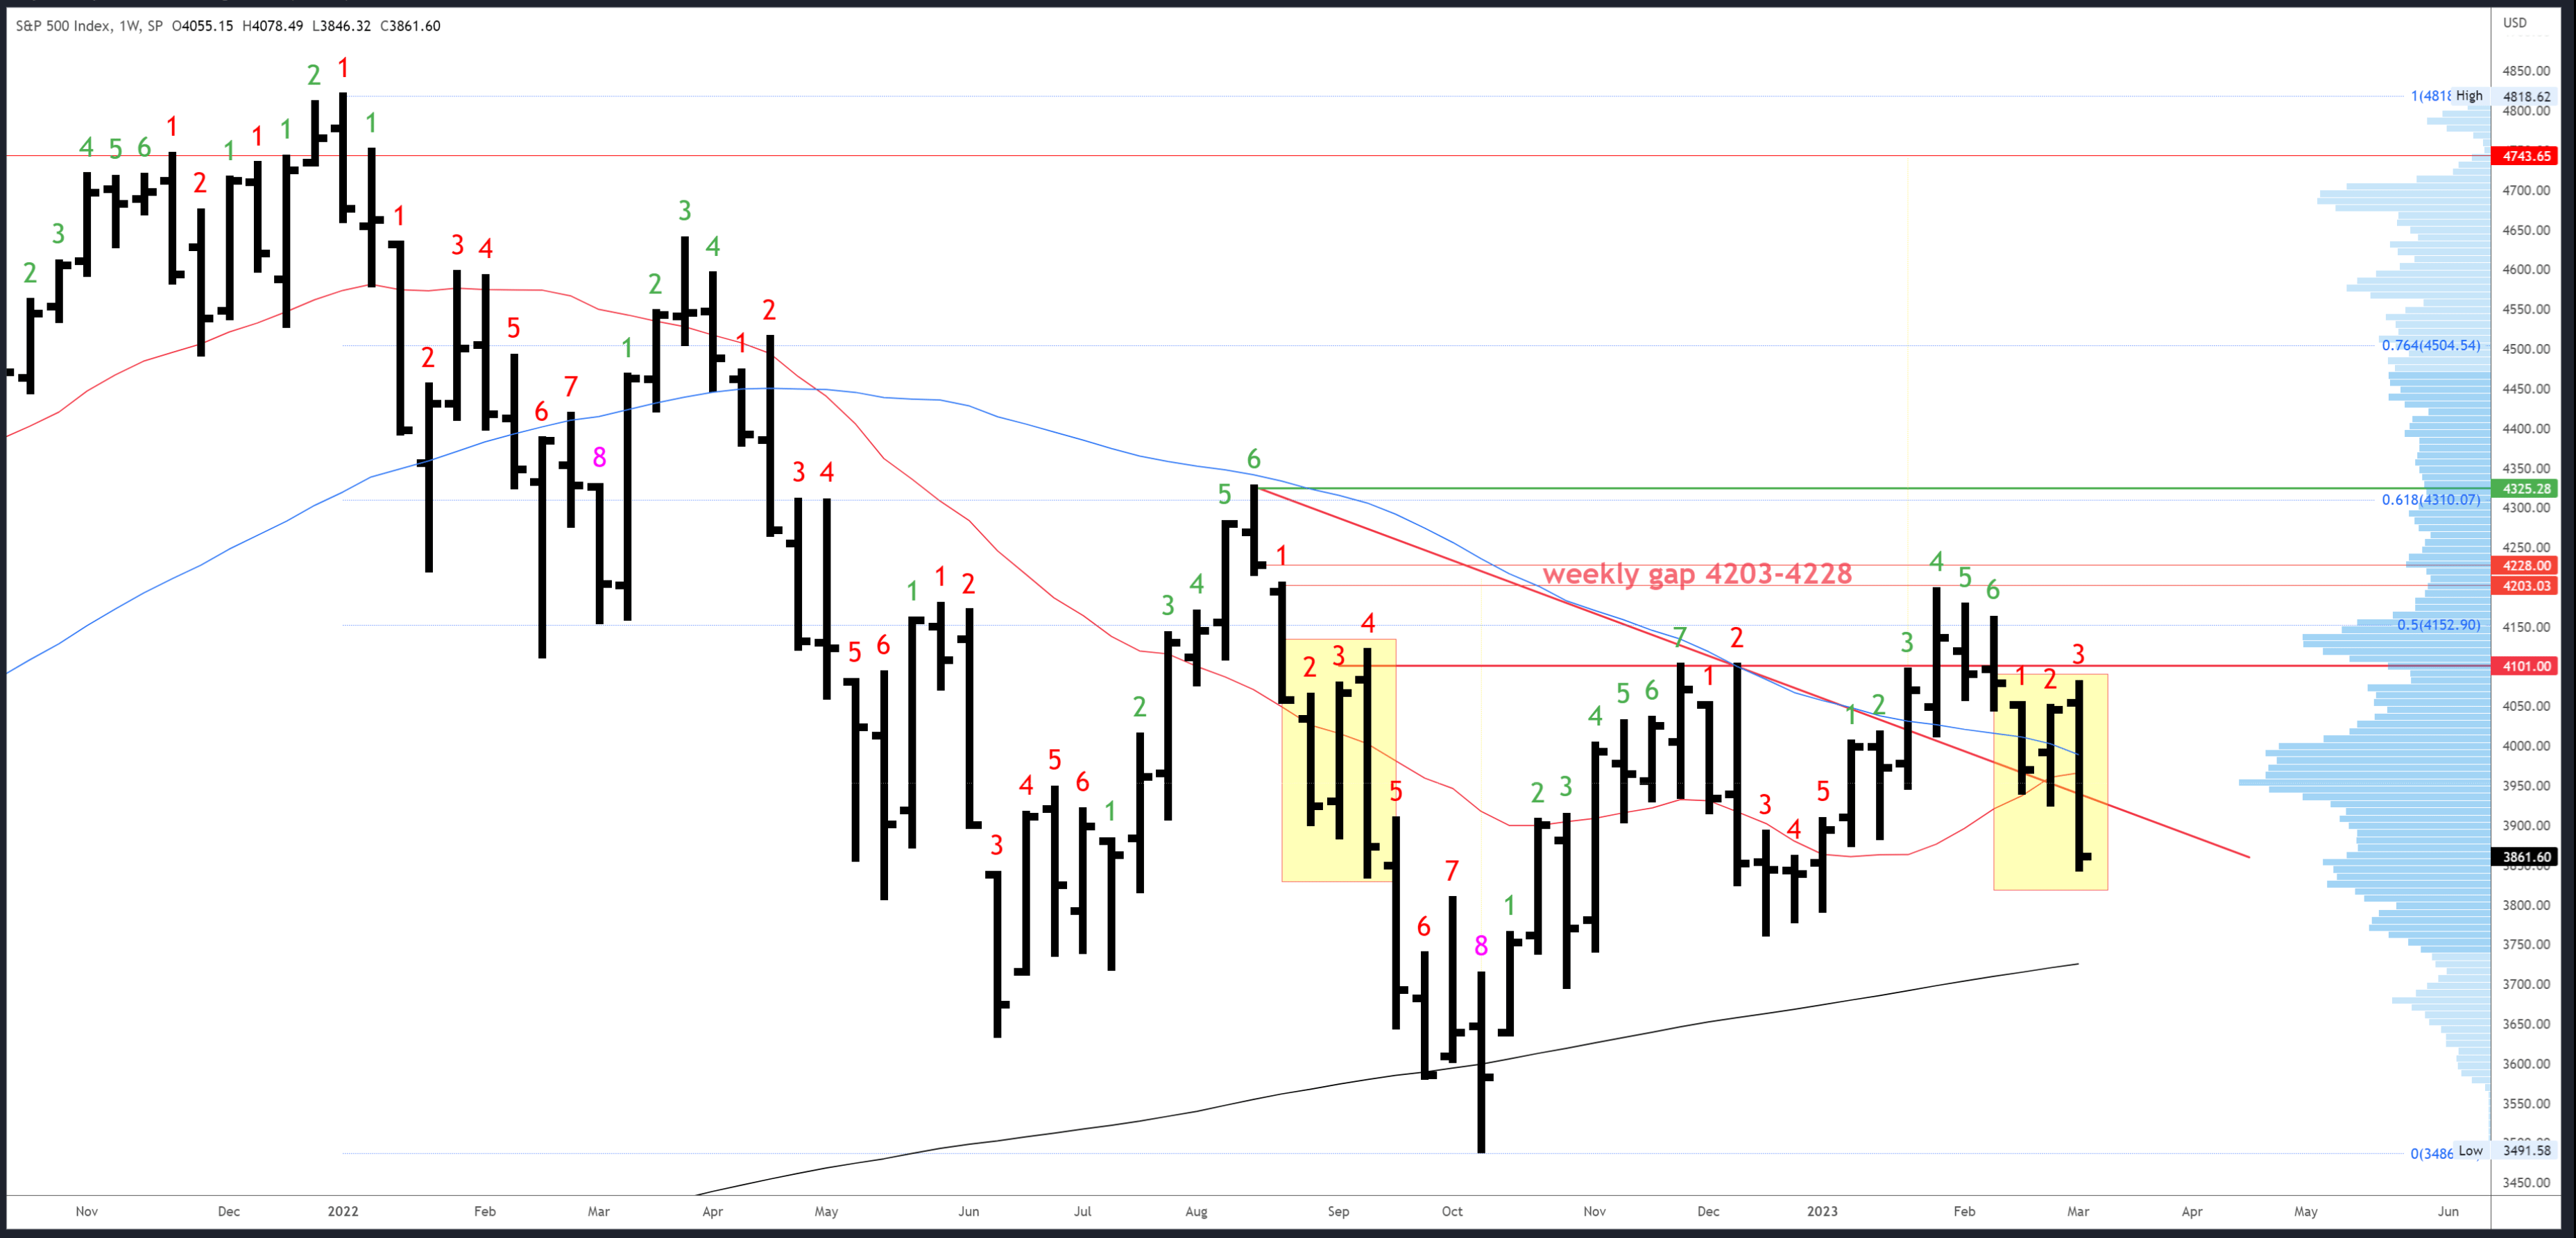
S&P 500 Weekly
Last week's strong close continued into new highs on Monday but higher prices were rejected at 4078 and declines continued throughout the week into a weak close at 3861, creating a 'bearish engulfing' bar. In the same way as last week's strong close suggested further highs on Monday, this week's weak close suggests further lows should be made early next week before any sustained reversal is attempted.
Seeking Alpha user 'Dukebailey' deserves a special shout out for his timely comment under last weekend's article. He pointed out the similarities between the recent weekly pattern and the pattern made last August and early September (highlighted on the chart below). As this repeating pattern was identified on Tuesday, there was still plenty of the weekly move still to come. It was an amazing call, and all readers' comments and observations are very welcome.
If the similarities continue, there should be more downside to come...
Initial resistance is now at last week's 3928 low. The 20MA and 50 MA converging (and due to cross in the coming weeks) around 3970 could also provide resistance, but have been cut through enough in recent times to be considered minor. 4078-4101 is the next major resistance.
All good supports in this area have been broken and the weekly lows from 3764-3794 are the next targets, with the 200MA at 3730 just below, then the 3638 weekly gap.
The upside exhaustion count failed (which itself is a bearish sign) and a downside count will be on bar 4 (of a possible 9) next week.
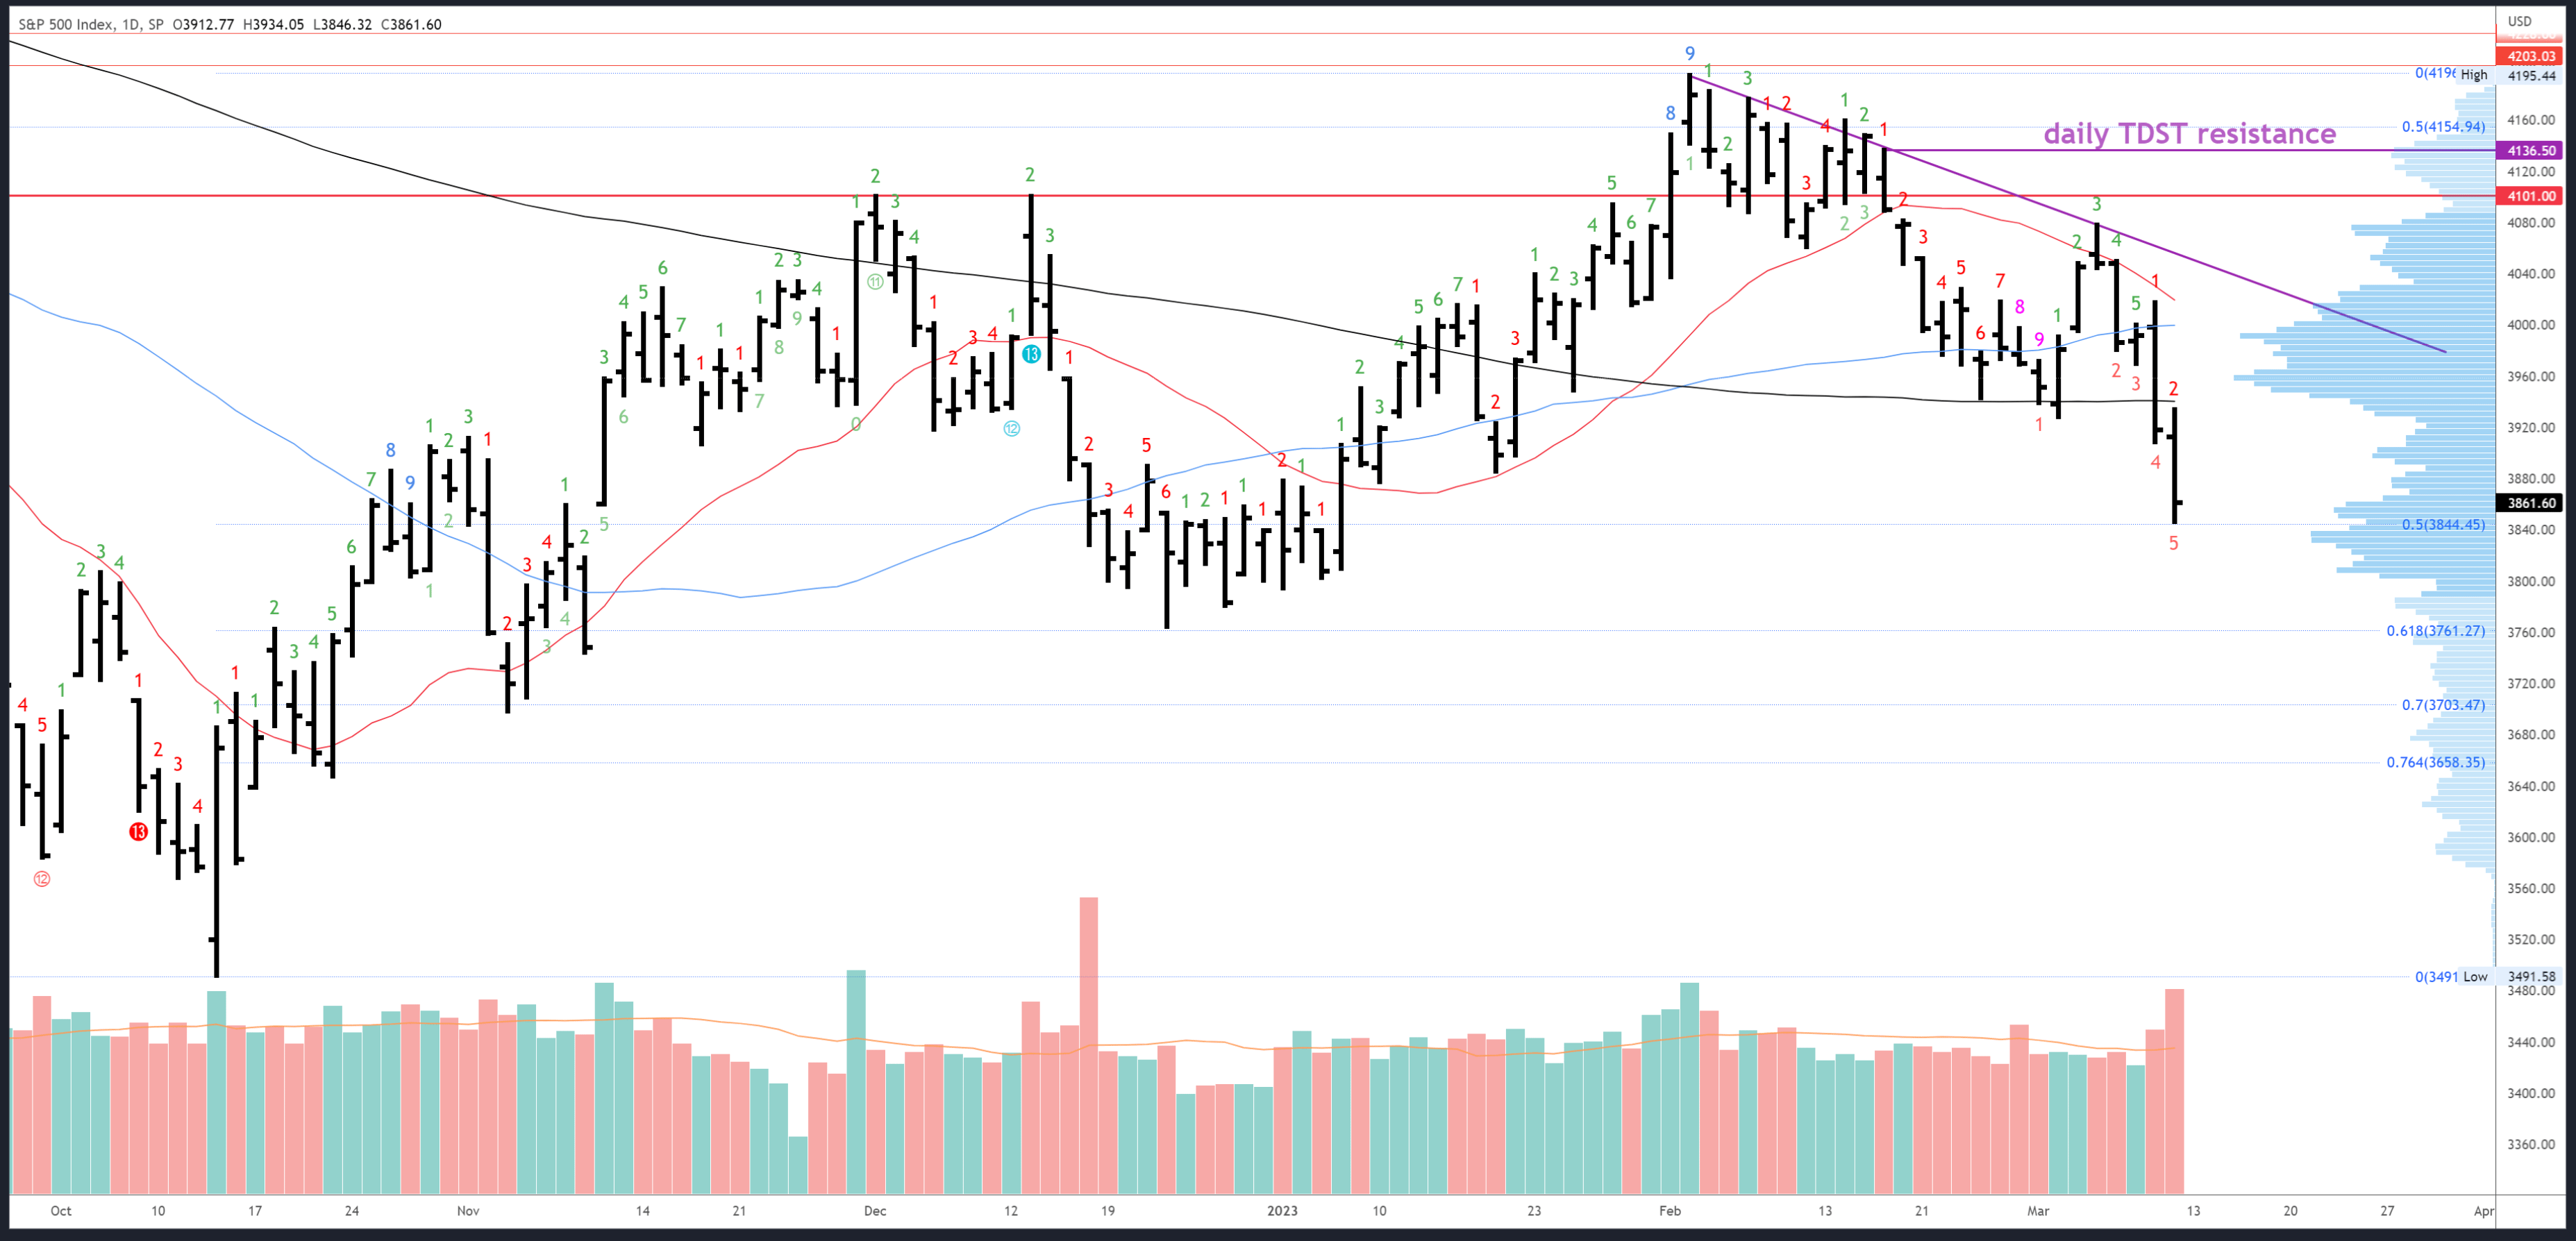
S&P 500 Daily
A heavy volume break of the 3940-50 cluster of support clearly puts the bears in control. Failure to hold the trendline re-test is yet another bullish failure and the conclusion has to be that prices are likely going lower. Friday's 3846 low came close to the 50% retrace of the October-February rally at 3844, but there is little other support in the area. 3764 is a likely monthly/weekly support target and lines up with the 61.8% Fib retrace at 3761.
Resistance is at 3928-40 at last week's low and the 200dma. A close above there could bring another short squeeze and the next major daily resistance is at the new trendline around 4040.
Supports have been broken and we should prepare for a break of 3761-3764, especially if the weekly repeating pattern plays out. There are number of possible supports below, but I don't want to highlight too many minor levels all bunched together. Confluence levels are the most significant, and the 3647 daily pivot lines up with the weekly gap at 3638, the 76.4% Fib retrace and the monthly 50MA at 3670. 3638-70 is therefore the next best support area after 3761.
A new downside exhaustion count is underway and will be on bar 3 (of a possible 9) on Monday. No exhaustion signals are therefore possible next week, although there is a reaction possible on bar 8 if it registers on Friday.
Scenarios for Next Week
Bullish
Bulls will look for positive developments on Silicon Valley Bank over the weekend. While new lows under 3846 look likely, a reversal back inside last week's range could be constructive. Soft CPI on Tuesday could then lead to a close back over 3940 and the 200dma, which in turn should lead to 4040ish and a test of the trendline.
Bearish
Bears are in control and must defend 3940 to maintain it. While the SVB panic could spread, it shouldn't get too serious as to sway the Fed's hawkish stance. Better off, Tuesday's CPI seals the deal on a 50bps hike in March and then more problems spring up subsequently. 3761-3764 is the initial target, with a weak close in this area opening the door to 3638-70.
Conclusion
It's taken a little over a month for the narrative to swing bearish again and technicals reflect the shift. The S&P500 trendline break-out has failed, supports have broken and price is below all major moving averages on the daily chart. Bears are in control and have clear downside objectives. Meanwhile, bulls hopes hinge on a soft CPI and a re-take of the 200dma.
For further details see:
S&P 500: Bear Targets - Week Starting March 13th (Technical Analysis)