ACTV - S&P 500: Higher In A Crisis - Week Starting March 27th (Technical Analysis)
2023-03-26 09:46:19 ET
Summary
- The Fed hiked in the middle of a banking crisis and the S&P500 closed the week higher.
- What this could mean for the week ahead.
- Key technical levels and probable outcomes for the S&P500.
The S&P 500 ( SPY ) reversed lower at trendline resistance on Wednesday, but could not follow through to the downside and closed higher for the week. As pointed out in last weekend's article, it's hardly the price action associated with a crisis. Have bears fumbled again?
In an attempt to answer that, a variety of technical analysis techniques will be used to look at probable moves for the S&P 500 in the week ahead. The S&P 500 chart will be analyzed on monthly, weekly, and daily timeframes, then the information collated into an actionable summary at the end with both bear and bull scenarios guided by inflection points.
The Market Narrative
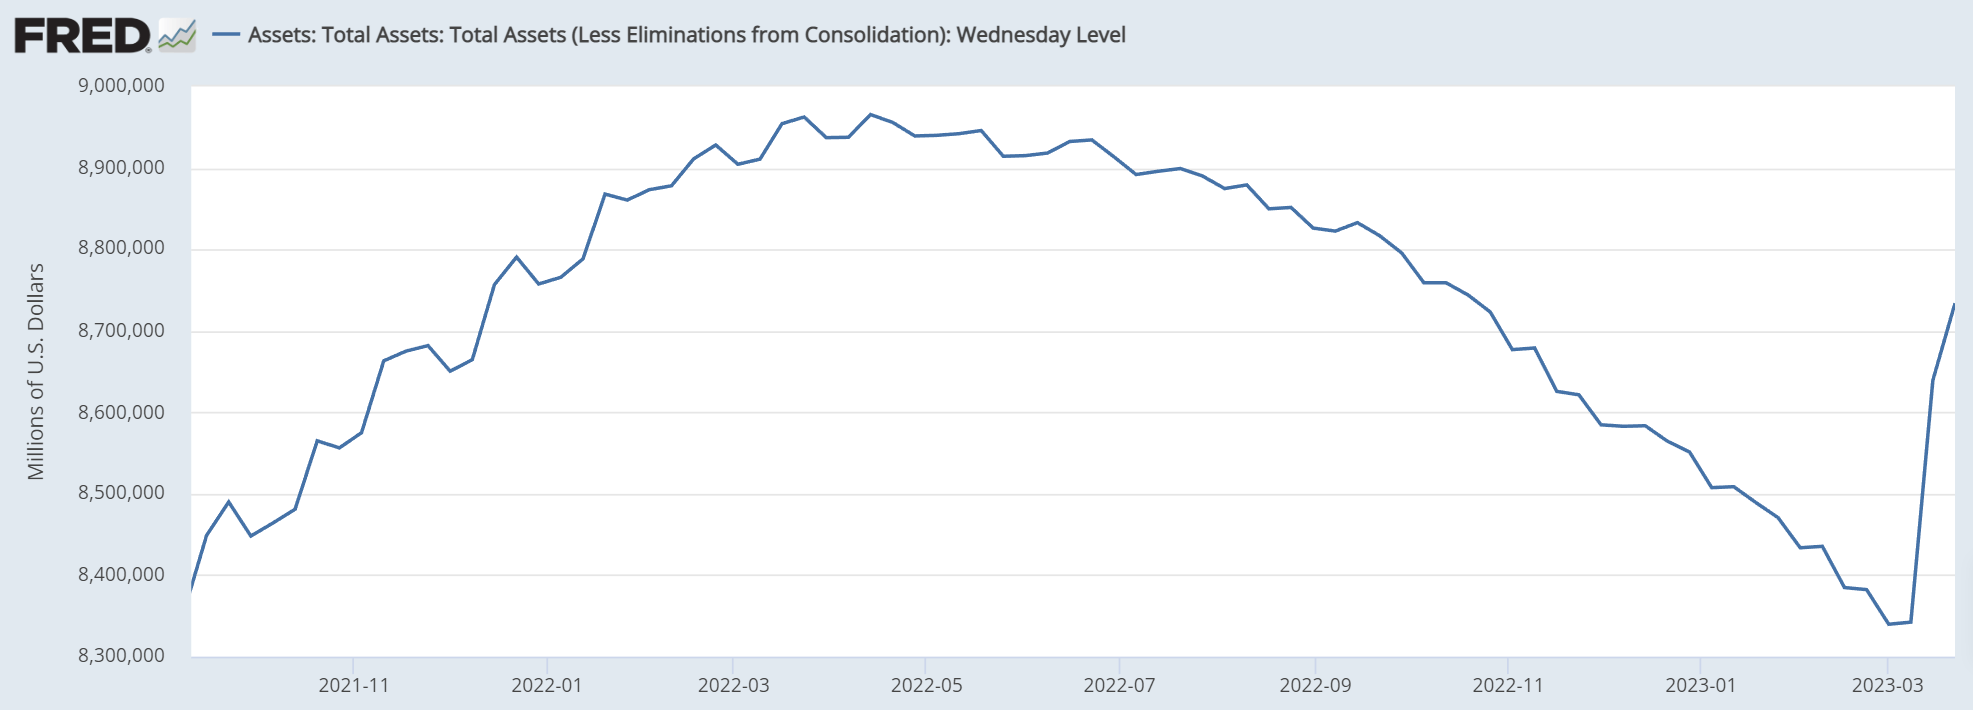
Markets seemed to like this week's dovish hike, and the continued liquidity injection.
Chair Powell told us, "The U.S. banking system is sound and resilient," and the 25bps hike backed up this view. Accompanying comments were re-assuringly dovish as he acknowledged a pause was considered and the banking crisis could weigh on inflation and effectively replace rate hikes.
This week's events may have put the 'higher for longer' rate path to rest, but there is still a marked divergence between what the market expects (up to 100bps of cuts this year) and what the Fed is telling us ("Fed officials just don’t see rate cuts this year”). Moreover, the Fed seems to be hoping for a goldilocks banking crisis which stays contained and replaces the need for further hikes. Too optimistic? Differing expectations are a recipe for volatility later this year.
S&P 500 Monthly
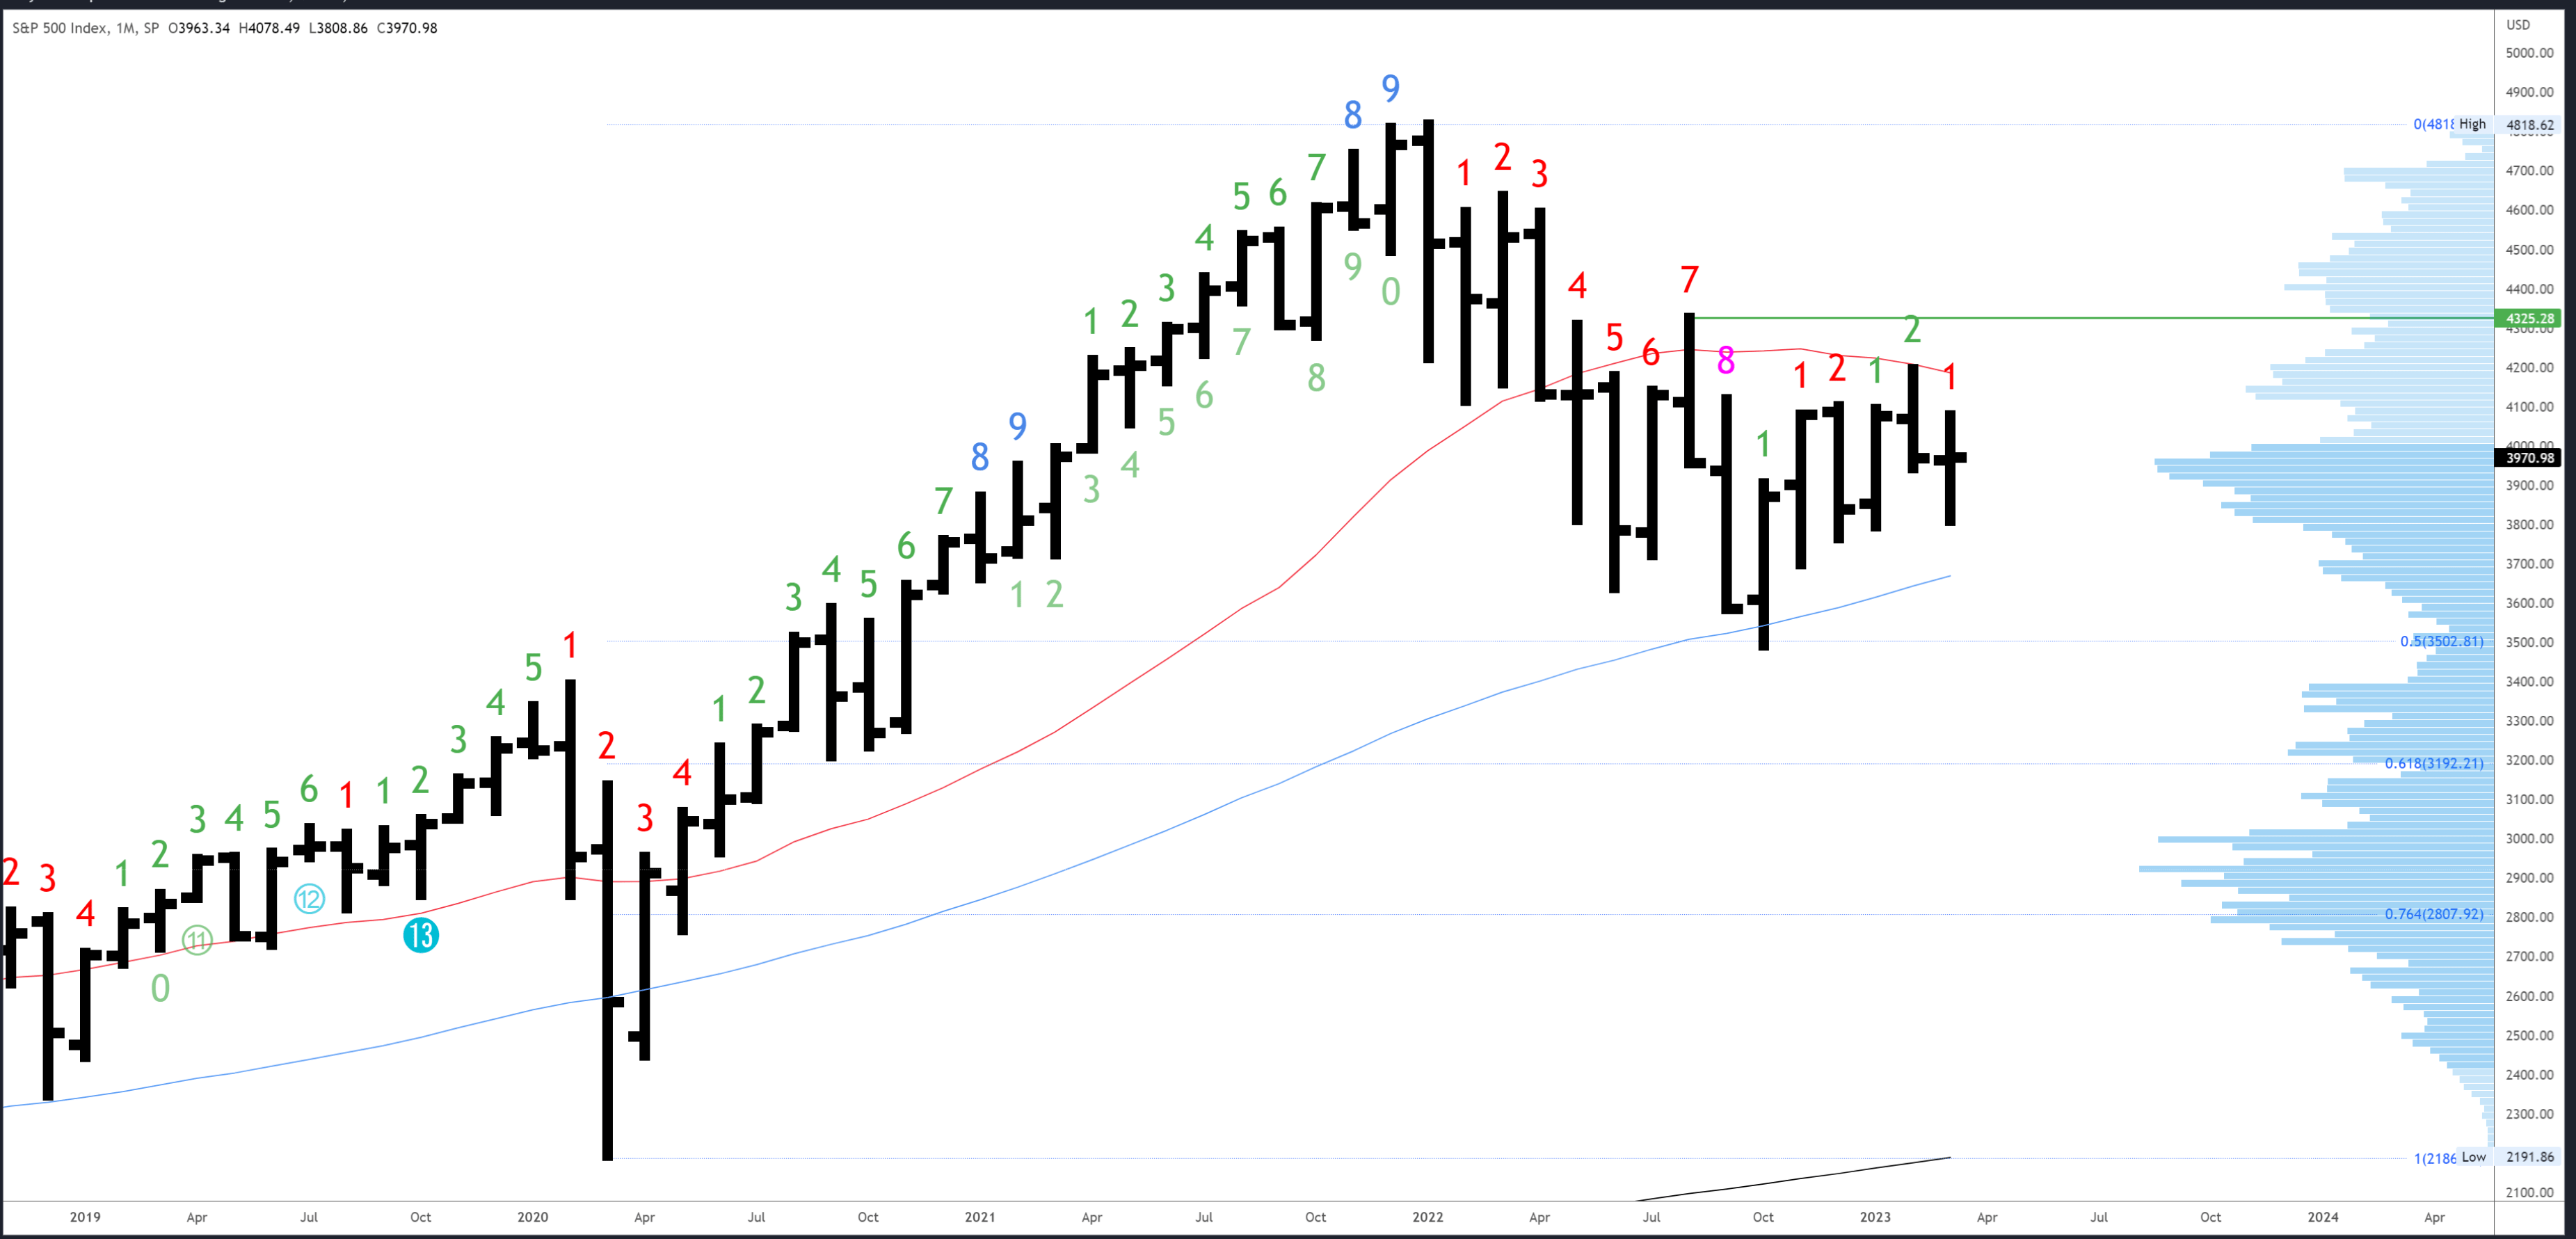
At Friday's close of 3971, the S&P500 is trading slightly higher for the month. Considering the banking crisis came to light during the second week of March, this is a sign of strength.
The March bar, the Q1 bar and next week's bar will all close this coming Friday and the closing level could be important going forward.
Monthly levels don't really change until a new bar opens so the support/resistance is the same as last week -
3963 is minor resistance, as is the March high (so far), 4078. The 4195 high and the 20MA (now slightly lower at 4189) remain the first monthly major resistance levels, followed by 4325 at the high of August.
Support comes in at 3764-3794 at the December and January lows, with the 50MA at 3670.
There are no exhaustion signals in either direction (using Demark methods), although downside exhaustion was very nearly registered in October, so we can say this is being reset with the move from that low.
S&P 500 Weekly
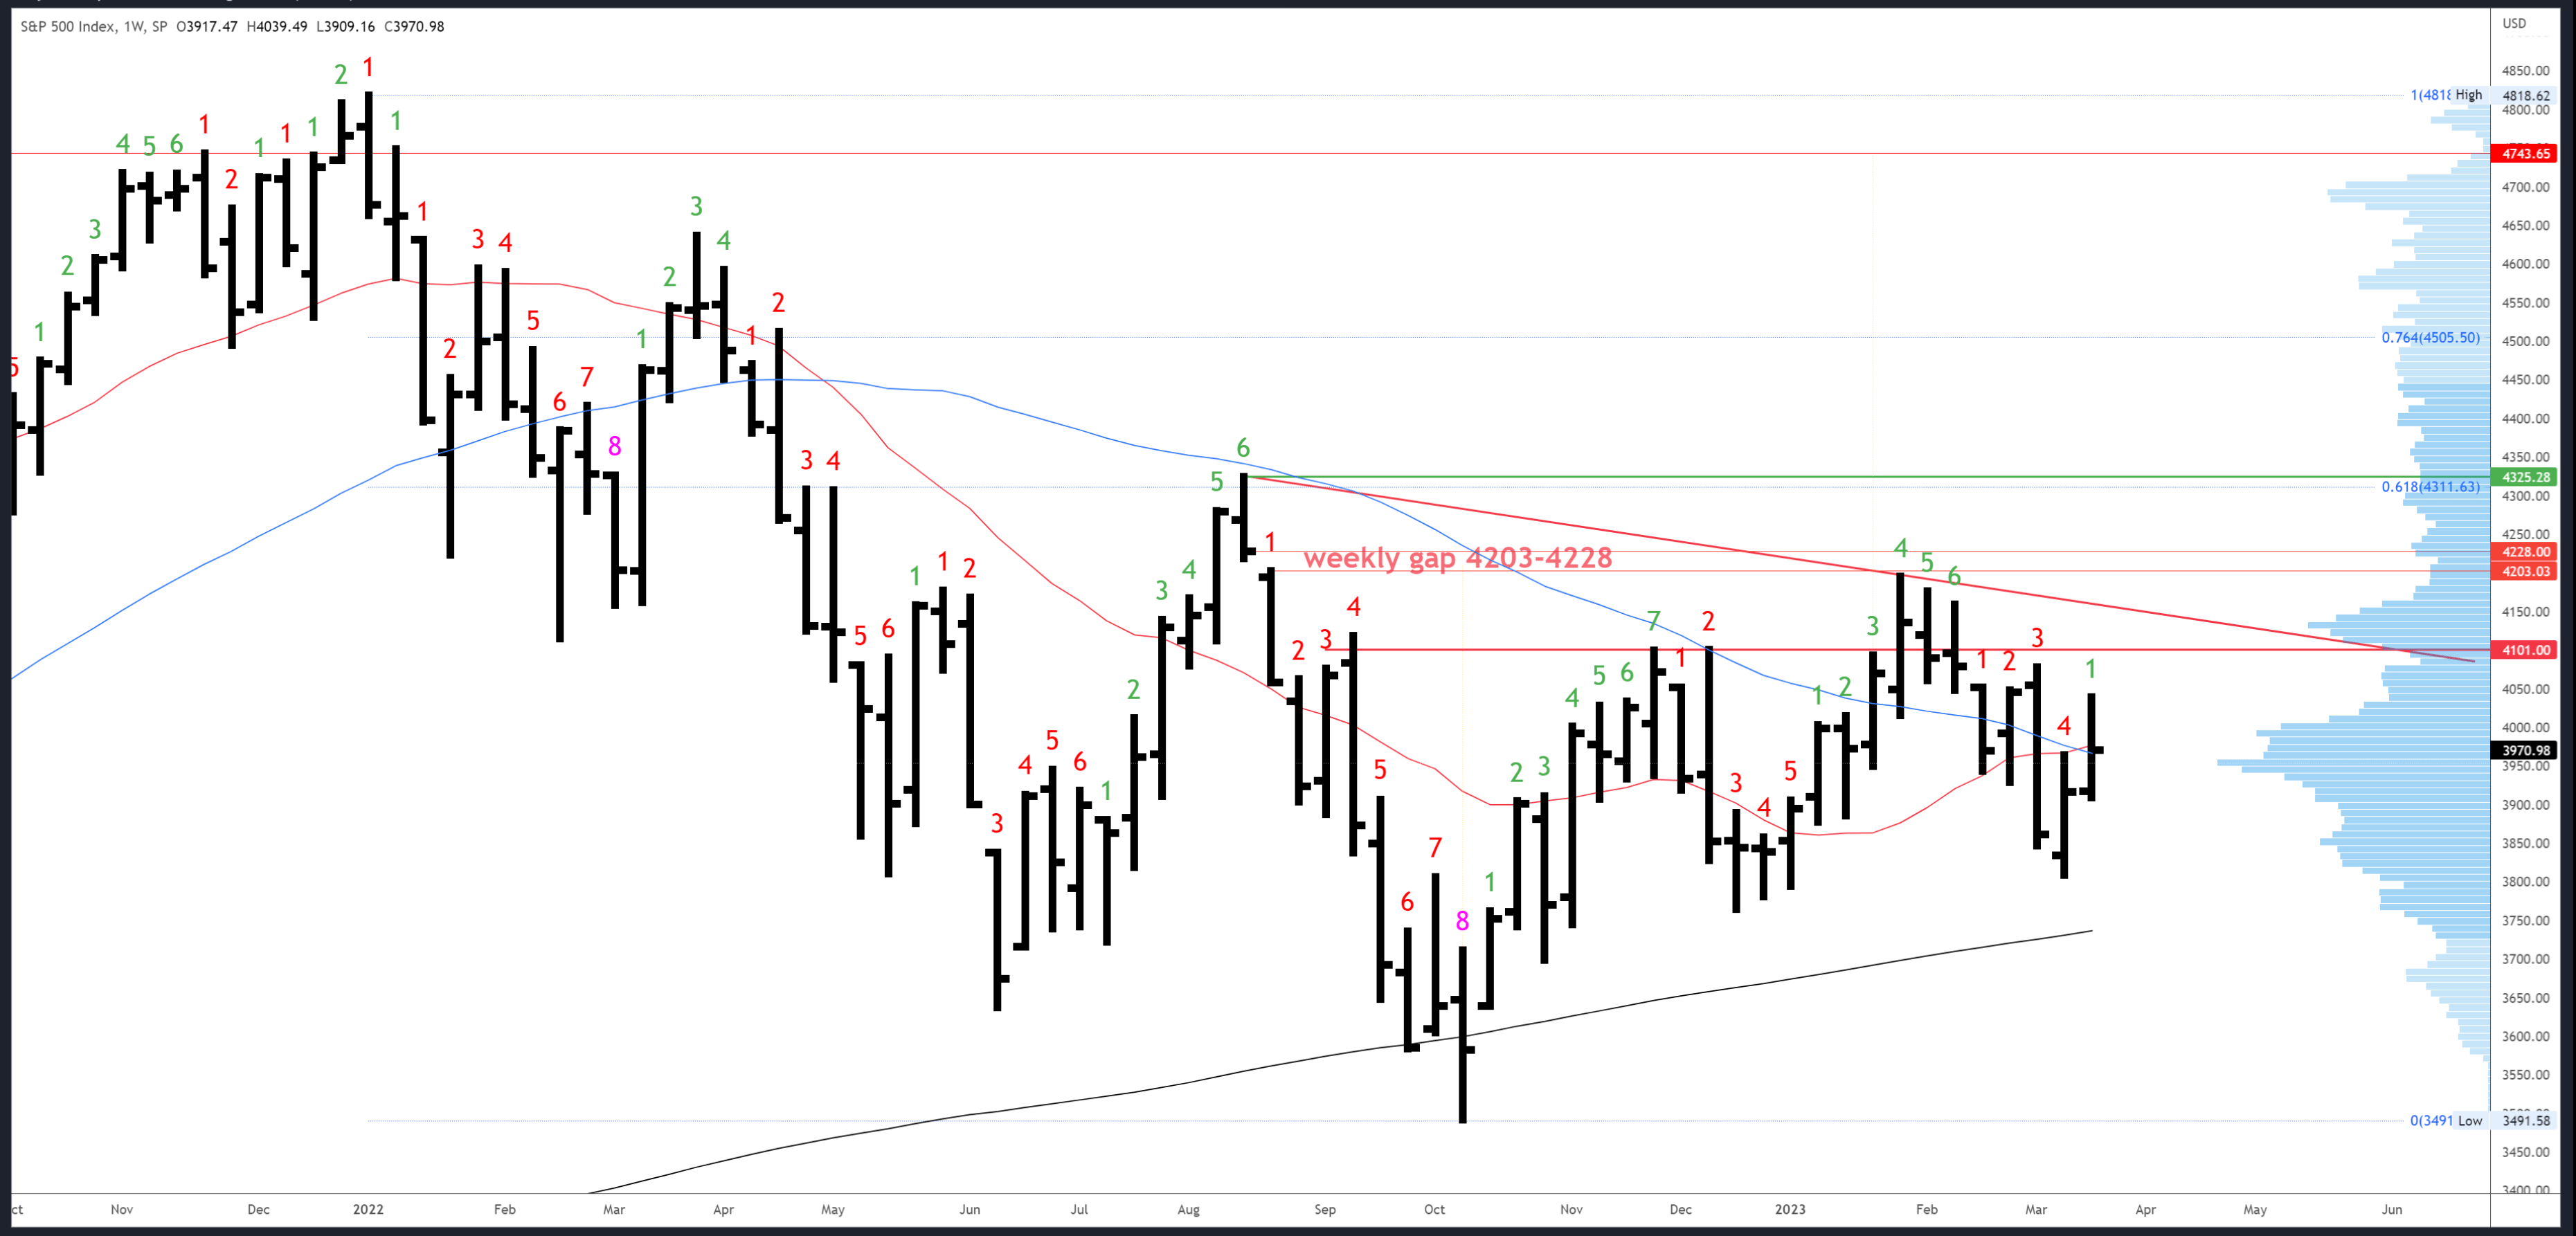
This week's bar showed some follow through on the previous week's reversal and closed just above last week's 3964 high. However, it remained within the large weekly decline starting 6th March, and until it closes above 4078, the weekly view is neutral.
Initial resistance is at this week's 4039 high. 4078-4101 is the next major resistance.
3808 low is the first weekly support, with 3764 below and the 200MA now rising to 3740.
The downside (Demark) exhaustion count was reset this week and there are no exhaustion signals in either direction.
S&P 500 Daily
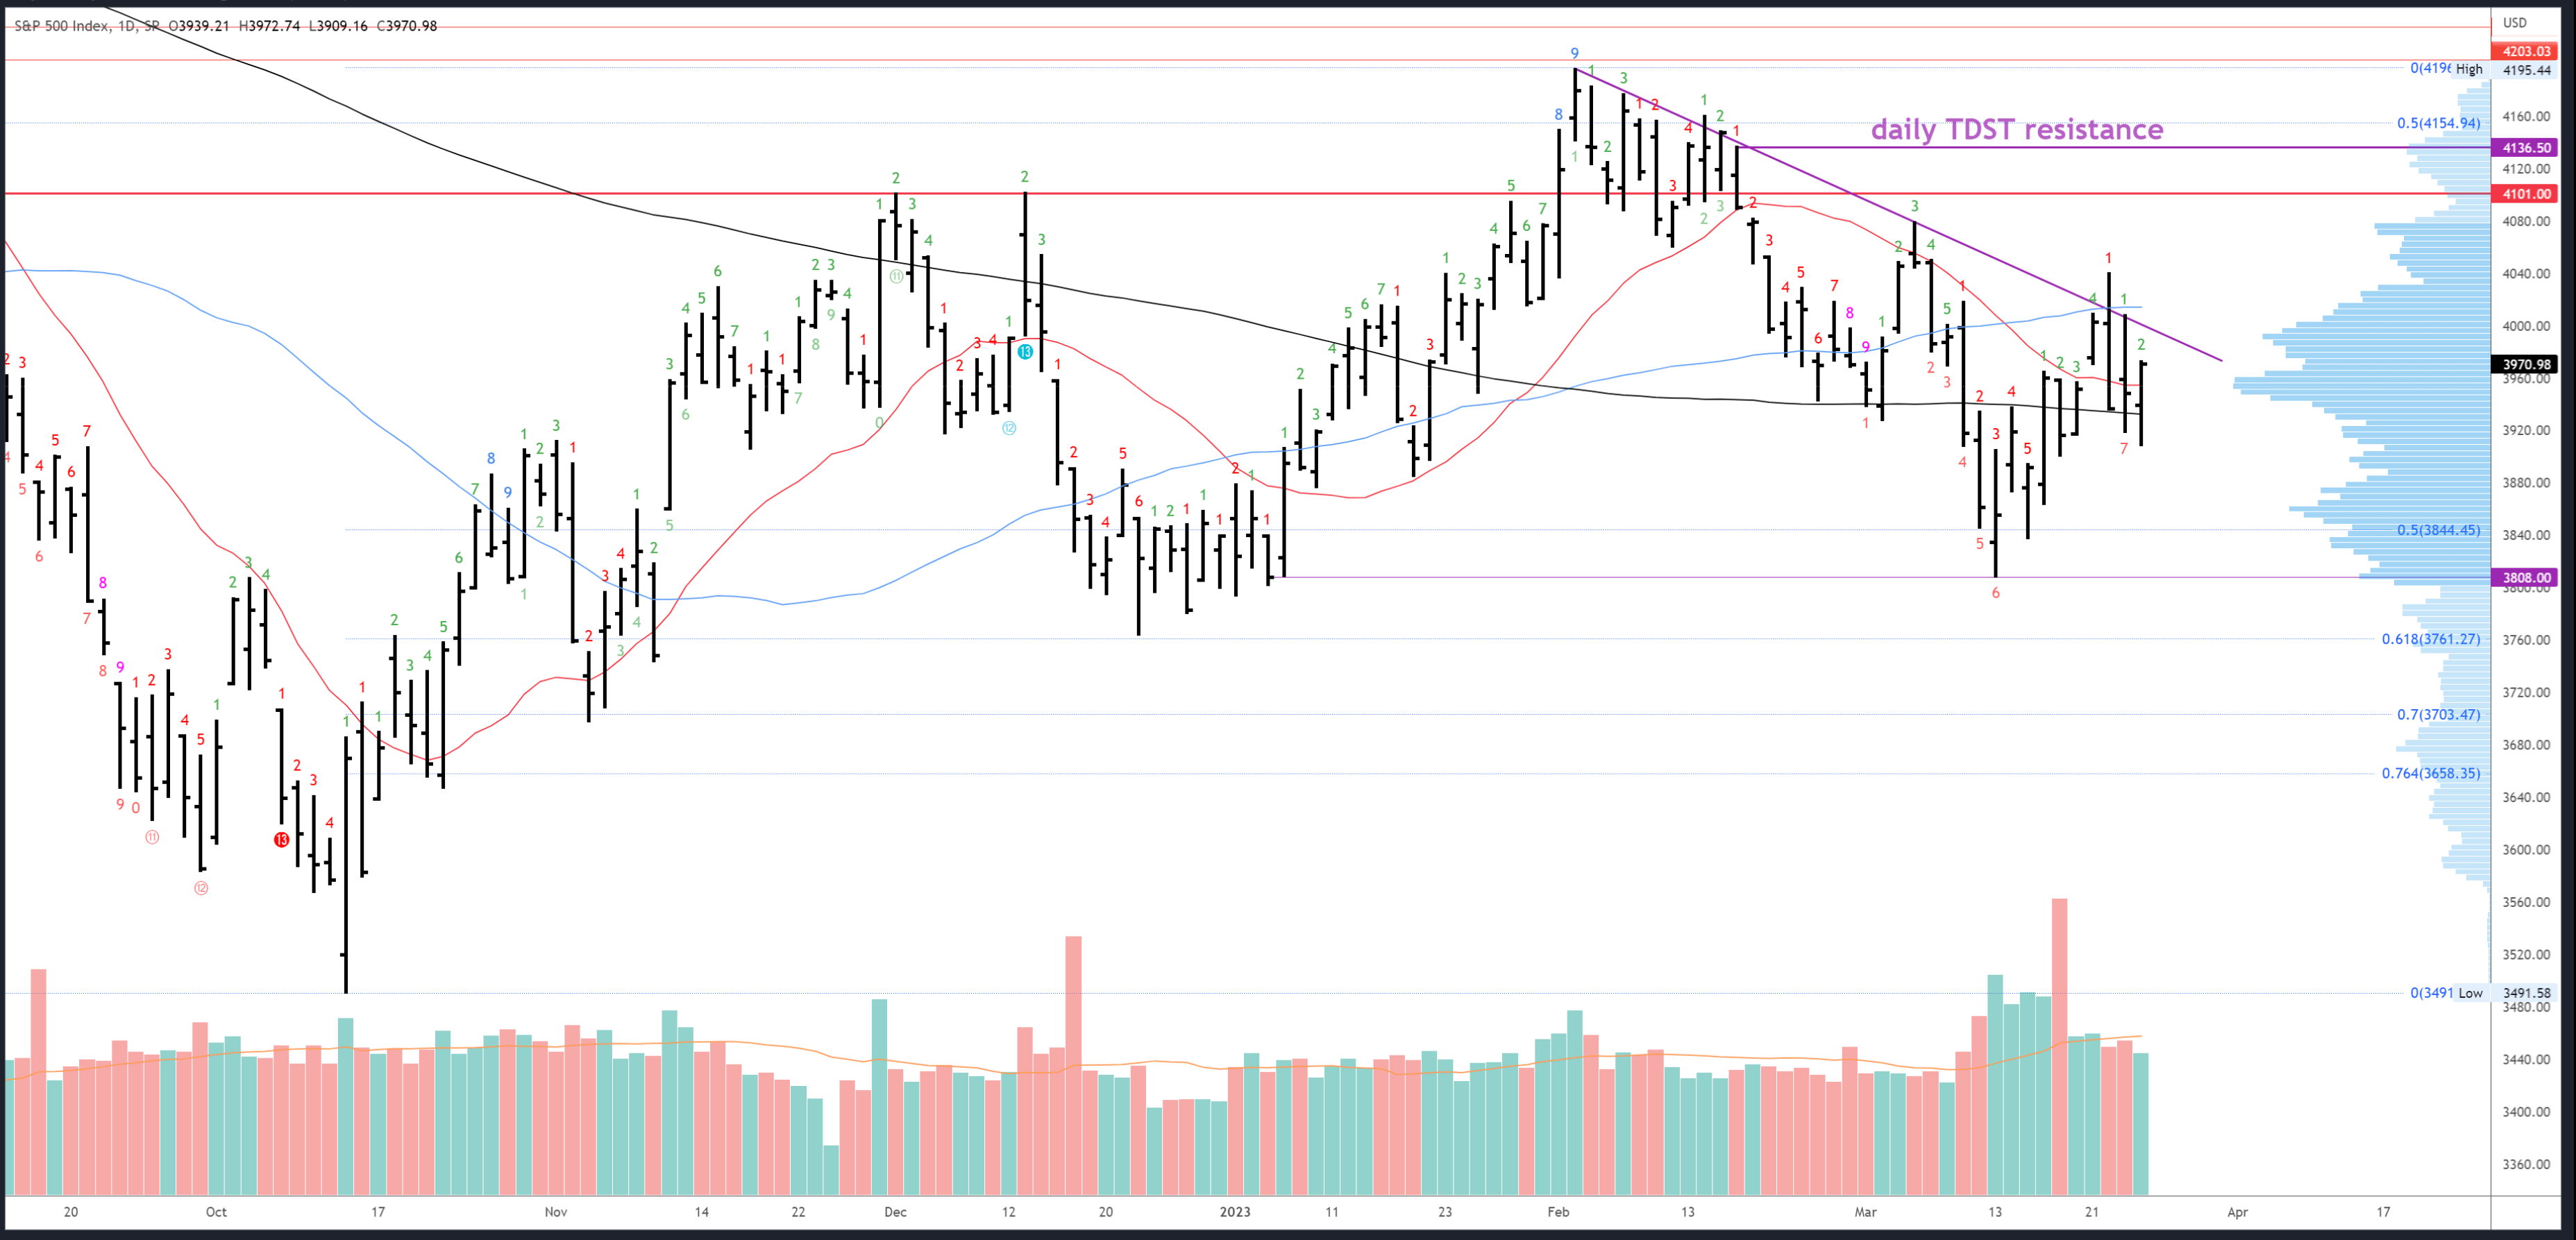
Friday's session made a strong close so more upside can be expected early next week above Friday's 3972 high. However, should that rally fail and close back below Friday's close of 3971, it would signal rejection and likely lead to a test of 3909 before another attempt to rally.
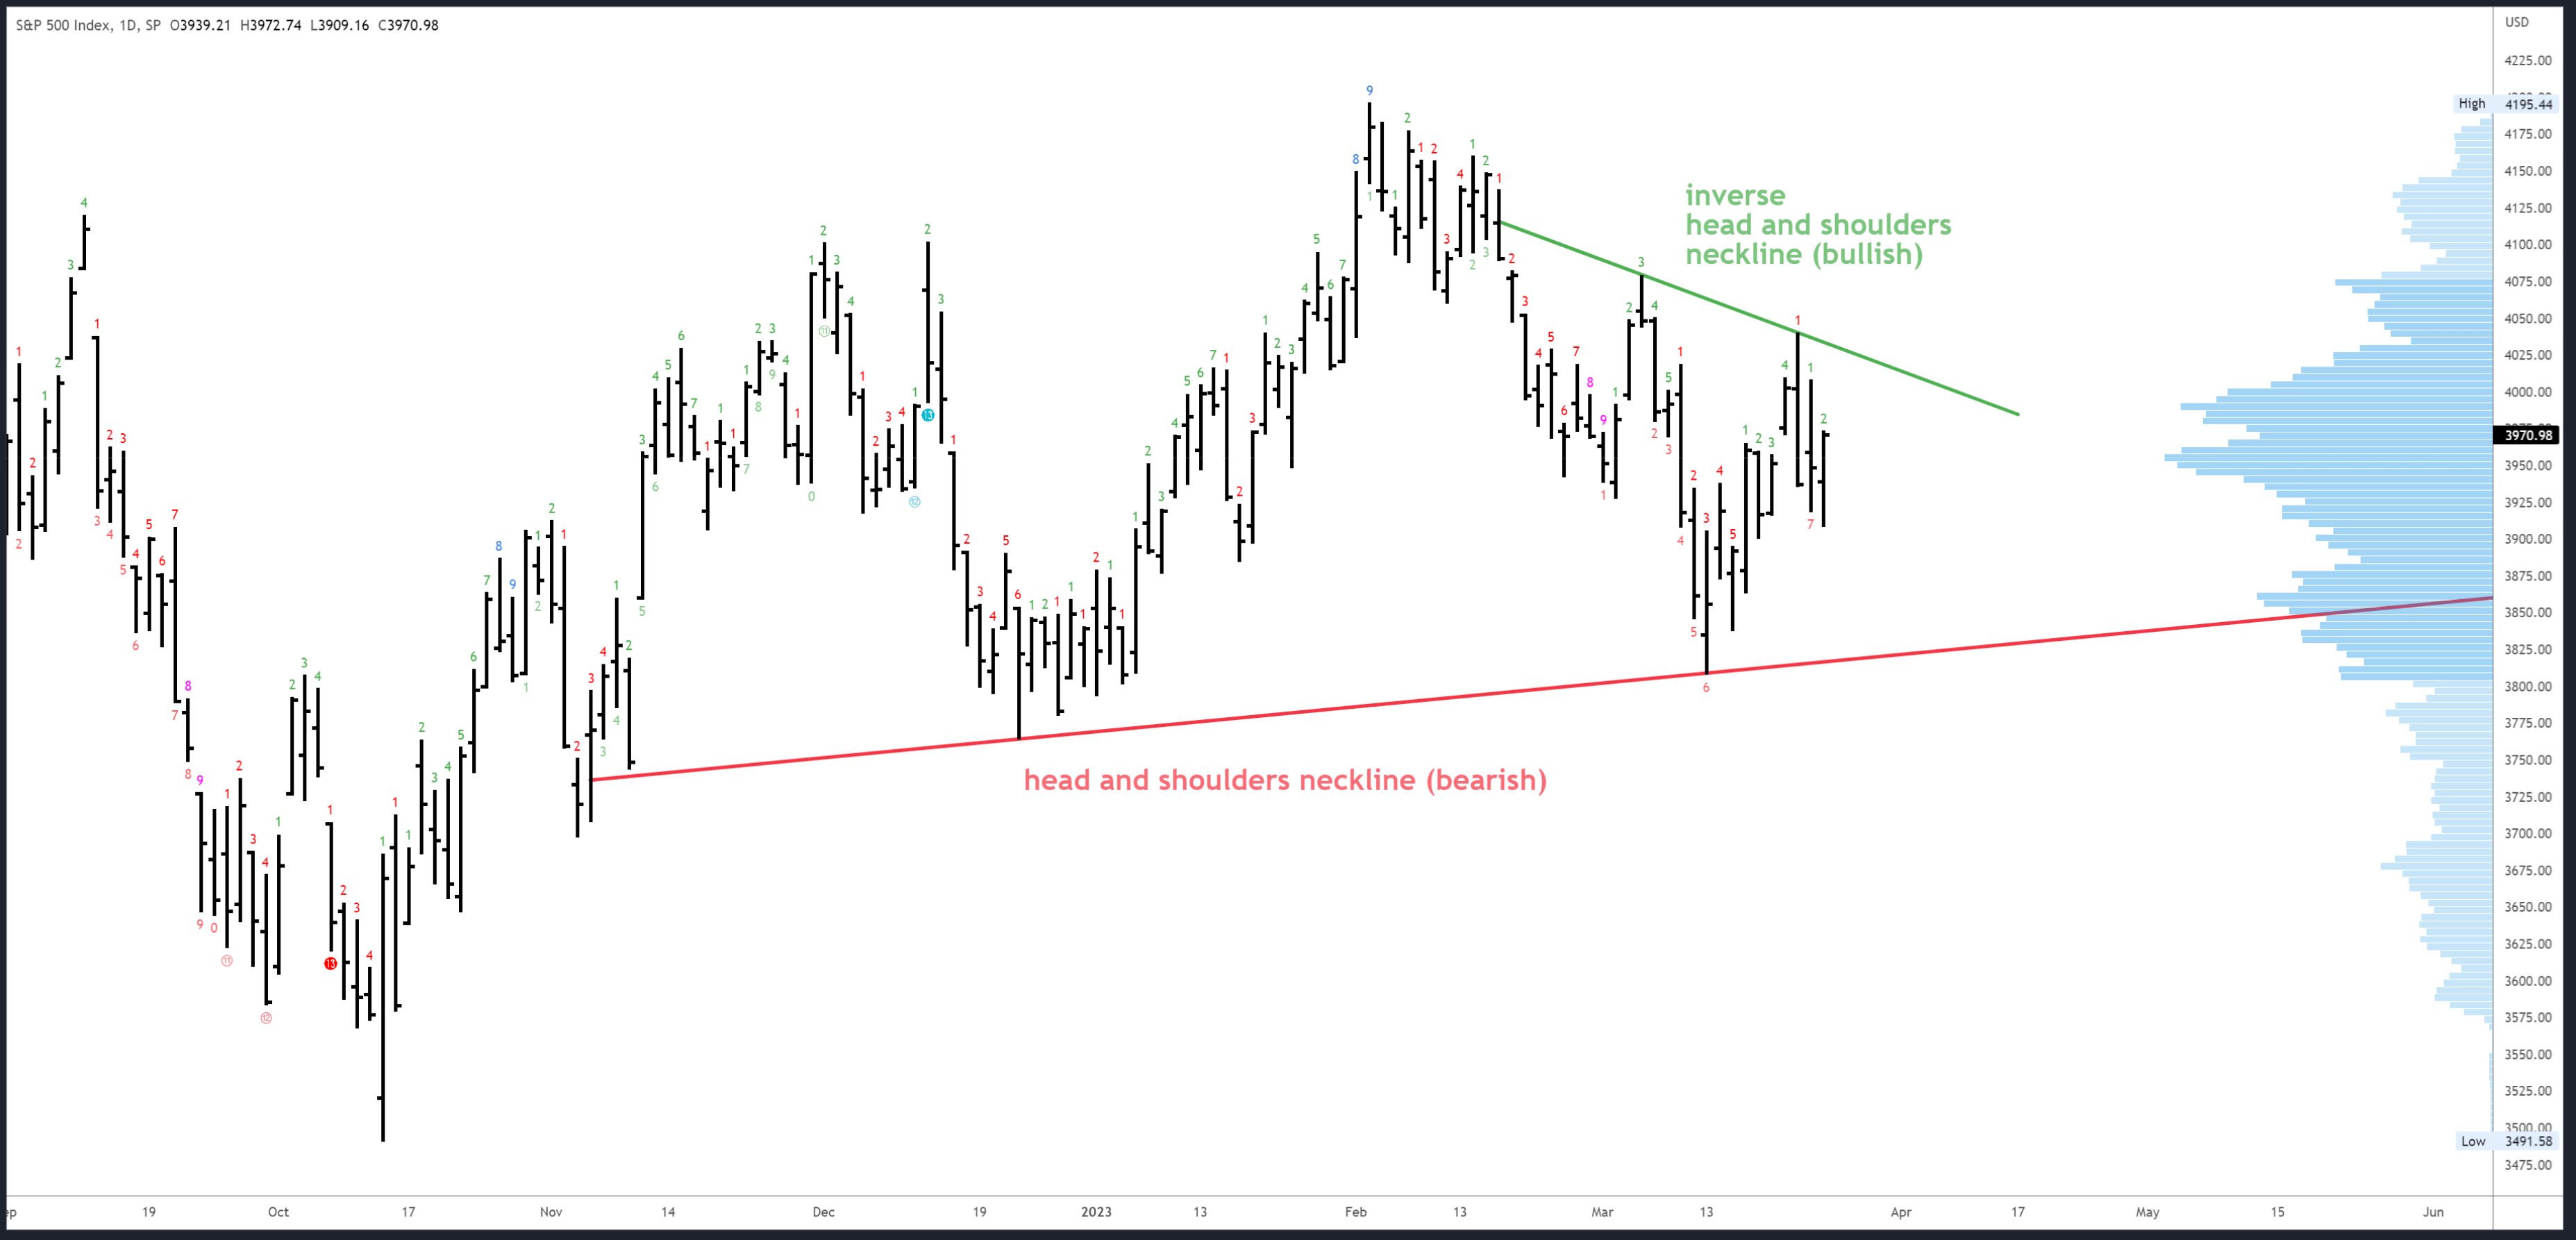
The daily trendline and the 50dma contained Wednesday's rally and held again during Thursday's bounce. It will decline to 3997 on Monday and 3992 on Tuesday, but is best re-drawn against last week's high as the neckline of an inverse head and shoulders pattern as illustrated in the second chart below.
Indecision and a lack of sustained trend on the daily chart is illustrated by the chop around the 200dma and has created several opposing patterns. The bullish inverse head and shoulders pattern has the best chance of triggering next week with a close above the neckline at 4032. Be prepared, as this could resolve the indecision and has a target of around 4280 (although 4078-4101 is still initial resistance).
Initial support is 3909, then 3838-44 and 3808, although these levels are fairly minor. As I said last week, I don't want to list every potential support as too many references in a close range become a hinderance. Price action and context are often more important than levels in isolation.
No exhaustion signals are possible next week.
Scenarios for Next Week
Bullish
The S&P500 is holding up well during the crisis, and no doubt the Fed's liquidity injection (which reached $400bn last week) is helping. Financials ( XLF ) have been a drag but now look set to bounce, and should the S&P500 trigger the inverse head and shoulders pattern above 4032, it would open up 4078-4101 and possibly higher.
Bearish
Bears will look for early strength next week to fail above 3972 and lead to a push below 3909. A series of lower closes would really help the bear case and a weak close for March could set up a break of 3808 in April.
Conclusion
The conclusion this week is much like last week's: price action is neutral and there should be opportunities in both directions. 4032 is the main inflection point and should resolve the bull/bear uncertainty in the near-term.
For further details see:
S&P 500: Higher In A Crisis - Week Starting March 27th (Technical Analysis)