ACTV - S&P 500: What Price Action Says About The 'Crisis' - Week Starting March 20th (Technical Analysis)
2023-03-19 08:26:16 ET
Summary
- The Fed stepped in to ease the liquidity and banking crisis. The bearish bias has flipped back to neutral and opportunities lie in both directions.
- What to watch in the S&P 500 in the week ahead.
- Key technical levels and probable outcomes.
Despite significant news flow and volatility in correlated markets, the price action in the S&P 500 (SPY) this week was neutral. Lower prices were rejected on Monday, but the recovery struggled to re-take the 200dma. This indecision is fitting given the circumstances, but will it be resolved next week?
In an attempt to answer that, a variety of technical analysis techniques will be used to look at probable moves for the S&P 500 in the week ahead. The S&P 500 chart will be analyzed on monthly, weekly, and daily timeframes, then the information collated into an actionable summary at the end with both bear and bull scenarios guided by inflection points.
The Market Narrative
This week saw another big shift in the market narrative as inflation concerns took a back seat to the banking crisis. Liquidity problems emerged as deposits were shifted in search of safety, causing the Fed to step in with a new facility able to loan up to $2trn in ready cash. Its balance sheet expanded $300bn over the week, undoing almost half of the prior QT.
Clearly, the Fed's hawkish shift on the 7th March was badly timed once again. While they may still raise 25bps in next week's meeting, the 'higher for longer' narrative is dead in the water. Bull steepening of the yield curve means cuts are expected, and shrinking the balance sheet is clearly impossible during a liquidity crisis.
Equities - especially Tech stocks - like the situation, for now. However, forced rate cuts are far from ideal over the longer-term, and when a deeply inverted yield curve steepens, it's often too late to save the economy (or market).
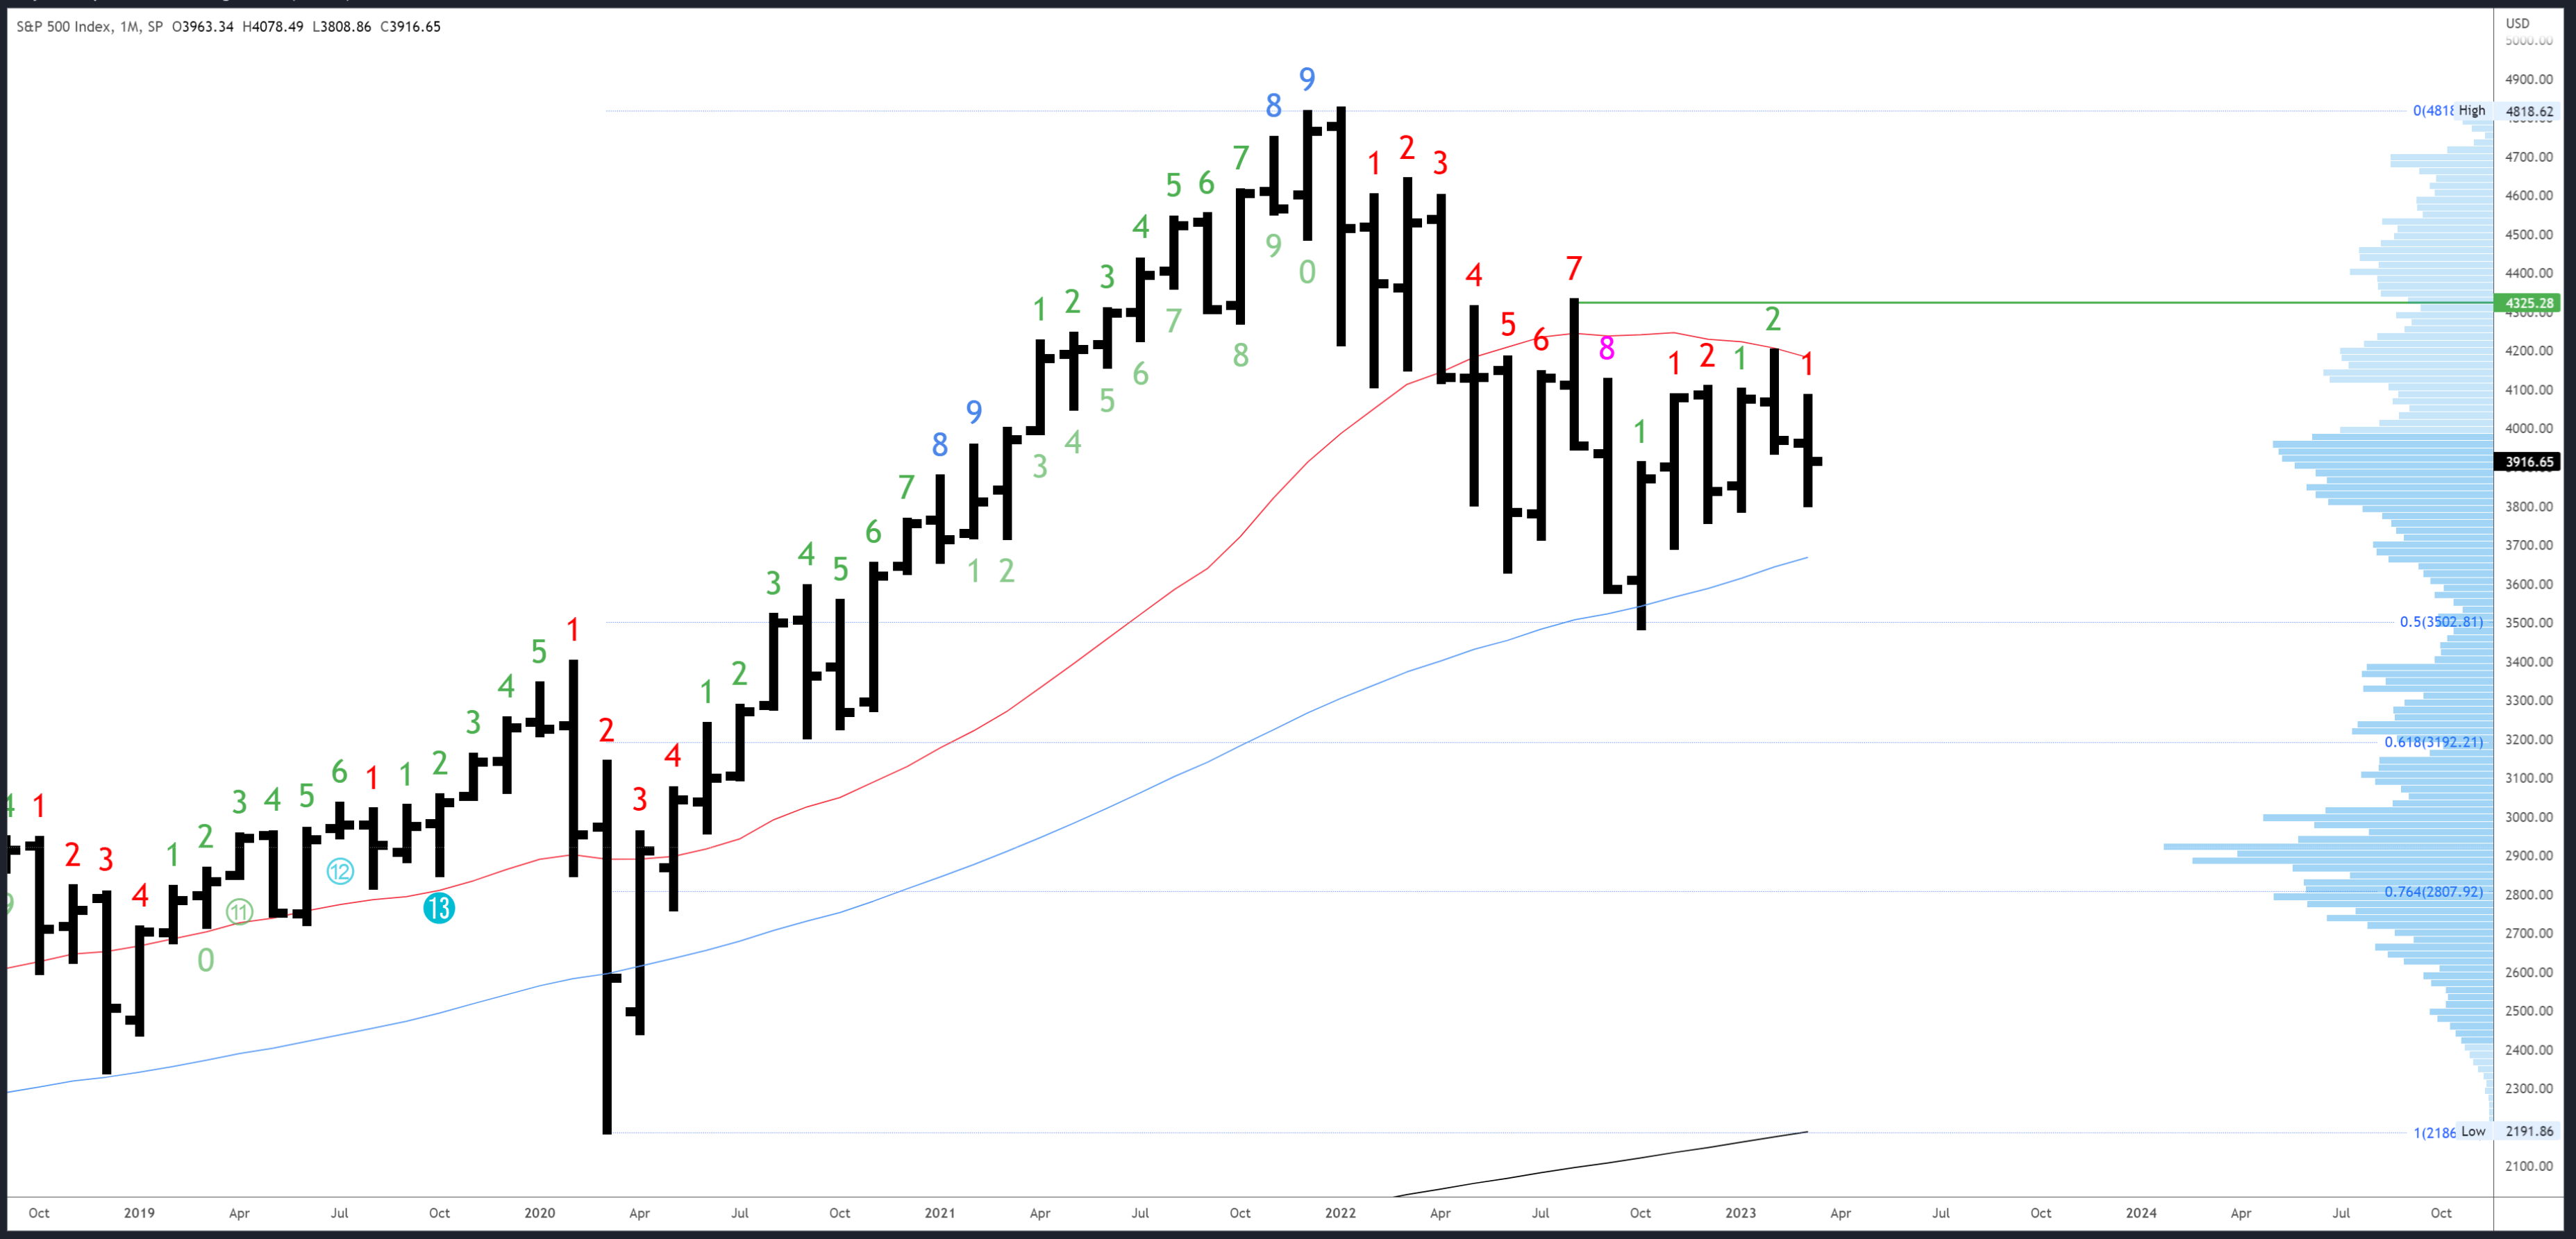
S&P 500 Monthly
The March bar made a new low to 3808 but then bounced back up to the March opening price of 3963. The high of the week came in just one point above at 3964.
3963 is minor resistance, as is the March high (so far), 4078. The 4195 high and the 20MA (now slightly lower at 4189) remain the first monthly major resistance levels, followed by 4325 at the high of August.
Support comes in at 3764-3794 at the December and January lows, with the 50MA at 3670.
There are no exhaustion signals in either direction (using Demark methods), although downside exhaustion was very nearly registered in October, so we can say this is being reset with the move from that low.
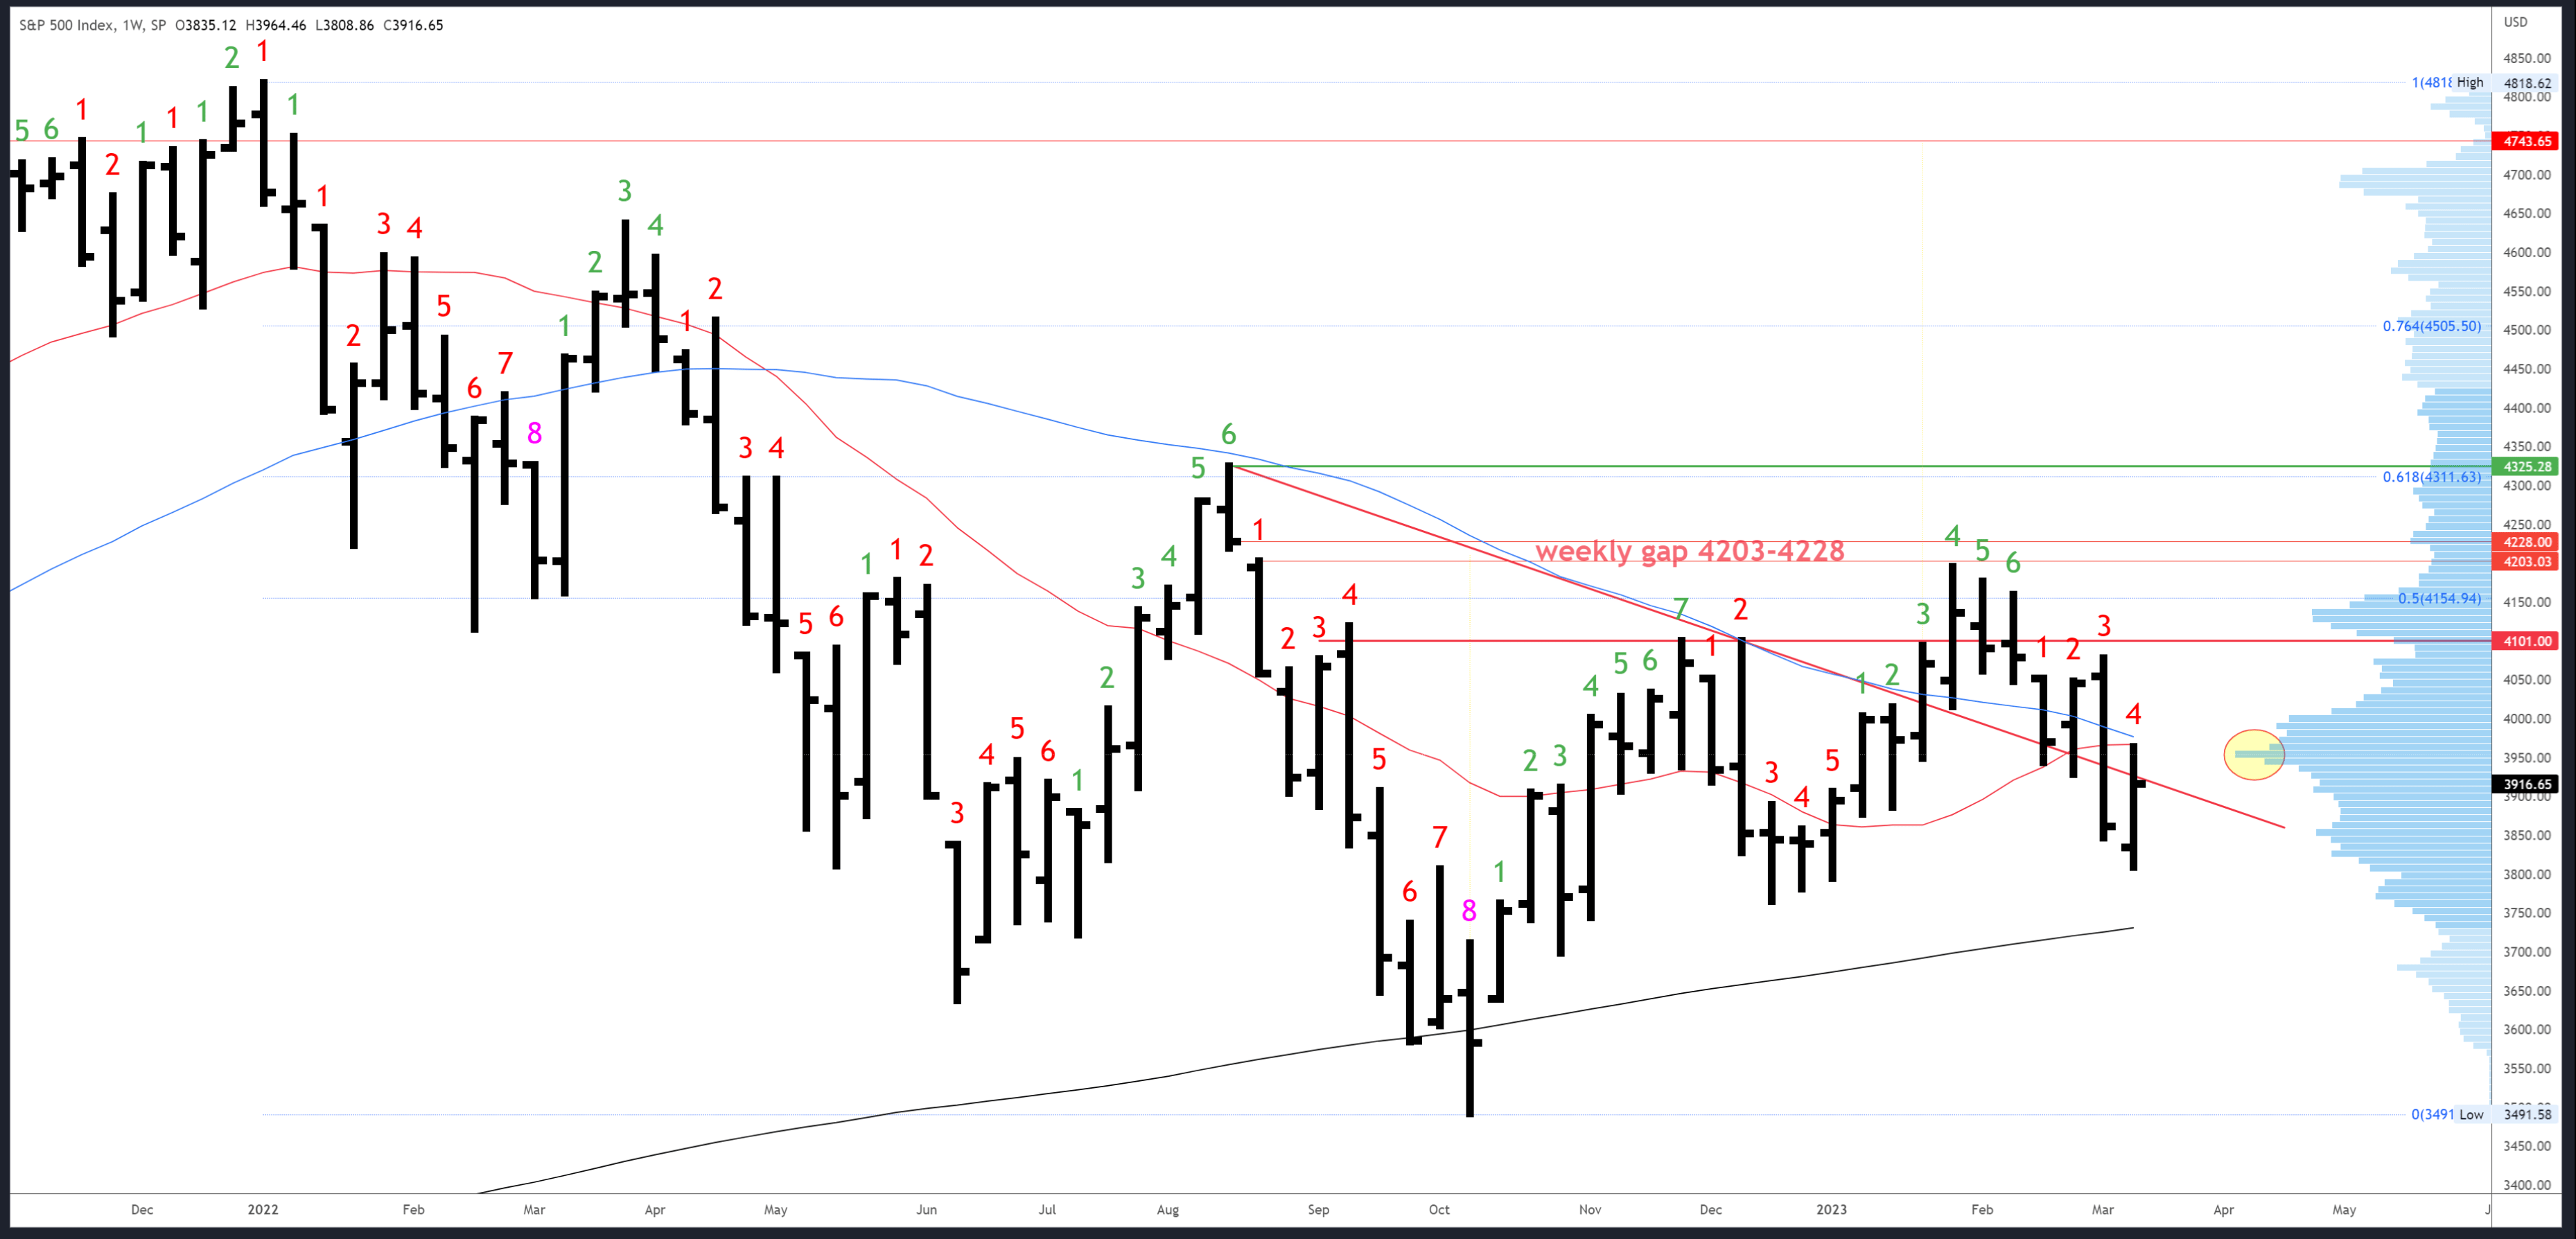
S&P 500 Weekly
Once again, the concept of continuation following a weak/strong close played out this week with a new low to 3808. The logic behind this is simple - if a bar closes near the low/high, we can assume it would have continued in the same direction if the clock hadn't been stopped. Once the action starts again, it usually carries on where it left off.
This week's bar had a neutral close and although there was a reversal off 3808, it only reclaimed around 50% of the previous large weekly drop. Resistance at the 20MA/50MA at 3966-70 held and we can see the high volume node at the right of the chart (highlighted) was tested again at the highs.
Initial resistance is now at this week's 3964 high and the 20MA and 50MA are due to across around this price. 4078-4101 is the next major resistance.
The 3808 low was close to monthly/weekly supports at 3764-3794. This remains support, with the 200MA at 3735 just below, then the 3638 weekly gap.
A downside (Demark) exhaustion count will be on bar 5 (of a possible 9) next week.
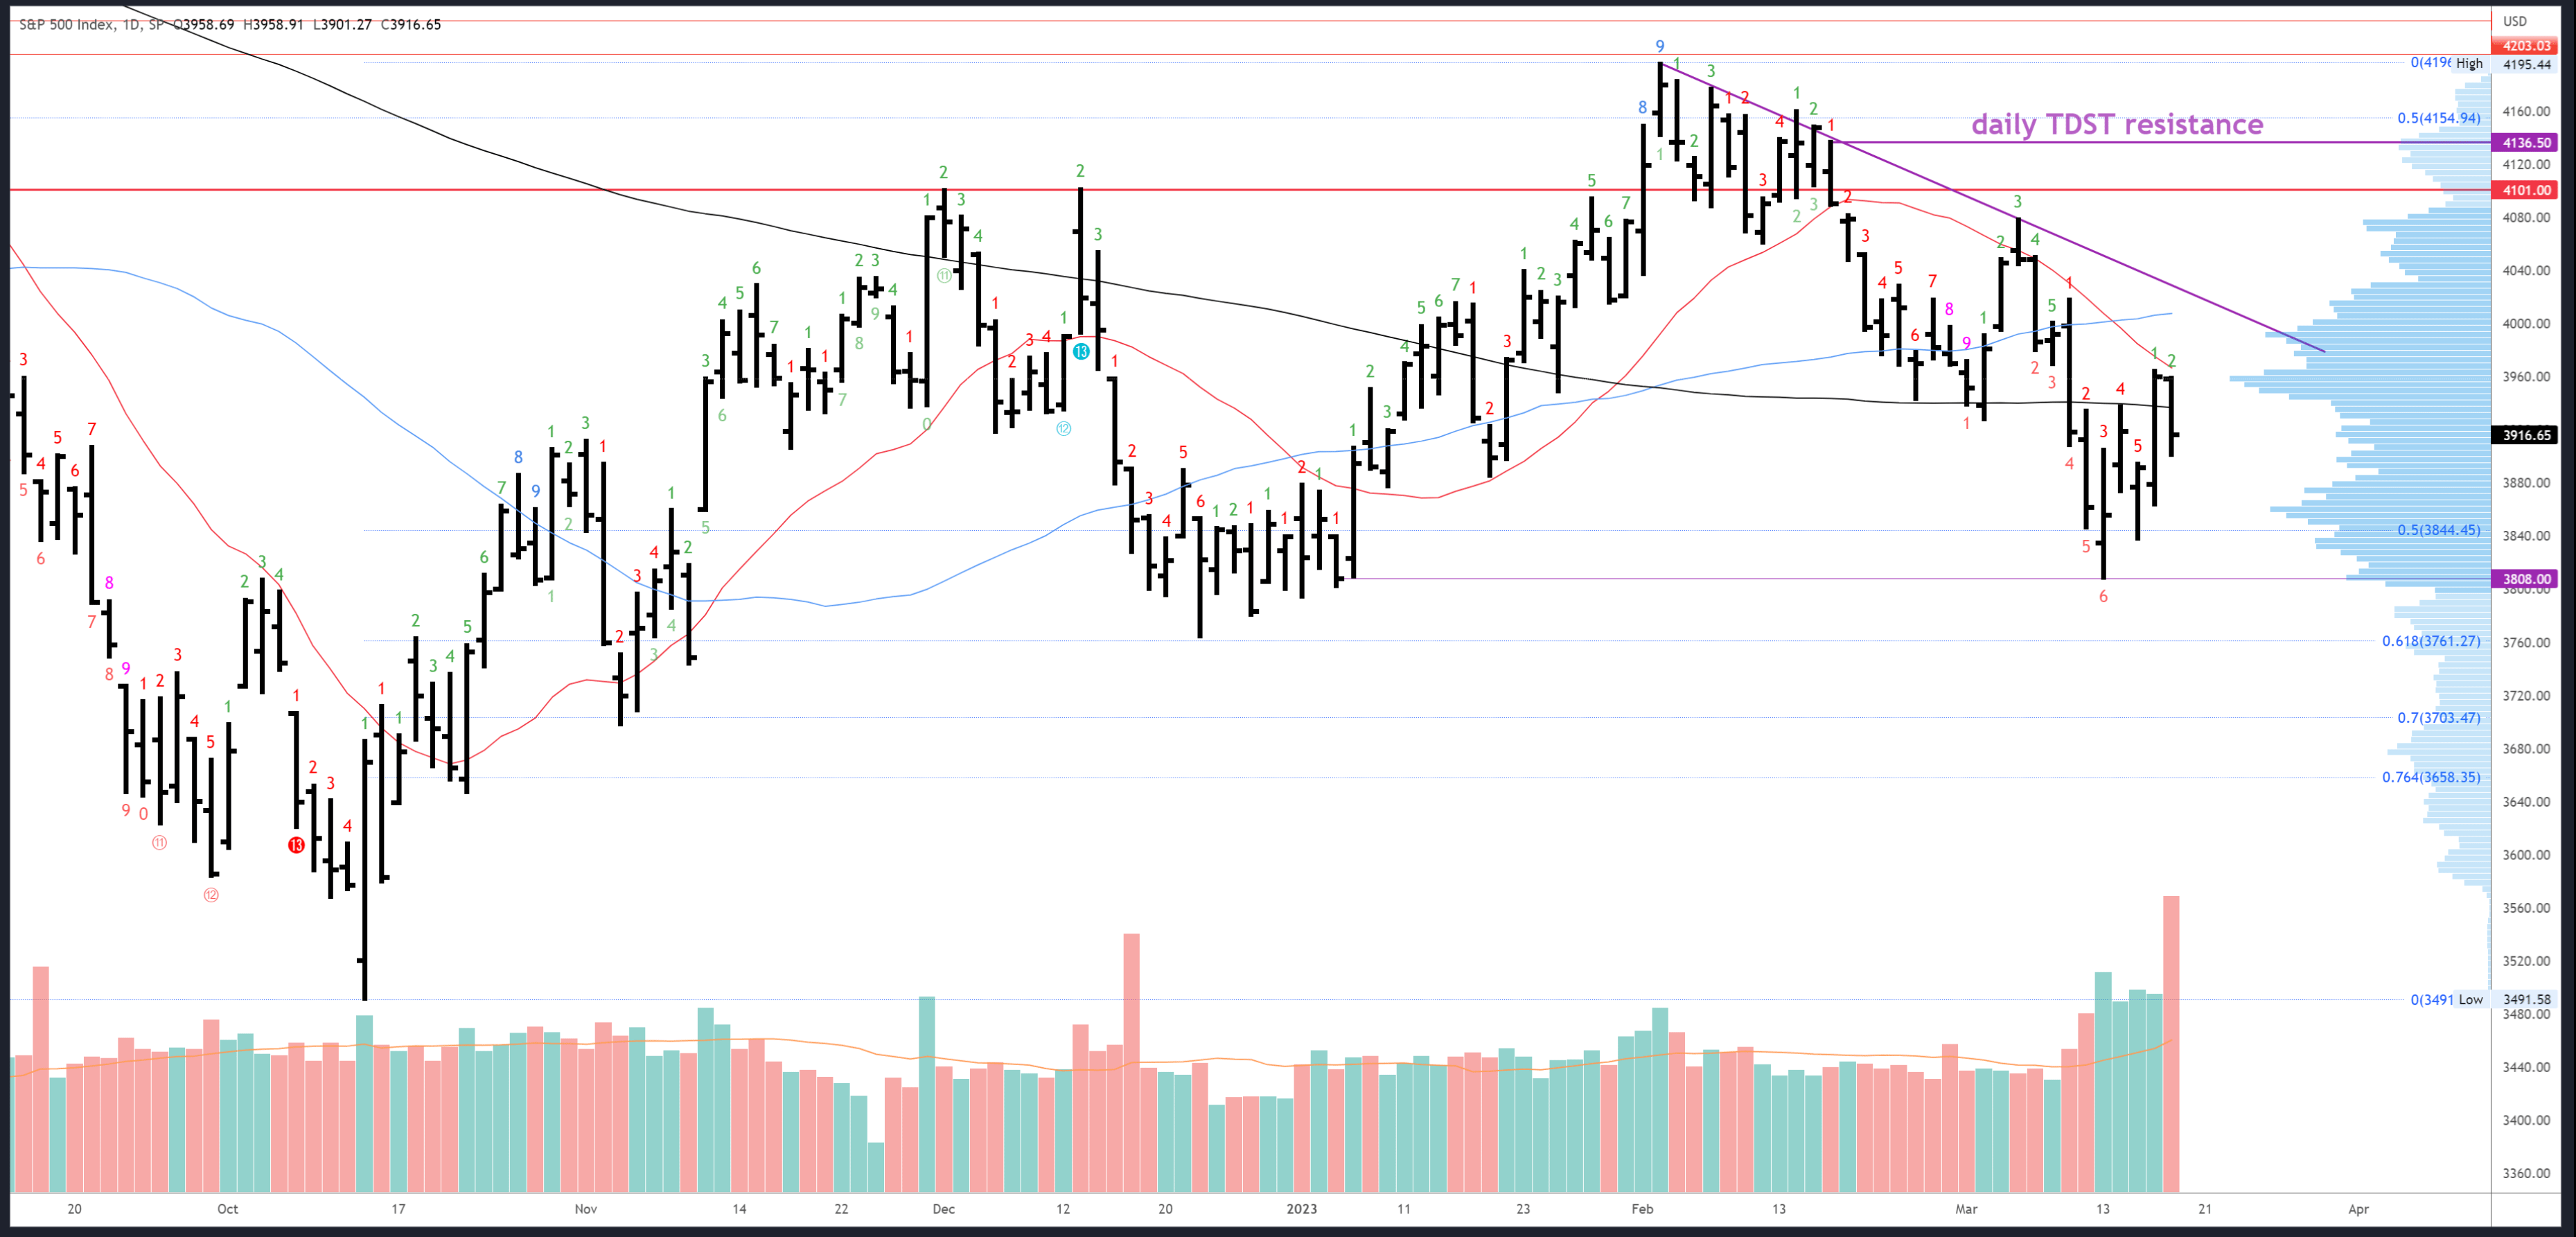
S&P 500 Daily
This week's 3808 low came from a small gap fill at the 5th January bar's close. The reaction here was key as Monday's early drop reversed back inside the previous weekly range; lower prices were rejected and this set up the recovery over the rest of the week.
More chop around the 200dma on Tuesday/Thursday/Friday erodes its significance, and we shouldn't read too much into closes above or below. Furthermore, Friday's heavy volume decline was driven by OPEX and is neutral rather than bearish.
A continued bounce and sideways consolidation in this area would develop the right 'shoulder' of a head and shoulders pattern. This is potentially a bearish pattern something to keep an eye on going forward.
Daily resistance comes in at the 3964 high and this will line up with the declining 20dma. Above that, the daily trendline will be around 4025 on Monday and declining 5 points a session. A close above the trendline should bring 4078-4101.
Initial support is 3838-44, then 3808, although these levels are fairly minor. As I said last week, I don't want to list every potential support as too many references in a close range become a hinderance. Price action and context are often more important than levels in isolation.
3761-64 is major support at the confluence of the 61% Fib and December low. After that, 3638-70 is the next best support as there is multiple timeframe confluence of the 3647 daily pivot, the weekly gap at 3638, the 76.4% Fib retrace and the monthly 50MA at 3670.
No exhaustion signals are possible next week.
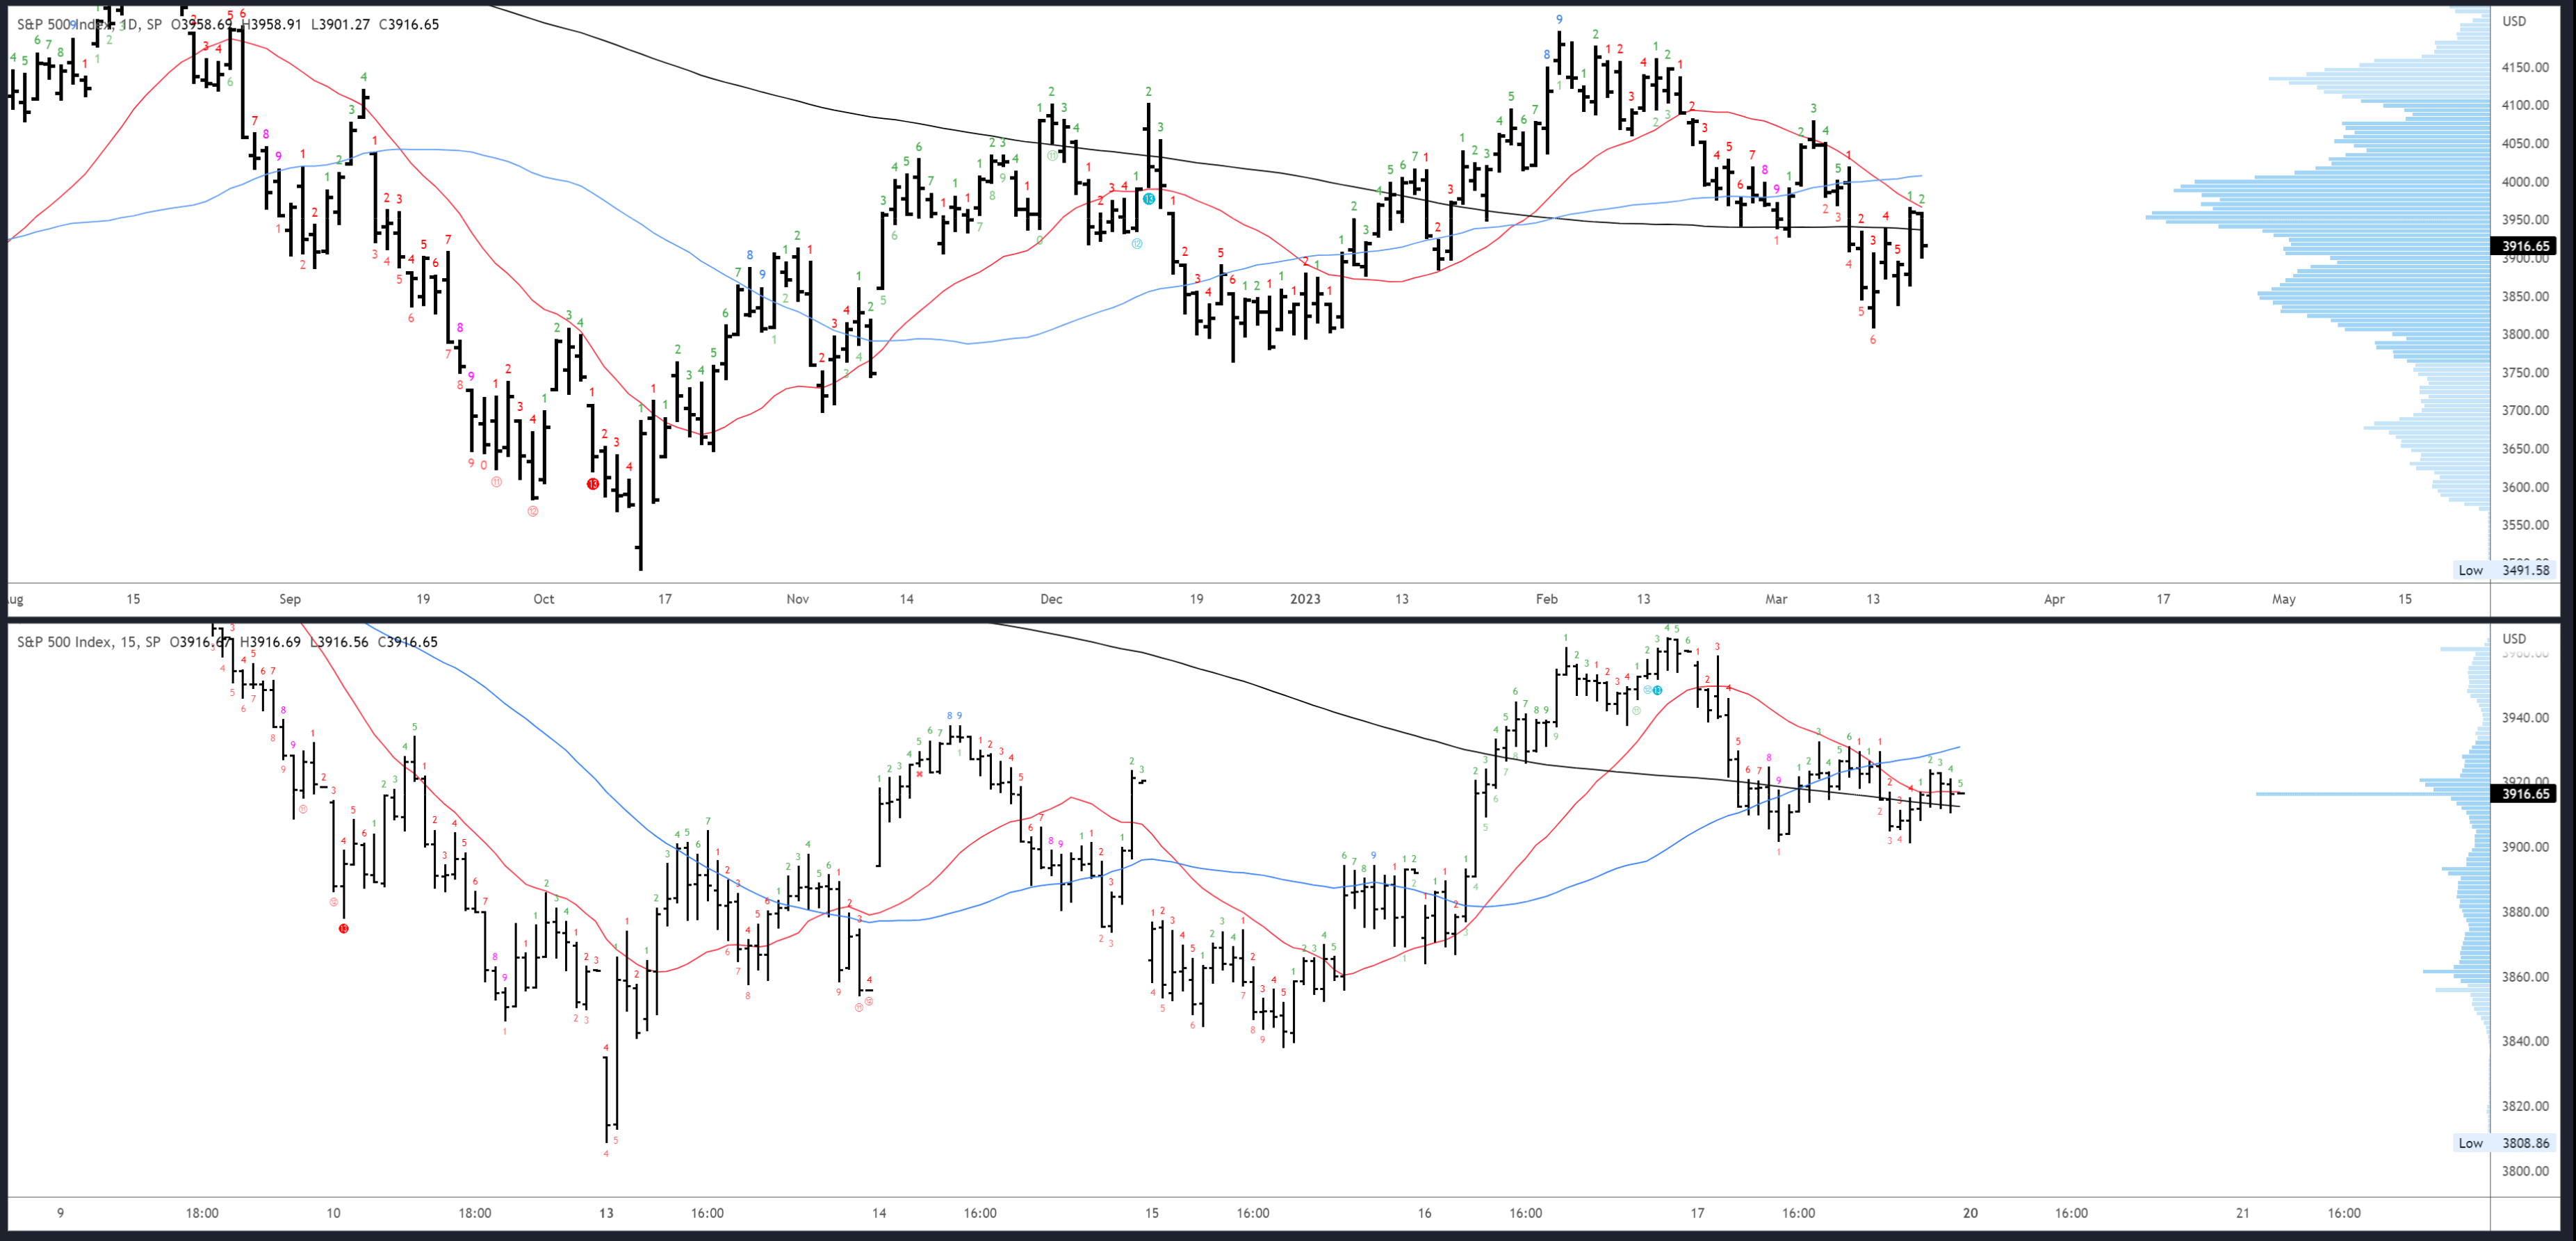
Given the neutrality of the price action, there isn't a distinct edge in either direction early next week. One thing that helped me this week was the similarity of the recovery from 3808 to the recovery off the October low. The comparison is shown below, and as it was spotted early, it provided a guide from Wednesday onwards. At this stage of the repeat, it is less useful, but does suggest the next move is a test of the 3940 area at Wednesday's low.
SPX Repeating Pattern (Tradingview)
Scenarios for Next Week
Bullish
Next week's FOMC meeting could signal a more dovish stance. Bulls will look for higher lows with 3808, and even 3838, to break above the 3964 high and into the low 4000s to test the trendline.
Bearish
The S&P500 is chopping lower but it's a slow process and bears are yet to see the decisive move - the acceleration lower that doesn't recover. This might only come nearer 3500 when panic really spreads. For now, they simply need to defend the trendline and lower highs. A break of 3808 should bring 3761-64 and then 3638-70.
Conclusion
Neutral price action is befitting the backdrop. The threat of the banking crisis has been neutralized by the Fed's liquidity injection and hawkish expectations have softened. Bears still have the upper hand over the longer-term, but there should be opportunities in both directions next week.
For further details see:
S&P 500: What Price Action Says About The 'Crisis' - Week Starting March 20th (Technical Analysis)