ACTV - S&P 500: Will The 2023 Highs Hold? - Week Starting 3rd May (Technical Analysis)
2023-04-30 11:20:04 ET
Summary
- Key technical levels and patterns in the S&P 500 across all timeframes.
- Current and future drivers of price action.
- My call for next week.
The S&P 500 ( SPY ) held support this week and ripped higher into the end of the week and month. This bodes well for the start of May, but with the FOMC and ECB meetings next week, and more heavyweight earnings, can the momentum be maintained through 4195 resistance to new 2023 highs? Or should we sell in May and stay away?
In an attempt to answer that, a variety of technical analysis techniques will be used to look at probable moves for the S&P 500 in the week ahead. The S&P 500 chart will be analyzed on monthly, weekly, and daily timeframes. I will then provide my own conclusions and make a call for the week ahead. My calls may not always be correct, but they will be based on solid evidence and made without bias.
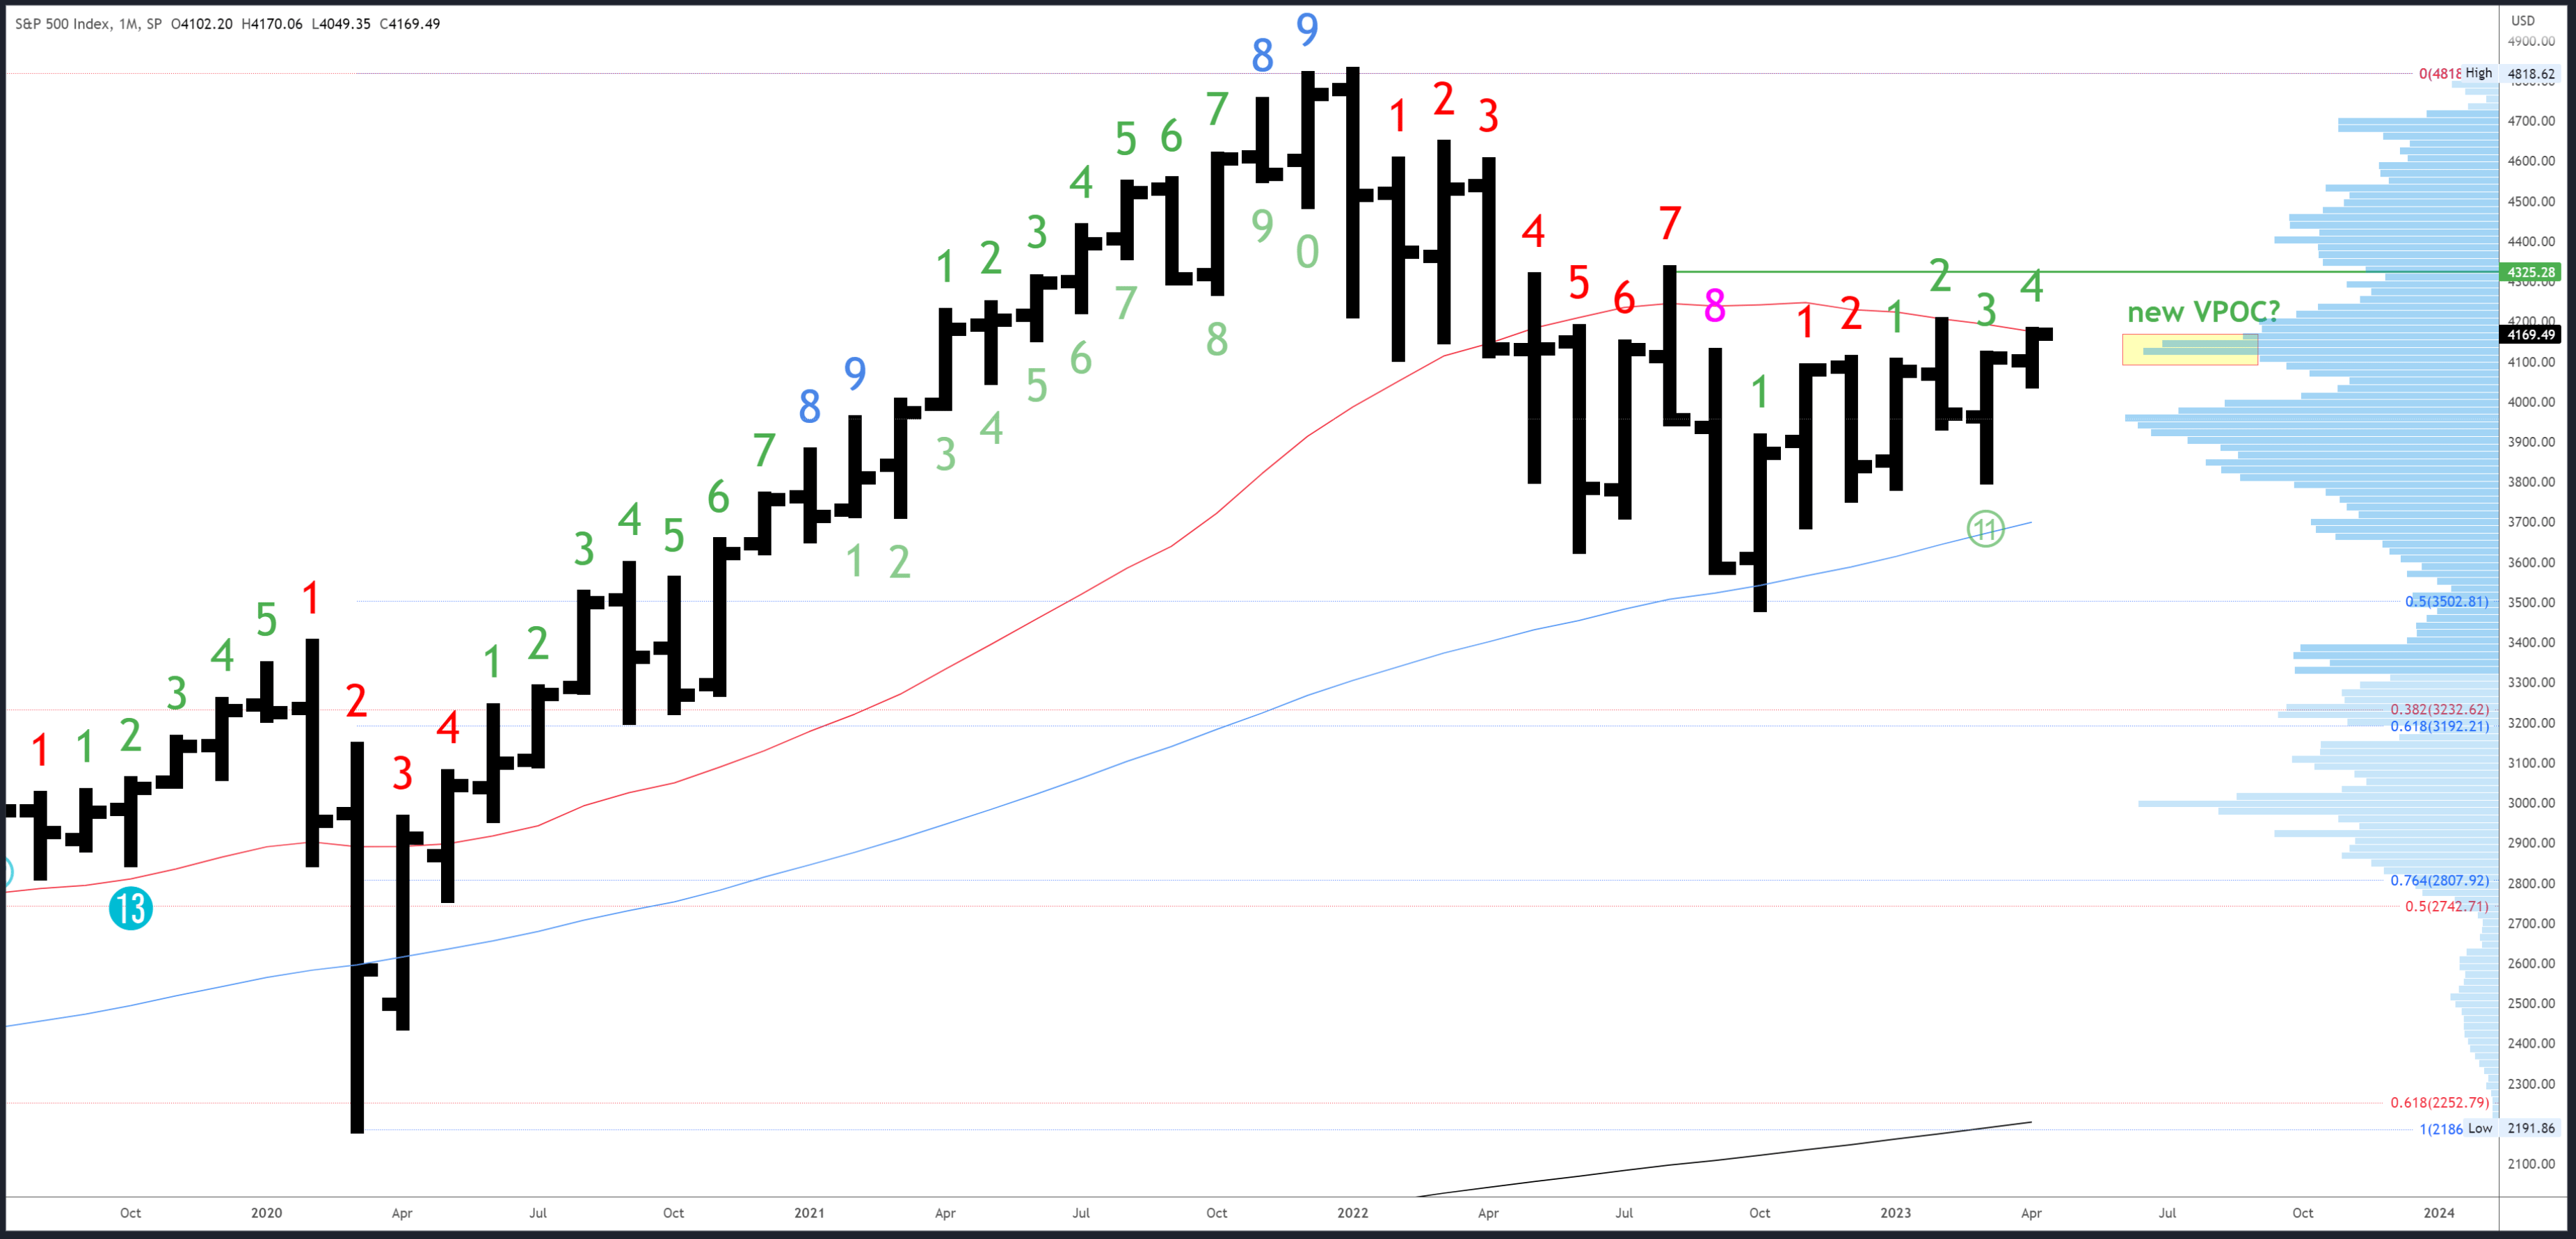
S&P 500 Monthly
After three weeks of near stasis, the April bar burst into life this week. A new monthly low was made on Wednesday and two sessions later the bar closed at new highs. That's a very rare occurrence, and the last two sessions were the strongest end to an April in 25 years.
The May bar should follow through above the 4170 April high but there is some potential resistance at 4195 and the February high. This is likely exceeded at some point, but perhaps not directly (i.e. next week could stall). Above 4195, the next major resistance comes in at 4325 and the high of August.
Support comes in at 4049 and at the March low of 3808, with the 50MA a distant 3708.
There are no exhaustion signals in either direction (using Demark methods). An upside exhaustion count will be on bar 5 (of 9) in May.
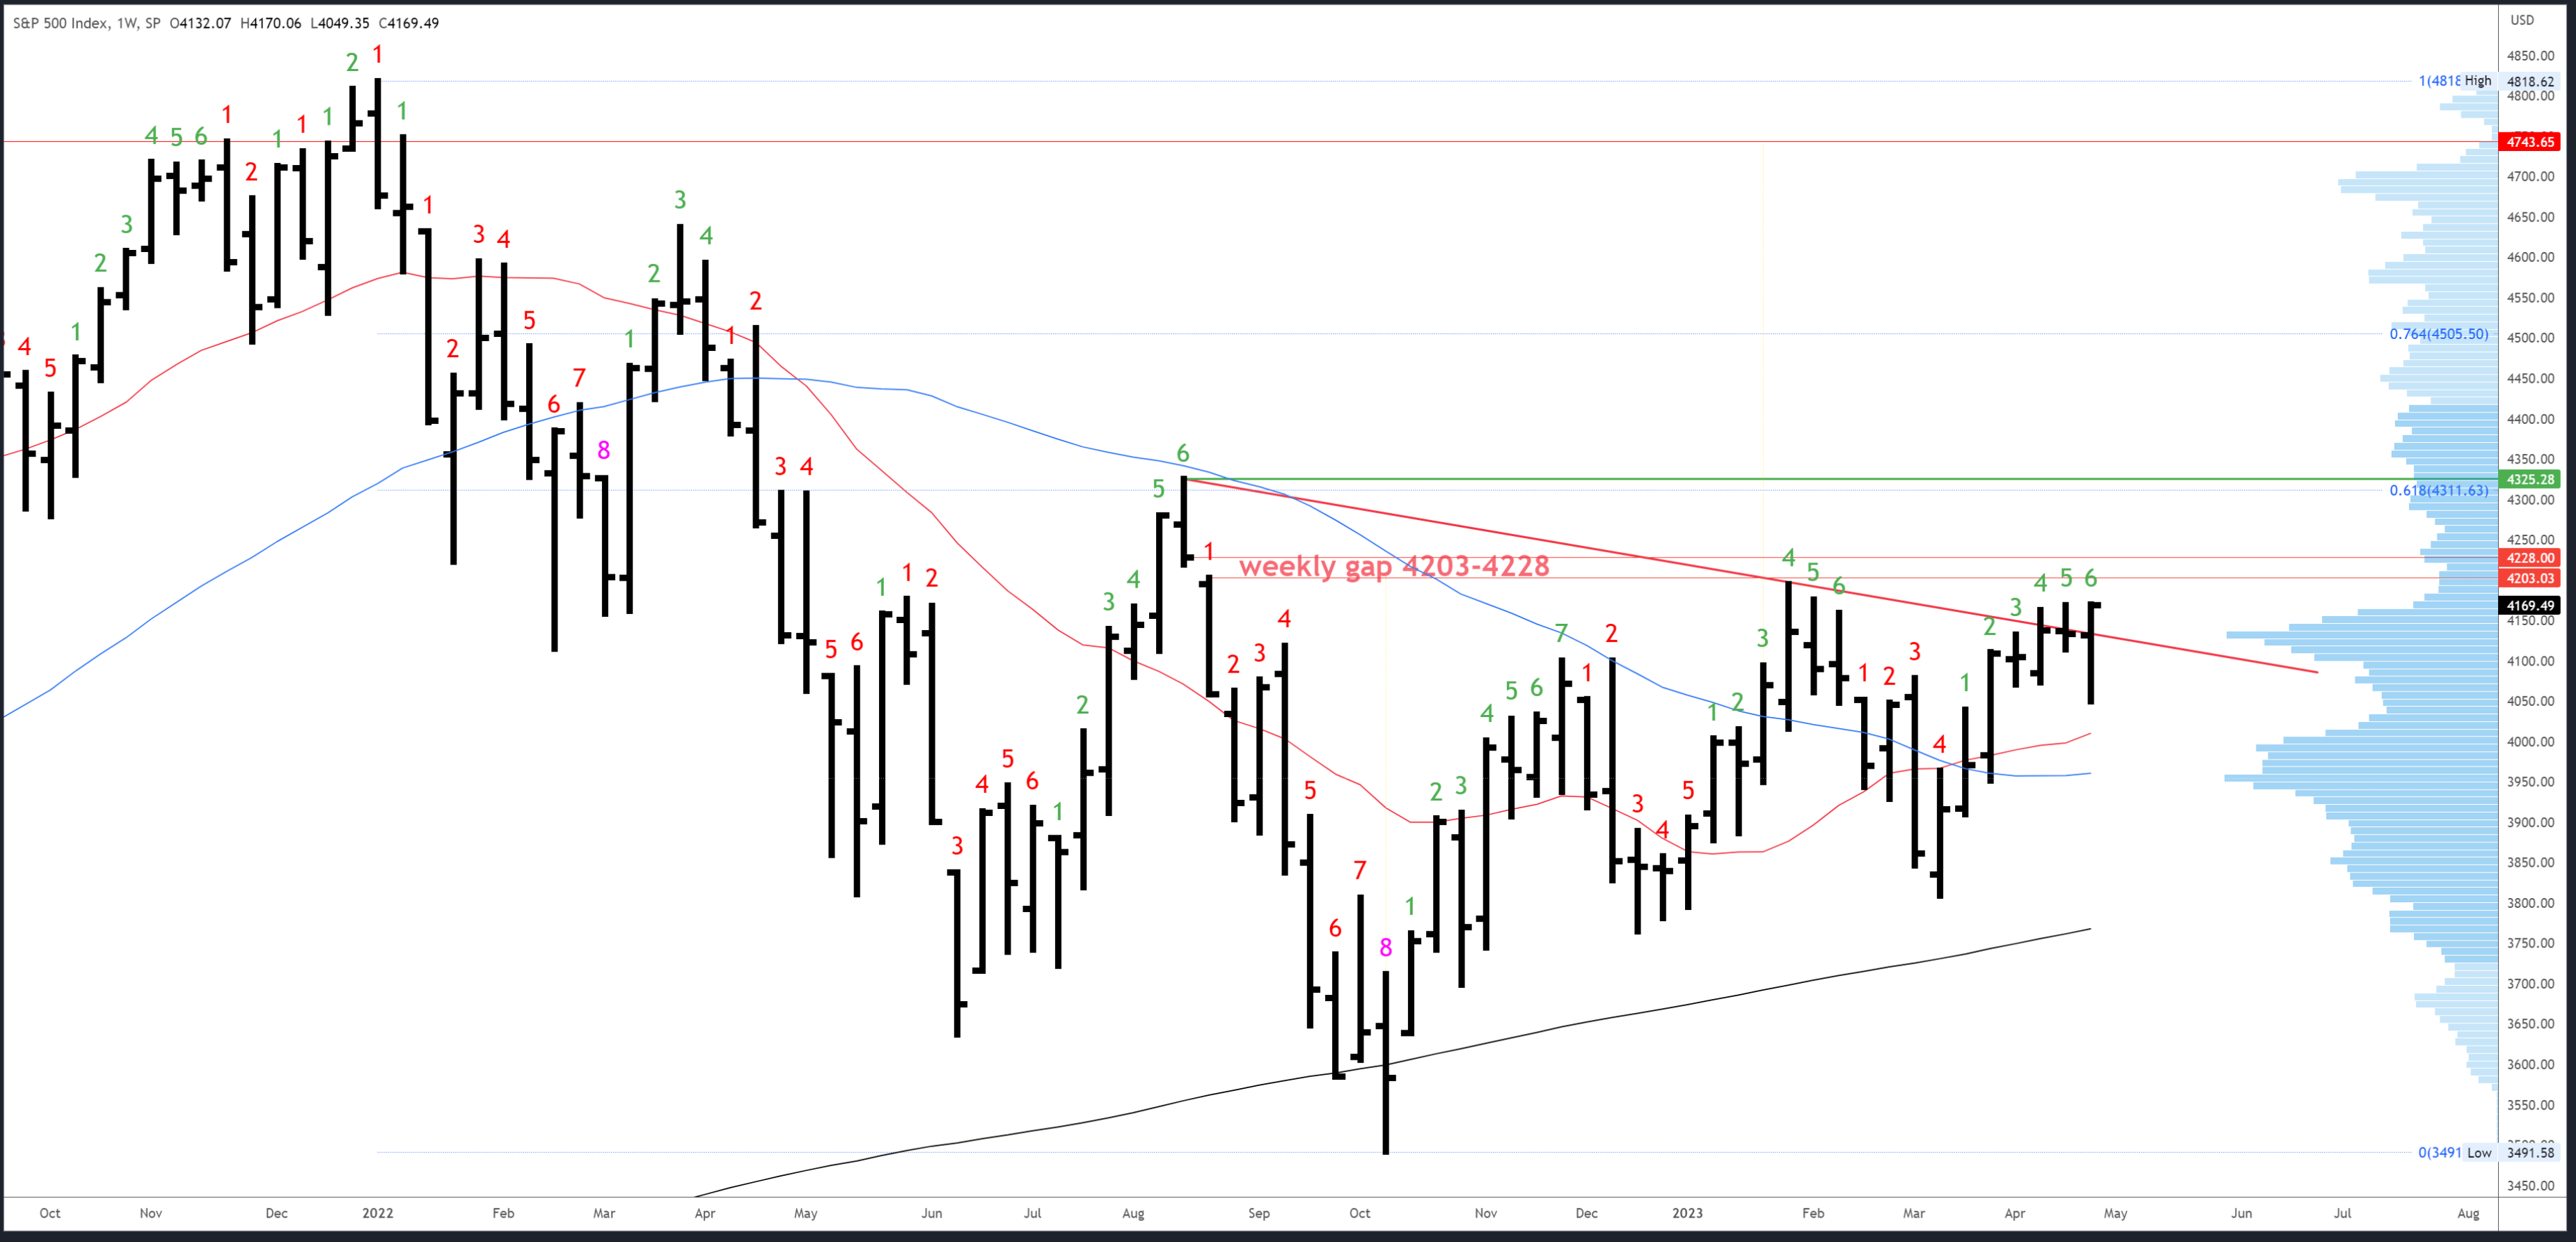
S&P 500 Weekly
This week's bullish bar closed right on the highs and above trendline resistance. Similar to the monthly bar, this projects continuation, but again, resistance in the 4189-95 area will soon come into play. Whether momentum can be maintained and push through this area is best figured out in the lower timeframes.
If 4195 is cleared, the 61% Fib retrace of the 2022 bear market is at 4311, with the August high of 4325 just above.
If 4049 breaks, 3960 is the next decent support.
There is an upside (Demark) exhaustion count underway and will be on bar 7 of a possible 9 next week.
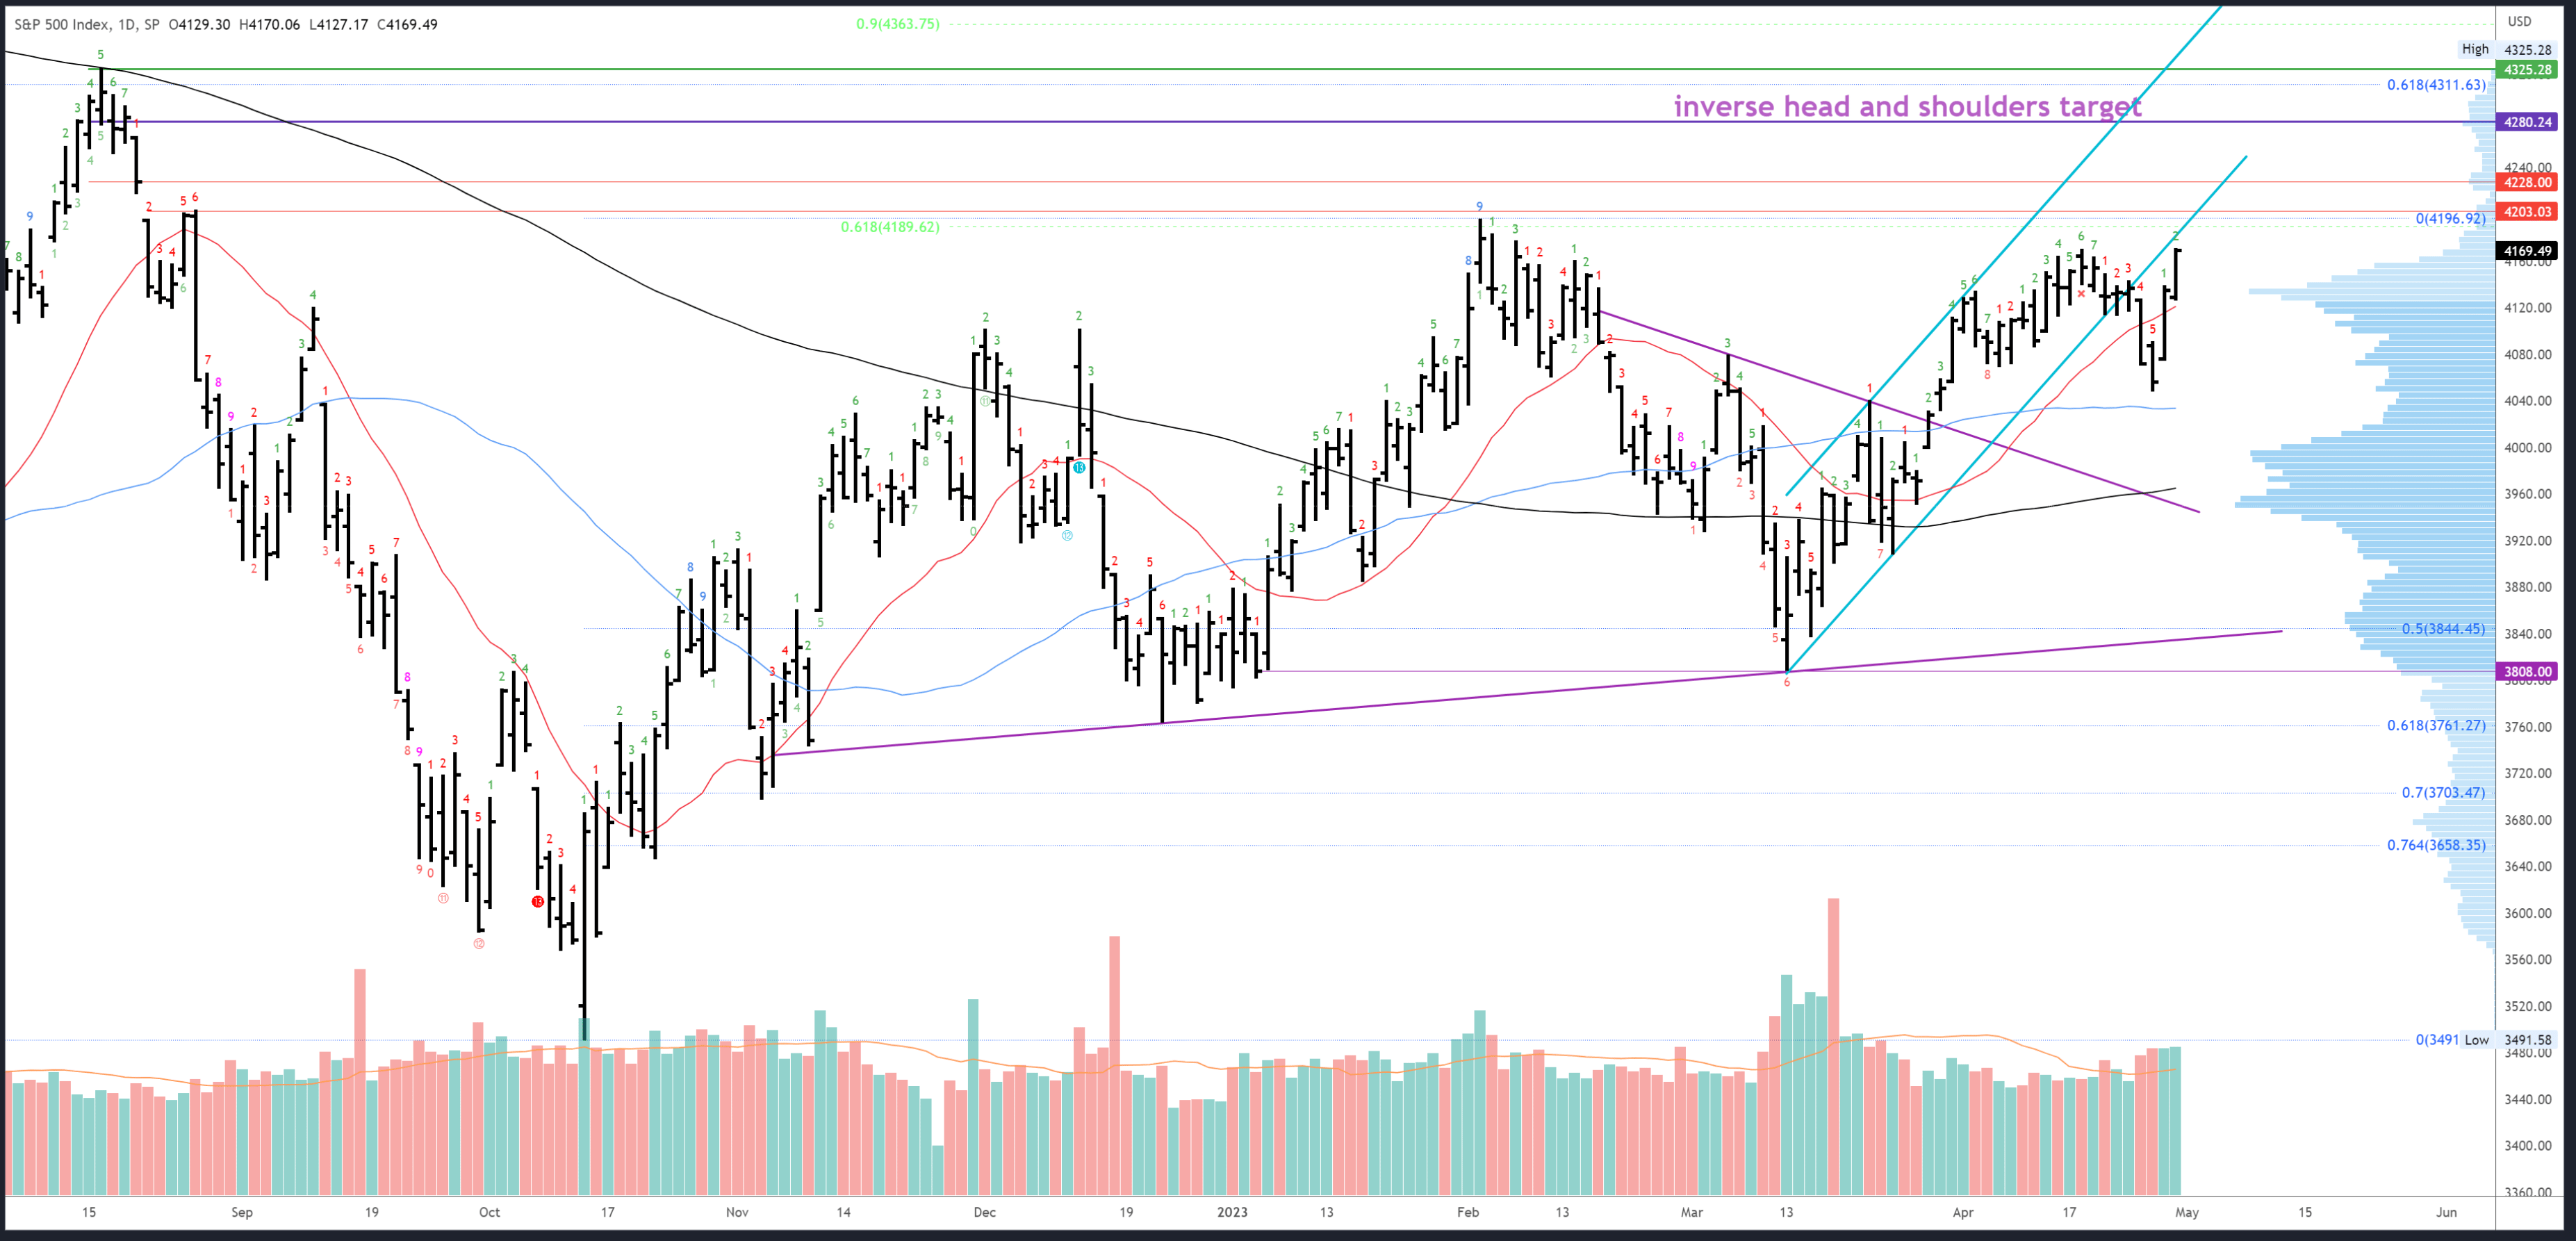
S&P 500 Daily
The daily chart still has an active head and shoulders with a target of 4280. Given the overall bullish bias, it should be reached this quarter.
This week's drop to 4049 broke the trend channel from the March low and the subsequent rally looks to be attempting a re-test. Combined with the weekly/monthly resistance in the area, the odds of a pullback look fairly high.
But how large will it be? This is a bullish chart that is threatening a breakout and a move to 4280-300. Shorting is not really an option until a failed rally above 4170 leads to a weak close back under 4169 to signal a period of weakness.
The first decent support is 4070-78, then 4049. If 4049 breaks, the 50dma and gap area at 4032 should prompt a bounce, but 3960 is the next major area.
No Demark exhaustion signals are possible next week.
Events Next Week
The FOMC meeting on Wednesday is the main event. A 25bps hike is priced in and all but guaranteed, but the market seems to also expect the Fed to announce a pause, especially now First Republic Bank is entering receivership. A confirmed pause could drive the break of 4195. However, the Fed may want to keep their options open, and push back on dovish expectations, in which case a larger dip could unfold.
Apple ( AAPL ) earnings on Thursday after the bell will complicate the post-FOMC moves.
Probable Moves Next Week
Follow through above 4170 is expected next week. However, in the near-term, the rally from 4049 looks mature and is overbought. Any early strength should therefore fade and a close back under 4169 should lead to a dip to around 4127 ahead of the FOMC meeting.
What happens after that very much depends on the Fed and the price action around the event. Technical analysis is predictive but also reactive.
While I think the S&P500 will break 4195 eventually, price would need to close strong and near 4169 to set up a clean break directly.
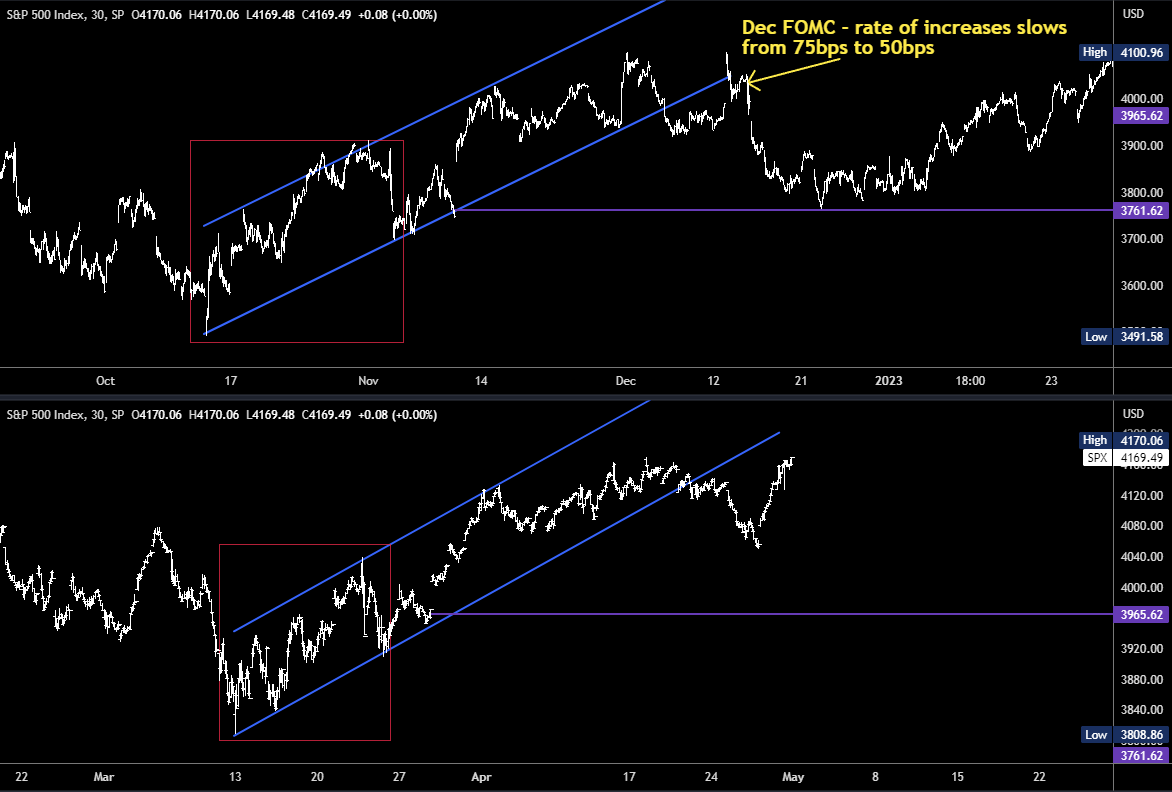
Should price close weak near 4070, a deeper dip could unfold. There are similarities with the rally into the December 2022 FOMC meeting which supports the idea of a move to 3960. If this plays out, it could be a great a buy for the move to 4280-300.
For further details see:
S&P 500: Will The 2023 Highs Hold? - Week Starting 3rd May (Technical Analysis)