CME - S&P Global: Can This Wide-Moat Stalwart Be Used For Dividend Growth Investing
2023-04-24 13:32:13 ET
Summary
- S&P Global Inc. has increased dividends for 50 consecutive years, but with the recent merger with IHS Markit, there are concerns whether this dividend king can maintain its past dividend growth.
- In this article, I intend to examine S&P Global in detail to determine if the stock is a suitable candidate for dividend growth investing.
- I will review the growth track record and outlook of S&P Global, as well as assess its merit as a dividend growth investment target.
S&P Global Inc. ( SPGI ) is a dividend king, having raised its dividends for 50 years in a row. However, its stock price has dropped since the beginning of 2022. So, does that make SPGI an attractive target for dividend growth investing?
In this article, I closely examine S&P Global to address the following queries: Firstly, whether the company is expected to sustain its growth and offer future dividend raises with substantial coverage; Secondly, whether SPGI is a suitable target for dividend growth investing. For a more comprehensive analysis of this stock, I recommend perusing an excellent piece by a fellow analyst on Seeking Alpha.
An overview of S&P Global
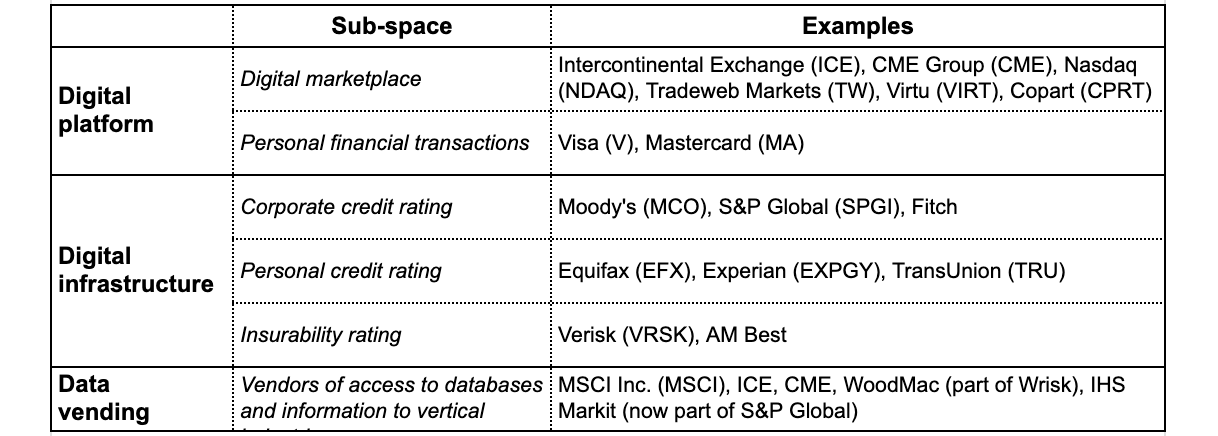
S&P Global is part of what I refer to as the " digital resource " companies, as illustrated in Table 1. These businesses share certain characteristics, as outlined in a previous article of mine :
- Firstly, they offer a unique value proposition . By leveraging often irreproducible databases or facilitating data-intensive operations, these B2B companies generate recurring, subscription-based revenue from business or government customers.
- Secondly, they possess a wide moat , meaning they occupy a monopolistic or oligarchic position in their respective niches. This is due to the presence of formidable barriers to entry, some network effects, and switching costs, which provide them with a sustainable competitive advantage over their industry peers. As a result, they tend to remain resilient during industry crises.
- Thirdly, they dominate their native industries . Some of them were even established with the backing of industry advocacy groups. Over time, they expand into adjacent industries, leveraging their deep industry roots.
- Fourthly, they prioritize capital and operational efficiency . These companies develop scalable solutions that can be built once and sold or installed countless times, making them capital-light and highly efficient. They generally generate superior profitability and deliver a high rate of return on invested capital.
- Finally, they are known for aggressive acquisitions . As they expand their services into adjacent verticals, they often encounter a fragmented competitive landscape that is ripe for mergers and acquisitions. This further fuels their rapid growth.
Table 1. Competitive landscape of the digital resource space (Laurentian Research for The Natural Resources Hub)
S&P Global has acquired or developed a range of databases customized for specific vertical industries. For example, through the acquisition of IHS Markit on February 28, 2022, SPGI now possesses the only truly-global petroleum exploration and production (E&P) database. This database includes detailed information on over 6 million oil and gas wells worldwide, making it impossible for any competitor to replicate due to the massive capital and resources required. Clients typically secure multi-year licenses for these databases to facilitate their internal workflow. In addition, SPGI produces reports on the latest industry developments for its vertical industry customers, who can subscribe to these reports. To summarize, subscription-based recurring revenue now accounts for 72% of S&P Global's total revenue, up from 69% prior to the merger with IHS Markit.
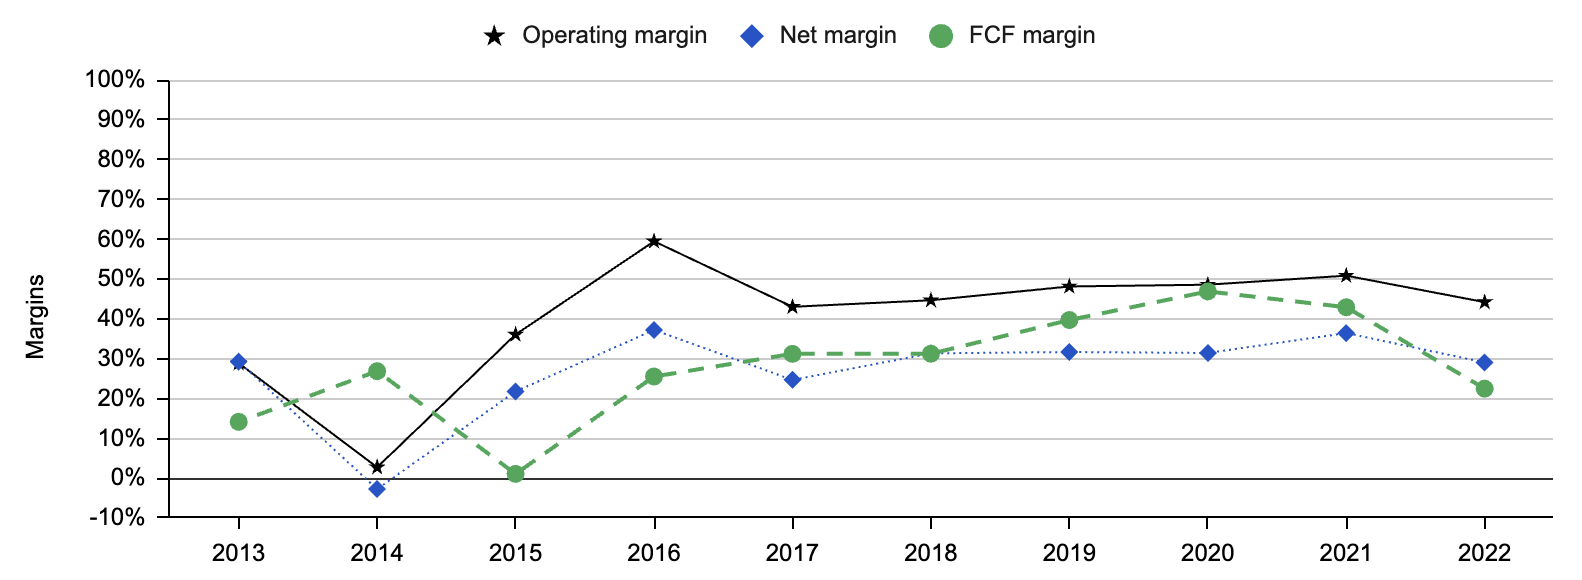
In 2021, the last year prior to merging with IHS Markit, S&P Global achieved an adjusted operating margin, net margin, and free cash flow margin of 50.9%, 36.5%, and 42.9%, respectively. It was able to convert 117.8% of the net income into free cash flow ("FCF"). However, the adjusted operating margin, net margin and FCF margins dropped in 2022 to 44.2%, 29.1% and 22.5%, respectively, as evidenced in Figure 1. The decline in margin was because IHS Markit had lower margins.
In 2021, prior to merging with IHS Markit, S&P Global achieved impressive financial results with an adjusted operating margin, net margin, and free cash flow margin of 50.9%, 36.5%, and 42.9%, respectively. Furthermore, it was able to convert 117.8% of net income into free cash flow. However, as seen in Figure 1, the adjusted operating margin, net margin, and FCF margins declined in 2022 to 44.2%, 29.1%, and 22.5%, respectively, while FCF conversion decreased to 77.4%. The decline was primarily due to IHS Markit's lower margins.
Fig. 1. Adjusted operating, net and FCF margins of S&P Global (compiled by Laurentian Research for The Natural Resources Hub based on financial filings of S&P Global and Seeking Alpha)
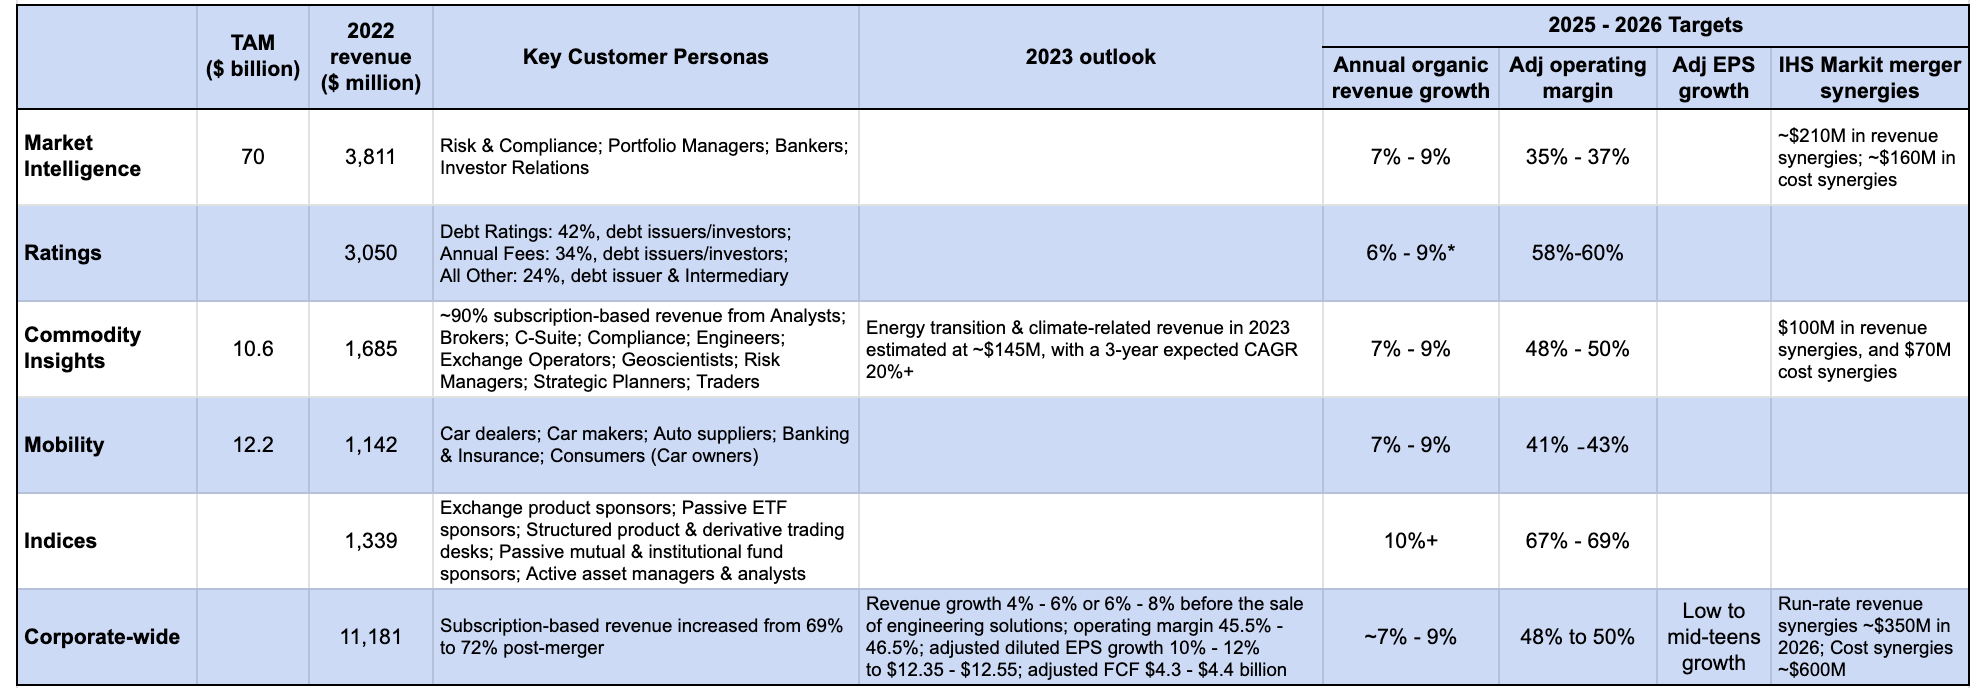
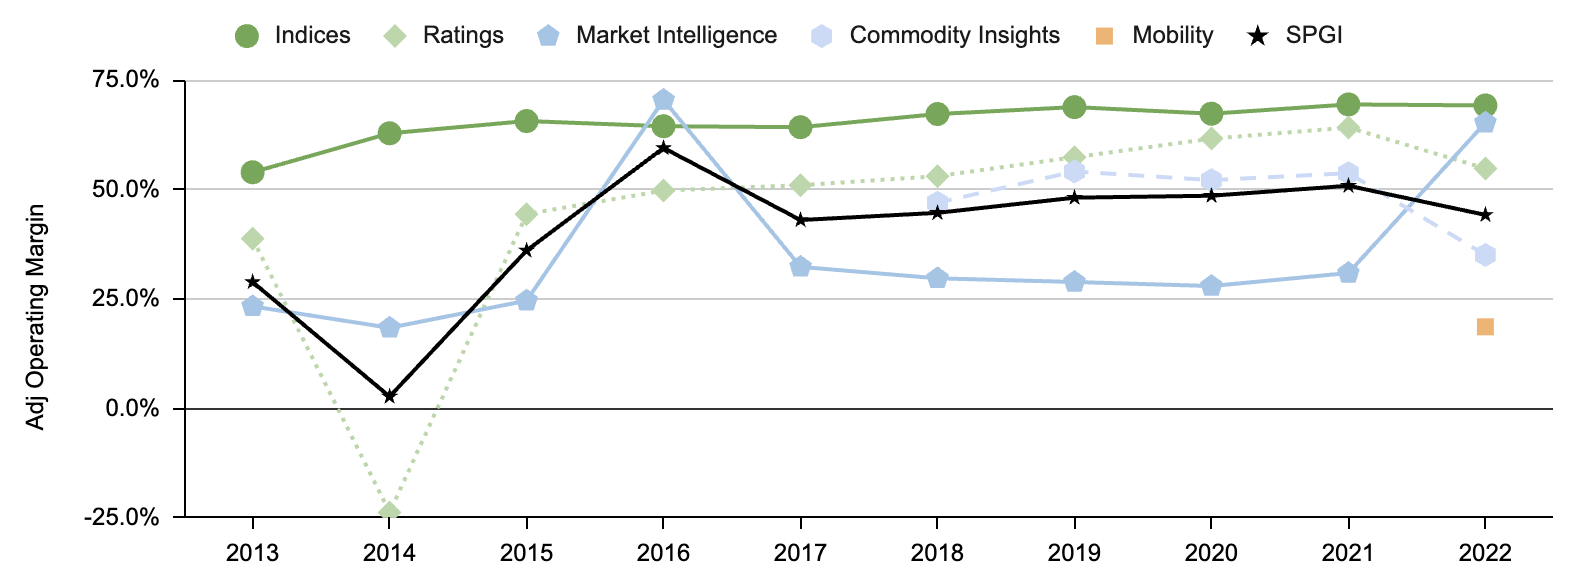
S&P Global operates in five divisions: market intelligence, ratings, commodity insights, mobility, and indices, as shown in Table 2. As illustrated in Figure 2, the ratings and indices divisions had higher margins, whereas the market intelligence and mobility divisions had lower margins compared to the other three divisions.
Table 2. The five divisions of S&P Global (compiled by Laurentian Research for The Natural Resources Hub based on information released by S&P Global) Fig. 2. Adjusted operating margin for the five divisions of S&P Global, noting that prior to 2018, commodity insights were not separated from market intelligence (compiled by Laurentian Research for The Natural Resources Hub based on financial filings of S&P Global and Seeking Alpha)
Growth
Characteristics of historical growth
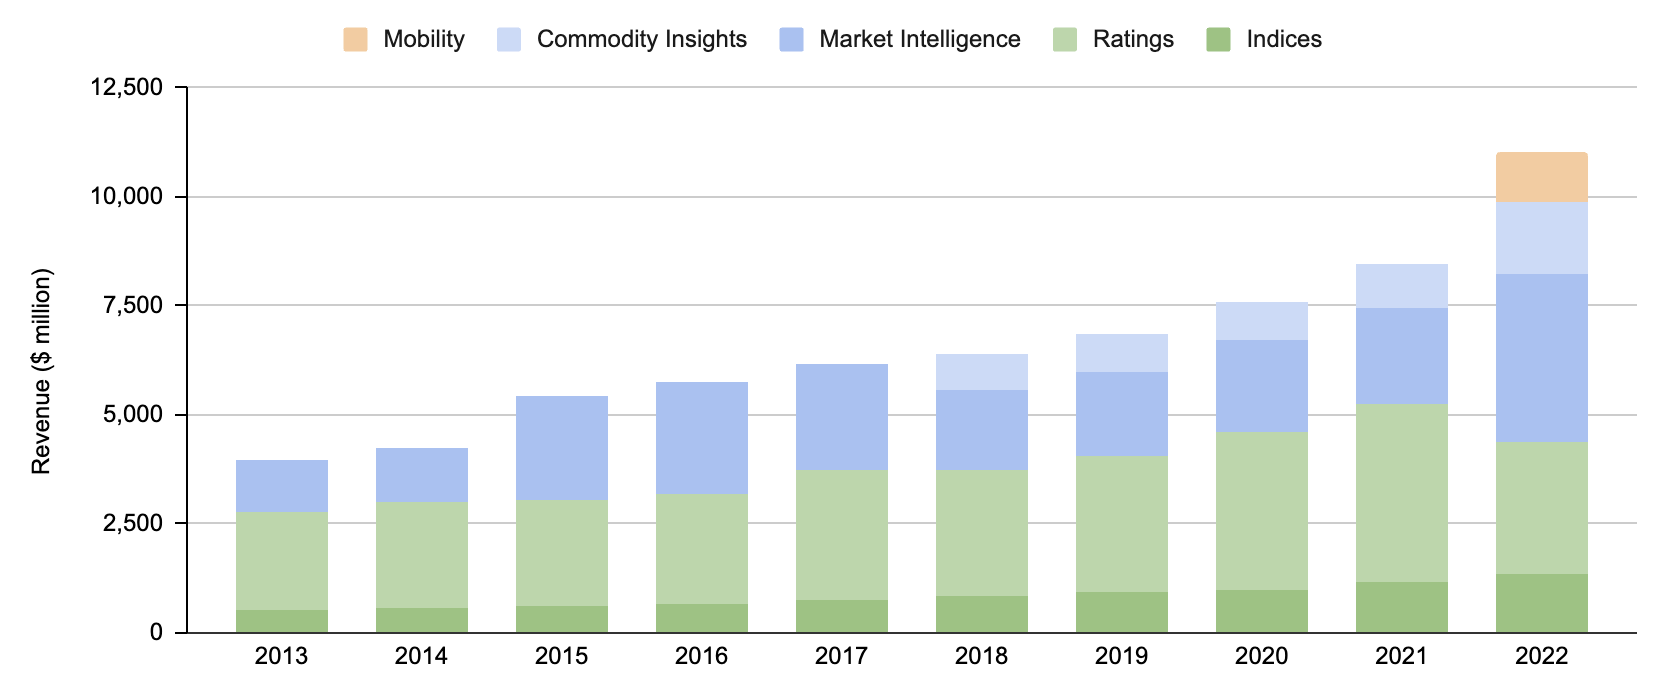
S&P Global demonstrated an impressive compound annual growth rate (or CAGR) of 12.1% in revenue from 2013 to 2022, as illustrated in Figure 3. This growth includes organic growth and a number of strategic acquisitions during this period. The acquisitions include SNL Financial, a financial news company, in 2015, Kensho Technologies, an artificial intelligence firm, in 2018, 451 Research, a global IT research and advisory company, in 2019, and IHS Markit and The Climate Service, both information providers, in 2022, while divestitures include McGraw-Hill Education and Aviation Week in 2013, McGraw-Hill Construction in 2014, and both J.D. Power & Associates and Equity Research Group in 2016.
It's important to mention that the revenue from ratings experienced a significant decrease in 2022 , mainly due to a dramatic decline in the volume of debt issuance. During 2020, global rated issuance dropped 28% or 31% when including the impact of leveraged loans, while high-yield issuance decreased 77% from the previous year. However, this decrease was more than compensated by a 6% revenue growth in the ex-ratings segments and particularly the inclusion of IHS Markit, which resulted in increased revenue for the market intelligence and commodity insights segments.
Fig. 3. Annual revenue of S&P Global by business segment, noting that prior to 2018, commodity insights were not separated from market intelligence (compiled by Laurentian Research for The Natural Resources Hub based on financial filings of S&P Global and Seeking Alpha)
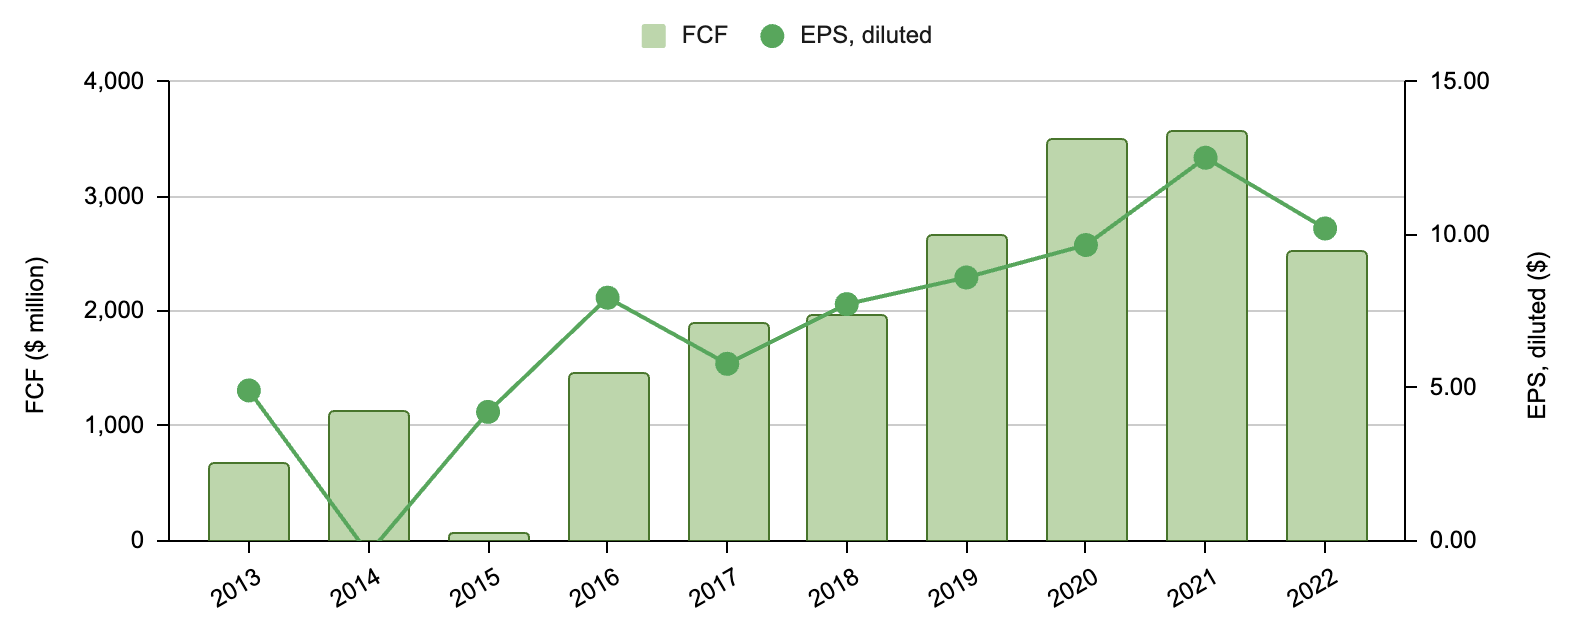
With the exception of the indices segment, the adjusted operating margins for the other segments underwent significant changes year-over-year, particularly before 2017, as Figure 2 illustrates. This resulted in corresponding changes in operating margin, net margin, and FCF margin from one year to the next, as demonstrated in Figure 1. Consequently, earnings per share and free cash flow experienced noteworthy changes year-over-year, despite the overall trend of growth depicted in Figure 4. Therefore, the decline in EPS and FCF from 2021 to 2022 is not unusual for S&P Global.
Fig. 4. Annual FCF and EPS of S&P Global (compiled by Laurentian Research for The Natural Resources Hub based on financial filings of S&P Global and Seeking Alpha)
Growth outlook
During the 2022 Investor Day , S&P Global unveiled its strategic vision, which included a projected organic revenue growth of 6.5% to 8.0%, an adjusted operating margin of 45% to 47%, and low double-digit adjusted EPS growth for 2023. However, by the time the full-year 2022 results were released on February 9, 2023 , the company had revised its guidance to reflect revenue growth in the range of 4% to 6%, an operating margin between 45.5% to 46.5%, and an adjusted diluted EPS growth of 10% to 12%, with deal-related amortization excluded, resulting in a range of $12.35 to $12.55. It's worth noting that the EPS guidance is non-GAAP due to uncertainty regarding the timing of the divestiture of the engineering solutions segment. Excluding the impact of this sale, S&P Global anticipates revenue growth between 6% to 8%, with adjusted free cash flow in the range of $4.3 billion to $4.4 billion.
It is important to note that debt issuance is anticipated to bounce back to positive growth in 2023 after the significant declines experienced in 2022, because issuers often refinance their outstanding debts. Furthermore, the build issuance, the direct driver of SPGI's financial results, is expected to rise between 2% to 6% for the full-year 2023.
Looking ahead, S&P Global is likely to benefit from substantial synergies resulting from the merger with IHS Markit, which previously had a reputation for lax management. Margins are expected to expand in 2023 as expense growth is projected to remain below revenue growth, and the expenses should moderate significantly from the fourth quarter of 2022, as indicated in Table 2.
Dividends
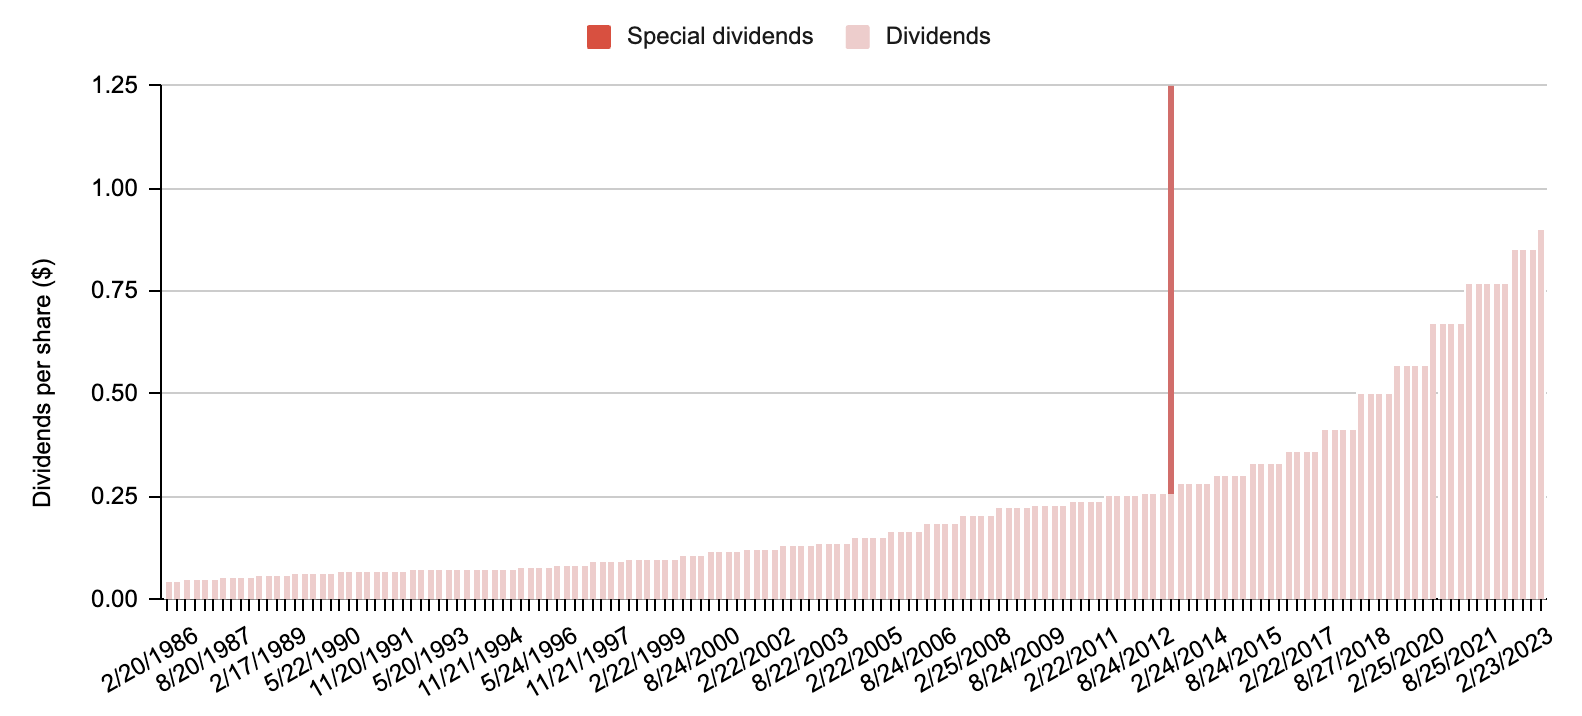
S&P Global's remarkable track record of consistent dividend growth spanning 50 consecutive years, as depicted in Figure 5, has earned the company the title of a "dividend king" in 2023.
Fig. 5. Quarterly dividends of S&P Global (compiled by Laurentian Research for The Natural Resources Hub based on financial filings of S&P Global and Seeking Alpha)
S&P Global's aim is to return a minimum of 85% of adjusted free cash flow to shareholders through a combination of dividends and share buybacks. The quarterly dividend payment will be $0.90, representing a 30% dividend payout ratio and an approximate dividend yield of 1.02%. Additionally, the board has authorized a $3.3 billion share buyback for 2023, which will be funded, in part, using the net after-tax proceeds from the engineering solutions divestiture.
Over the past decade, S&P Global has increased its dividends at a compounded annual growth rate (or CAGR) of 12.4%. Assuming the company can sustain this dividend growth rate, the yield to cost will rise to 3.3% in 10 years, 5.9% in 15 years, and 10.6% in 20 years. This suggests that, as a dividend growth investment, the stock is more suitable for investors who are at least 15-20 years away from retirement.
Valuation
S&P Global is currently trading at a forward price-to-earnings multiple of 28.0X or a forward price-to-free cash flow multiple of 25.6X. These multiples are comparable to those of similar digital resource stocks, such as Intercontinental Exchange ( ICE ), CME Group ( CME ), Moody's ( MCO ), MSCI Inc. ( MSCI ), Nasdaq Inc. ( NDAQ ), Tradeweb Markets ( TW ), and London Stock Exchange Group plc ( LNSTY ).
If we assume that S&P Global's earnings per share will continue to grow at a CAGR of 12.5% for five years, at 6.25% for an additional five years, and at 2% thereafter, and apply a weighted average cost of capital ((or WACC)) of 7.1%, the estimated net asset value for the company would be $400, indicating a potential upside of 14% from the share price as of April 21, 2023.
My valuation of SPGI is consistent with the consensus among Wall Street analysts , who have an average one-year price target of US$415.27 for the stock, with a low forecast of US$393.9 and a high forecast of US$455.7.
The main risk for investors in S&P Global is that a recession could delay the recovery of debt issuance, which would cause the stock to continue its downward trend. Nevertheless, S&P Global has demonstrated a history of strong recovery following a crisis. Therefore, in my opinion, a potential selloff could represent an opportunity for long-term investors to acquire S&P Global Inc. stock at an attractive price.
Investor takeaways
My analysis demonstrates that S&P Global Inc. has a strong track record of bouncing back from short-term dips in financial results, thanks to its wide economic moat. The recent merger with IHS Markit had caused a temporary decline in margins, but I anticipate that the management will work towards restoring the company's high margins.
Currently, S&P Global Inc. is trading at a 12% discount to its estimated intrinsic value, which is reasonable for a "dividend king." However, the low dividend yield may make it more suitable as a dividend growth investment target for those who are 15-20 years from retirement.
For further details see:
S&P Global: Can This Wide-Moat Stalwart Be Used For Dividend Growth Investing