META - Sandbrook Capital Q1 2023 Partners Letter
2023-05-05 13:42:00 ET
Summary
- During the quarter, I gave too much credence to top down and macro data which led me to overmanage our net exposure.
- Sonos began as one of the largest longs at my last shop. We entered the position in September 2020 and exited the majority of the position in Q4 2021.
- As is our stated goal, the fund will swing at attractive risk/reward across beta, factor, sector, and idiosyncratic bets when presented with compelling opportunities.
Sandbrook Capital Partners, LP
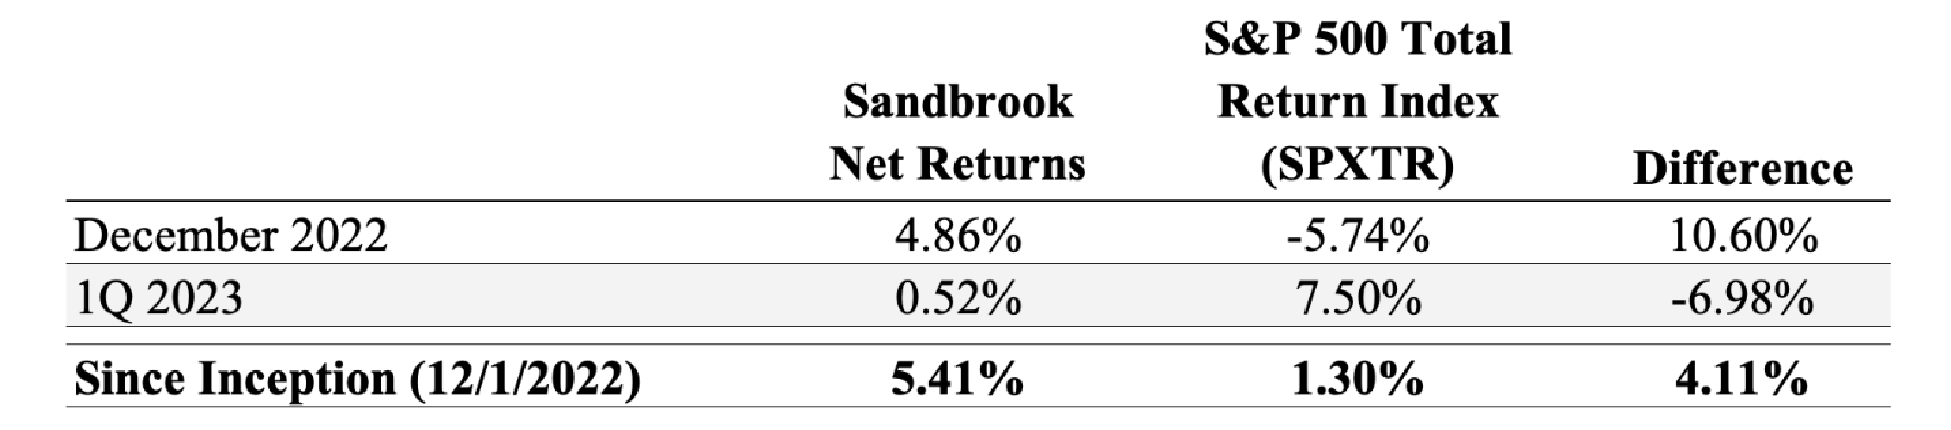
Returns
1Q Commentary
Dear Partners,
Decisions I made led the fund to underperform the index during the quarter. While we expect to run around 70% net long (and >70% on a beta adjusted basis) over the cycle and the S&P500 Total Return Index is the appropriate benchmark, the portfolio did not resemble the makeup of the index this quarter. The fund ran with a positive net exposure only 4 days during the quarter – all of which were in early January. This negative net decision was particularly painful given the strong performance of our two core focus areas, technology and consumer discretionary (both up 20% YTD). This was a choice by me given our flexible mandate and I ignored several of my own and external signals in running the book this way. During the quarter, I gave too much credence to top down and macro data which led me to overmanage our net exposure.
Our batting percentage on individual names was solid at 0.75 in the long book and 0.6 in our short book. Our single name slugging percentage was strong in both the long and short books, but a QQQ short hurt our overall slugging percentage in the last two weeks of March. The average gross exposure during the quarter was ~70%. In short, our underperformance in the quarter came from my choices in the PM seat rather than the analyst seat.
I view the S&P 500 Total Return Index as the right benchmark for us given it is the opportunity cost to partners for a net long equity “hedge fund” allocation (our positive expected net exposure and focus on higher beta names is the reason for our 10% annual hurdle before performance fees as I believe I should only get paid for alpha). Risk management is paramount in low net strategies and we did a fine job given the strong performance of higher beta names in the quarter (the average name in our book had a beta around 1.5). Our mandate is to swing at attractive risk/reward in a measured but opportunistic way. My choice on our net exposure is an output of the risk/reward I see across the market, our sectors, and our individual names given the inputs of current price levels and the probability of likely ST and LT economic (i.e. multiples) and operating outcomes. I generally saw “fair value” and risk/reward as weighted to the downside.
Looking back at the quarter, I got several things right and wrong.
- What Went Wrong
- Lack of positive beta tilt despite signals (LPs are familiar with these conversations)
- In late December and early January, I saw behavioral and positioning signals that led us to run net long
- My personal sweet spot is large cap GARP, high growth software, and SMID cap profitable consumer companies
- I felt large cap tech, while unoriginal, offered solid NT estimate revision opportunity and downside protection on both a ST and LT basis
- Post the SVB collapse in March, I remarked that linear thinking around rates should lead one to get very long tech again, but I did not listen to my own advice
- Excessive bearishness on market “fair value” (rates/inflation driven during January and February and caution around forward estimates given a mosaic of weak consumer and enterprise spending data in March) held me back from allocating towards businesses I like at attractive LT IRRs and on a ST R/R basis
- My main takeaway was I gave too much credence to macro and top-down data during the quarter
- I was largely ignorant of net global QE (BOJ, RRP, and TGA) in both January and March
- I overmanaged and sold a basket of beaten up tech names too early despite liking the LT stories, entry points, and positive estimate revision potential ([[CRM]] and [[AMZN]] are particularly painful in retrospect)
- What Went Right
- Our batting percentage was strong in both our long and short books at approximately 0.75 and 0.6, respectively
- Our batting average in our long book was a function of our large cap tech and growth factor trades in January while our short book was driven more by idiosyncratic earnings success and timing of covering after the SVB failure
- We largely avoided a melt up in speculative, growth names in our short book in January
- See more on our shorting risk management below
- 90% of our shorts in the quarter had a beta >1; the average beta for a short in our portfolio in Q1 was slightly above 1.5
- We traded our negative net exposure well, covering the vast majority of our single stock short book on Friday, March 10 th and the remainder on Monday, March 13 th
- I generally look at VIX >30 and a backwardated curve as a reason to take up net; additionally, my thinking at the time was that it did not make sense to take aggressive net short exposure into a possible weekend rescue plan
Turning to more details on the quarter, during the first few days of the quarter we positioned net long via a basket of beaten-up tech names. On the behavioral side, I saw abnormally bearish comments from investors at funds that typically run very net long; this was supported by positioning data. Additionally, multiples and estimates were not demanding specifically in value and large cap GARPy names that already could be valued on FCF or traded well below pre-COVID multiples. The top contributors to this quarter’s long performance were [[CRM]], [[CRWD]], [[ZM]], [[SNOW]], [[BILL]], [[AMZN]], [[MSFT]], and [[ESTC]]. I did not let this basket run much and we missed most of this quarter’s gains in [[CRM]], [[CRWD]], [[MSFT]], and [[AMZN]].
For the rest of the quarter, we mostly ran a negative net. The lack of positive beta tilt stemmed from strong consumer alt data in January and early February as well as wage growth and quit rates in the services sector accelerating (partners have the slides to both our February and early March presentations). Given the upside risks to core inflation and what rates were pricing in during the quarter, I thought risk/reward was weighted heavily to the downside several times. We played this mostly through two specific themes (below) and a handful of idiosyncratic ideas:
- Shorting “tier 2” high growth software names where multiples had run up above LT averages
- Specifically, we were short two open-source companies where I believed the company beat in the prior quarter due to a pull forward and revenue recognition benefit of multi-year licenses; here we got both the negative sector and factor exposure with solid ST fundamental catalysts
- Shorting long cycle, housing adjacent (i.e. companies with revenue highly correlated to home sales) consumer companies where we saw significant downside to estimates
Our short book performance was driven by [[HCP]], [[SPT]], [[NKE]], [[CROX]], [[BOX]], [[CFLT]], [[RH]], [[HIMS]], [[VRT]], [[GOOS]], [[SNAP]], [[ETSY]], [[HUBS]], [[VZIO]], and [[FIGS]]. The top detractors to our short book performance were [[SHOP]], [[ZG]], [[META]], [[ULTA]], [[TPX]], and [[LTH]].
I would also like to point out a few of our guardrails for shorting. As a reminder, Sandbrook’s goal is to generate absolute returns. Our short book is focused on adding absolute returns to the portfolio when we see mispriced near term catalysts; there will likely be quarters in the future where we do not short at all. To limit risk to our book when shorting, I operate with the following rules:
- No short position is greater than 3% at outset
- I will generally cut a position at a 20% loss
- Average Daily Volume >$30mn
- I manage the fund to be scalable despite our (lack of) size. However, in the quarter we took advantage of 1 opportunity on the short side at <$5mn ADV where the stock had run into earnings, and it seemed obvious the market was ignoring alt data, competitor commentary, and was the only name in the subsector where estimates had not been revised down yet. This led to a miss and poor guide. We were short several other sub $30mn ADV shorts in the quarter
- <15% Short Interest
- Avoid stocks with cult shareholder bases or very passionate/emotional/battleground bull/bear debates
- Don’t short on valuation; only on clear downside to ST numbers and/or current narrative
To further illustrate our process around shorting, I’ve included the work on a short we covered at a loss during the quarter.
Sonos Short
Sonos ( SONO ) began as one of the largest longs at my last shop. We entered the position in September 2020 and exited the majority of the position in Q4 2021.
The high level long thesis at the time was that Sonos’ lumpy growth, low margins, and one time nature of its purchases coupled with loss-leader big tech competition was incorrect. Instead, the company’s focus on premium home theatre (where it faced no big tech competition) and seamless and easy connection of its devices afforded the company a long runway to grow its installed base in high-income US households and cross sell complimentary audio products at much higher incremental EBITDA margins. In addition, new product refreshes with higher ASPs and a focus on the home would be a tailwind during COVID as consumers looked to trade up their home audio experience. In addition, short term supply chain issues affecting margins and ability to deliver product weighed on sentiment as short interest was 8% at the time and sell side ratings were unfavorable.
The LT Return Faming was simple:
- Base20 Component
o The top line growth calculus for a 20% IRR at a 16x FCF exit multiple, was simple at 1.8mn new households per year (reaching 15% of all US households in FY25 from 9% in FY20) and $70 of spend annually per existing household; GMs would increase LT as trade war and supply chain issues abated; and, EBITDA/FCF margins could reach the low teens on G&A leverage and an increasing base of existing household sales leading to Sales & Marketing leverage
-
- Sonos’ hardware business revenue growth visibility and durability was underappreciated with ~ 40% of product registrations every year coming from existing households
- COVID tailwinds around focus on the home would lead to higher product expansion in the out years
- Plus Component
- Sonos’ Patents
- The company’s legal fight against GOOGL was its first foray into monetizing its IP and could produce DLB-like royalty revenue, margins, and multiple on this business line which was significant given ~80mn big tech speakers sold annually
Transitioning to Sandbrook, I took a 3% short position in the company a little over $18/share during 1Q given a negative view on the Q2 and FY revenue and EBITDA guides. Specifically, street was mismodeling the unit comps in Q2 and on a FY basis, idiosyncratic headwinds concerning margins (unusual discounting, high inventory levels, and OpEx deleverage), and there were obvious ASP headwinds. Furthermore, the company’s CFO departed for a private company right before the company’s large holiday quarter. The new CFO is also the company’s Chief Legal Officer.
The high level numbers to the thesis were:
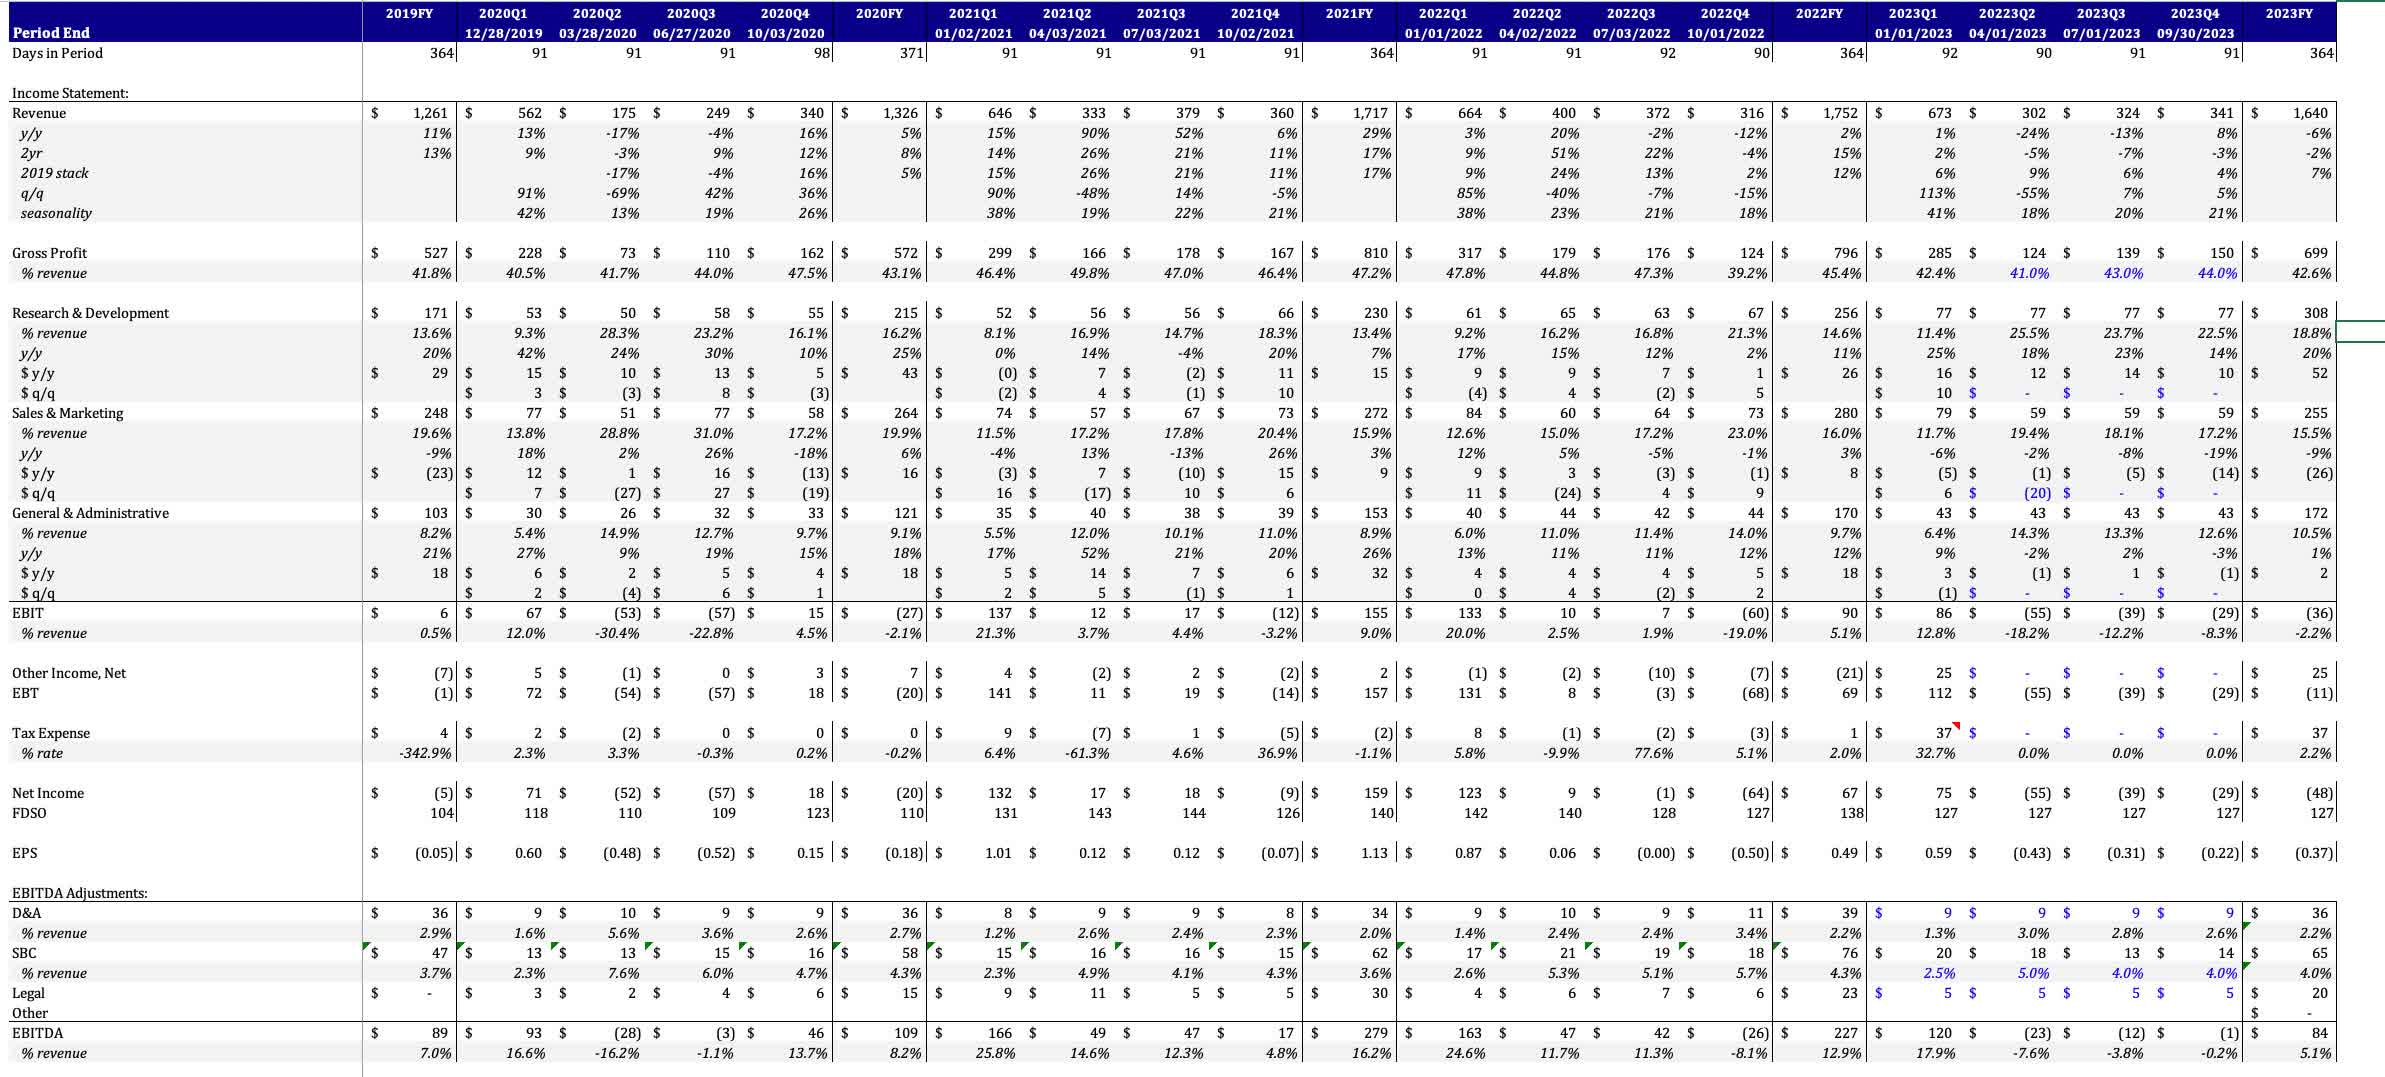
- A 2Q guidance miss (revenue $300-$305mn vs street at $377; EBITDA -$23mn vs street +$27mn) and guide down for the FY (revenue $1.64bn vs $1.75bn; EBITDA $84mn vs street $160mn) would send the stock into the low teens as investors questioned how big the pandemic pull forward was, the duration of the gulley, and whether the company’s new product launches were big enough to drive LT growth therefore reigniting pre-COVID bear narratives and a corresponding multiple
- Traditionally, the company only discounts its entry-level One speaker during the holiday shopping season. However, during C4Q22, the company discounted their high end home theatre soundbars, subwoofers, and speakers 20%. I believed this would put GMs in the high 30s vs street at 45% (actuals were 42.4% driven by said promotional activity).
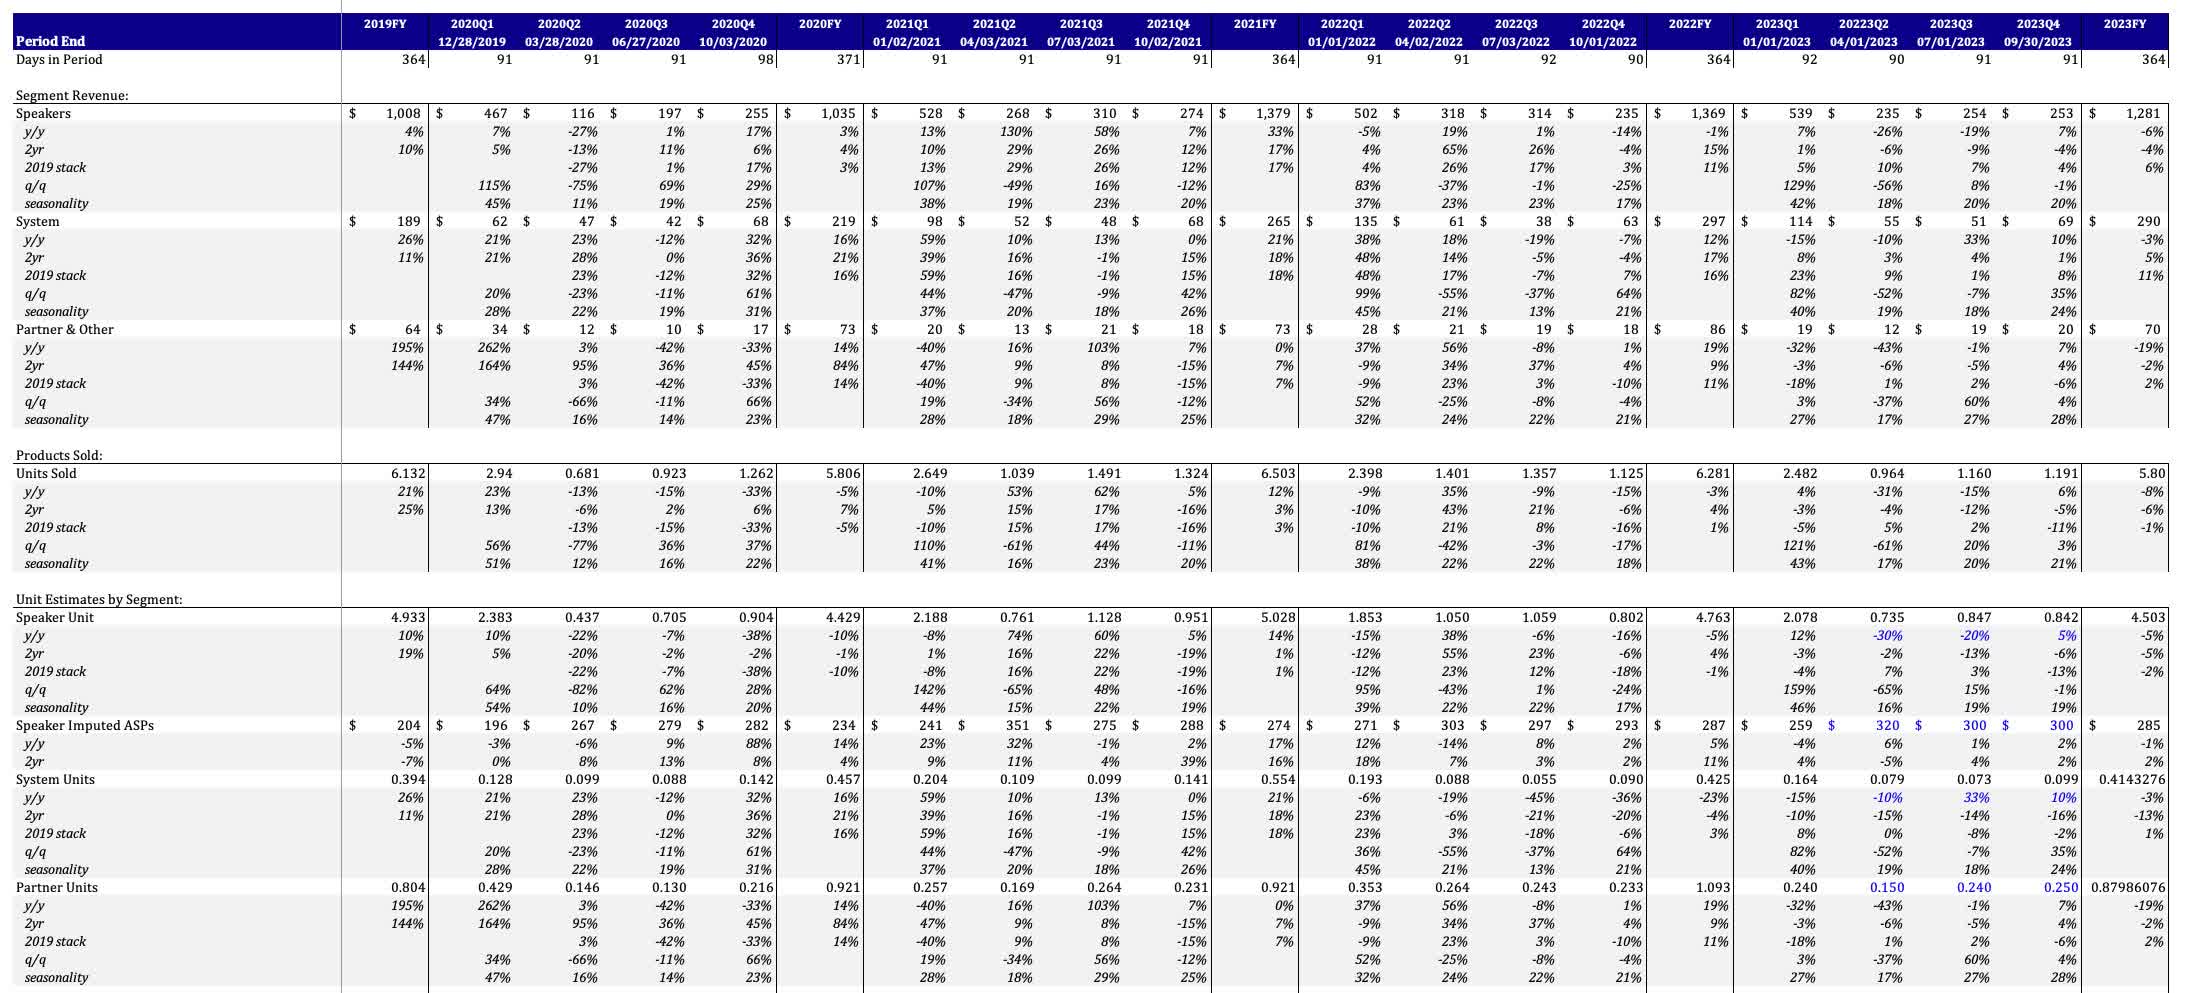
I arrived at my estimates for Q2 and the FY through a bottom up build of the various segments. Sonos provides units sold per quarter as well as revenue for its Speaker, System, and Partner & Other business lines. When backing out ASPs for Sonos’ System products (where ASPs and mix is relatively constant given this is mostly professional installer demand) and Partner & Other lines, you can get a rough estimate of Sonos’ Speaker Units and ASPs. Given y/y, 2yr, and preCOVID stacked unit sales for the Speaker line, I estimate fiscal Q2 speaker units come in at ~735k units vs my rough math of ~600k in FY18 and FY19, 450k in the COVID quarter (March 2020 ending), 750k in FY21, and 1.05mn in FY22. I believed the company was backfilling the channel throughout FY21 and 1H FY22 which created difficult unit comps specifically in 2QFY23. In addition, Sonos was lapping price increases this fiscal Q1, which provided no tailwind to ASPs or margins. Speaker ASPs also faced a headwind from mix of newer product introductions such as the Roam, Ray, and Sub Mini which are offered at a lower price than Sonos’ flagship products (the company’s premium AMP @ $699 and Arc @ $899 were a higher share of mix during ‘20-’21). I saw a similar unit and revenue story playing out in the Systems segment. Units of 80k in 2QFY23 will be ahead of the ~70k pre COVID but below the 90-110k level during the following 3 years.
The biggest risk was a 1Q beat which I had in my model (also, since the company was just starting its federal GOOGL trial in May, there was little ST convexity risk to an IP announcement). The alt data on Sonos called for a 1Q beat but it is noisy given the company’s higher mix of channel sales where sell through is captured by Google Analytics accounts of distributors and BBY where share of spend is captured by email receipt data which is not indicative of Sonos sell-in. My numbers for Q1 revenue were ahead of street ($625-$635mn vs actual $678mn vs street at $578mn) reflecting easy 1yr and 2yr comps in the Speakers segment. The revenue beat vs my numbers was a $30mn beat in System revenue (these are components popular with installers that allow a customer to connect other speakers into the Sonos app/system).
The stock performed well on this 1Q revenue and EBITDA beat accompanied by unrevised FY guidance. Other positive highlights included a strong selldown of inventory, strong performance of bundled sets, stable OpEx growth going forward, no air freight costs, and a new category entry this year. While no formal 2Q guidance was provided, the new CFO gave rough guidance for 2Q revenue down 50-60% q/q on more normalized seasonality. As of mid-April, the street is currently at $297mn in revenue for 2Q. I felt comfortable holding the short as I continued to believe that FY estimates on revenue and EBITDA remained too high and consumer discretionary broadly remained a good place to have negative net exposure.
I covered the short at a loss on March 10 th in conjunction with most the fund’s other single name shorts. Below is the supporting model:
Sonos Segment Drivers
Sonos Income Statement
Current Outlook
As is our stated goal, the fund will swing at attractive risk/reward across beta, factor, sector, and idiosyncratic bets when presented with compelling opportunities.
Sandbrook is not going to beat anyone with a data advantage, but we can use our flexible net mandate and systemized process to swing only at fat pitches (this includes using data to understand positioning and using factor flexibility to take advantage of other’s degrossing). I self-fund our entire research budget (another belief of mine is that the GP should take some risk in running an investment business – the only line items expensed to LPs are audit and admin costs) and being a small firm means I have to get scrappy to get certain data sources; I feel we have what is required from a data and research tool perspective to compete in shorter time horizon games in the competitive software, consumer, and internet sector.
Our portfolio strategy as of mid April remains focused on short term Opportunistic Longs and Catalyst Based Shorts. As I wrote in the last letter, when we feel we are given a fat pitch to load up on our Core Longs, the average idea underwriting duration and net exposure of the portfolio will drastically increase. Until then, I remain focused on delivering positive returns and swinging at attractive risk/reward across beta, factor, sector, and idiosyncratic bets. I do not feel compelled to chase rallies if the risk/reward is not favorable – even if it comes at the expense of short-term index underperformance.
As I look across my coverage, I see a very few attractive LT IRRs and the fund will remain patient for attractive underwriting of Core Longs. I’m cautious on a 2H acceleration given weak consumer card data across various banks and alt data panels (to be seen if seasonal factors drove the March slowdown). In our core focus areas of consumer and software, estimates for a 2H acceleration look aspirational.
Finally, although our beta-adjusted performance was fine during the quarter, I realize the product I offer the market is our return stream, and the competition and opportunity cost for an active equity strategy is extremely high. Sandbrook will have quarters where we underperform. I am not attempting to run a particularly tactical fund that sloshes around our net and factor exposure on a whim. However, in the current environment, the volatility of inputs (security prices, rates, data, and deltas to estimates) that effects the output of my process (ST risk/reward and LT IRRs) presents a compelling opportunity for active management.
To summarize, with Sandbrook I aim to accomplish several things:
- Run external money how I would run my own; that is, net long over the cycle, focused on growth, risk/reward aware, and to only get paid only for alpha I generate
- Our 10% hurdle is meant to roughly account for the >1 beta of our names and our expected ~70% net long position over the cycle
- Invest in growth equities in the consumer and tech sectors
- I actively enjoy and have fun doing work on these companies and sectors
- I’ve spent hundreds of hours learning Golang, Java, and Javascript making sure I have the technical chops to compete in software (specifically infrastructure software)
- Employ a macro and factor awareness to avoid the downside and Texas hedging (we don’t get long the future and short the past and I generally do not pair trade ideas for spread) that come from implicit or explicit sector and factor concentration
Sincerely,
Joey Brookhart
Editor's Note: The summary bullets for this article were chosen by Seeking Alpha editors.
For further details see:
Sandbrook Capital Q1 2023 Partners Letter