TLT - September CPI: A Complicated Situation
2023-10-12 10:50:56 ET
Summary
- The Consumer Price Index, or CPI, report for September 2023 was published.
- Core CPI was slightly higher than expected. Core services ex-Housing continues to run too hot. However, prices of core goods are deflating quite broadly and intensely.
- Based on the mixed data, the Fed may need to maintain a hawkish policy and communications.
The Consumer Price Index ((CPI)) Report was published on October 12, 2023, at 8:30 AM. The report contains information about changes in the prices (inflation/deflation) of a wide array of goods and services purchased by consumers in the U.S. during the month of September 2023.
In this report, we will walk readers through a detailed analysis of the CPI report. We will also discuss the likely implications of the reported data for the U.S. economy and financial markets.
Summary Data and Analysis
A summary of key data and analysis for this month's CPI report is provided in Figure 1.
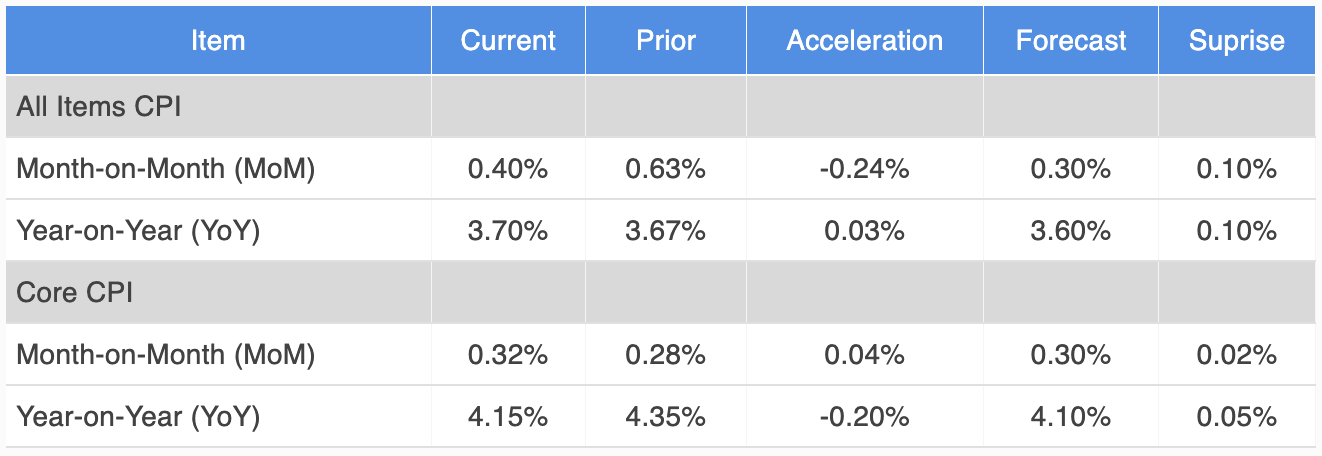
Figure 1: Change, Acceleration, Expectations, and Surprise
Core & All Items CPI (BLS, Investor Acumen)
All Items CPI surprised to the upside, although it decelerated relative to last month. Core CPI was slightly higher than expectations, accelerating slightly compared to last month.
Price Changes in Major CPI Components Over Various Time Frames
In this section we focus on the growth rates of major CPI components over various time frames. Readers should observe the acceleration and/or deceleration of growth rates over time, the relative growth rates between components and the growth rates of each component compared to its own history (percent rank).
Figure 2: Percent Change, Annualized Change and Percent Rank: 1, 3 and 12 months
Annualized Inflation Over the Past 12 Months (BLS, Investor Acumen)
In the table above, you can see some major divergences. If you focus in on core services ex-housing -- the metric the Fed is watching most closely -- you will see a worrisome trend towards acceleration in the last 3-month and 1-month periods. Furthermore, the rate of inflation reflected in this metric is very high by historical standards. However, if you focus on core goods, there has been a pretty dramatic trend towards deflation, with price changes in this category at the extreme lower end of historical averages.
Decomposition Analysis of Monthly Change: Major CPI Components
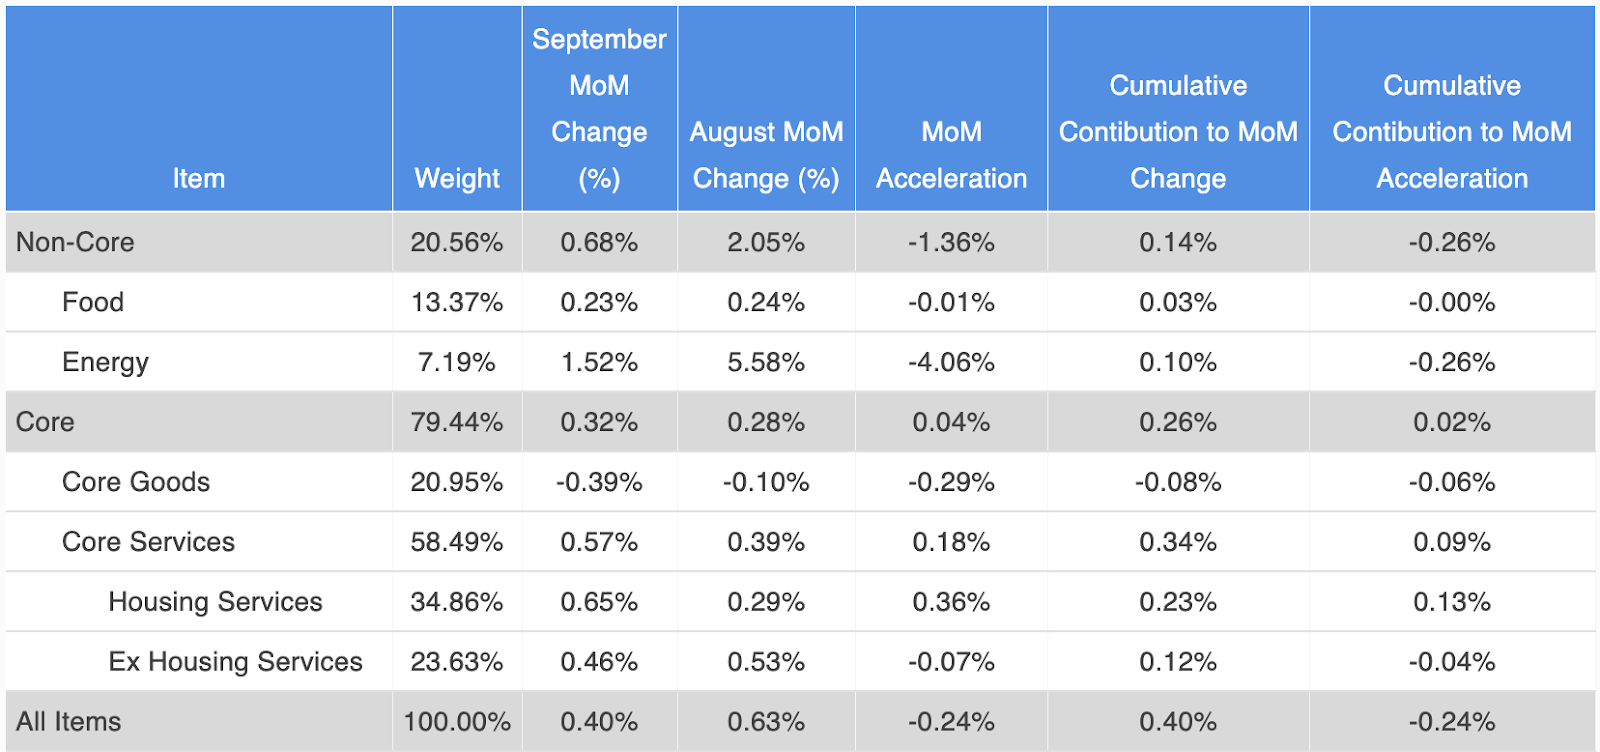
In Figure 3, we perform a decomposition analysis of change and acceleration, breaking CPI down into Non-Core and Core components. We further decompose the growth of non-core CPI into two subcomponents and decompose the growth of core CPI into three subcomponents. Although all five columns in the table provide important information, we recommend that readers pay special attention to the rightmost column (Cumulative Contribution to Acceleration) as it reveals exactly what drove the MoM acceleration/deceleration in CPI during the current month compared to the prior month.
Figure 3: Analysis of Key Aggregate Components of CPI
Aggregate CPI Component Analysis (BLS, Investor Acumen)
As can be seen in the table, Energy was by far the largest contributor to the deceleration of All Items CPI. While Core accelerated slightly primarily due to a large acceleration in Housing Services.
Core Services except Housing - the indicator the Fed is currently paying most attention to - decelerated slightly last month, but continues to run uncomfortably hot at a MoM rate of 0.46%.
We now proceed to analyze the CPI report in even greater depth. For more detailed information on how to read and interpret the tables and graphs in this article, please see the following Seeking Alpha blog post .
Contributions to Monthly Change in Core CPI
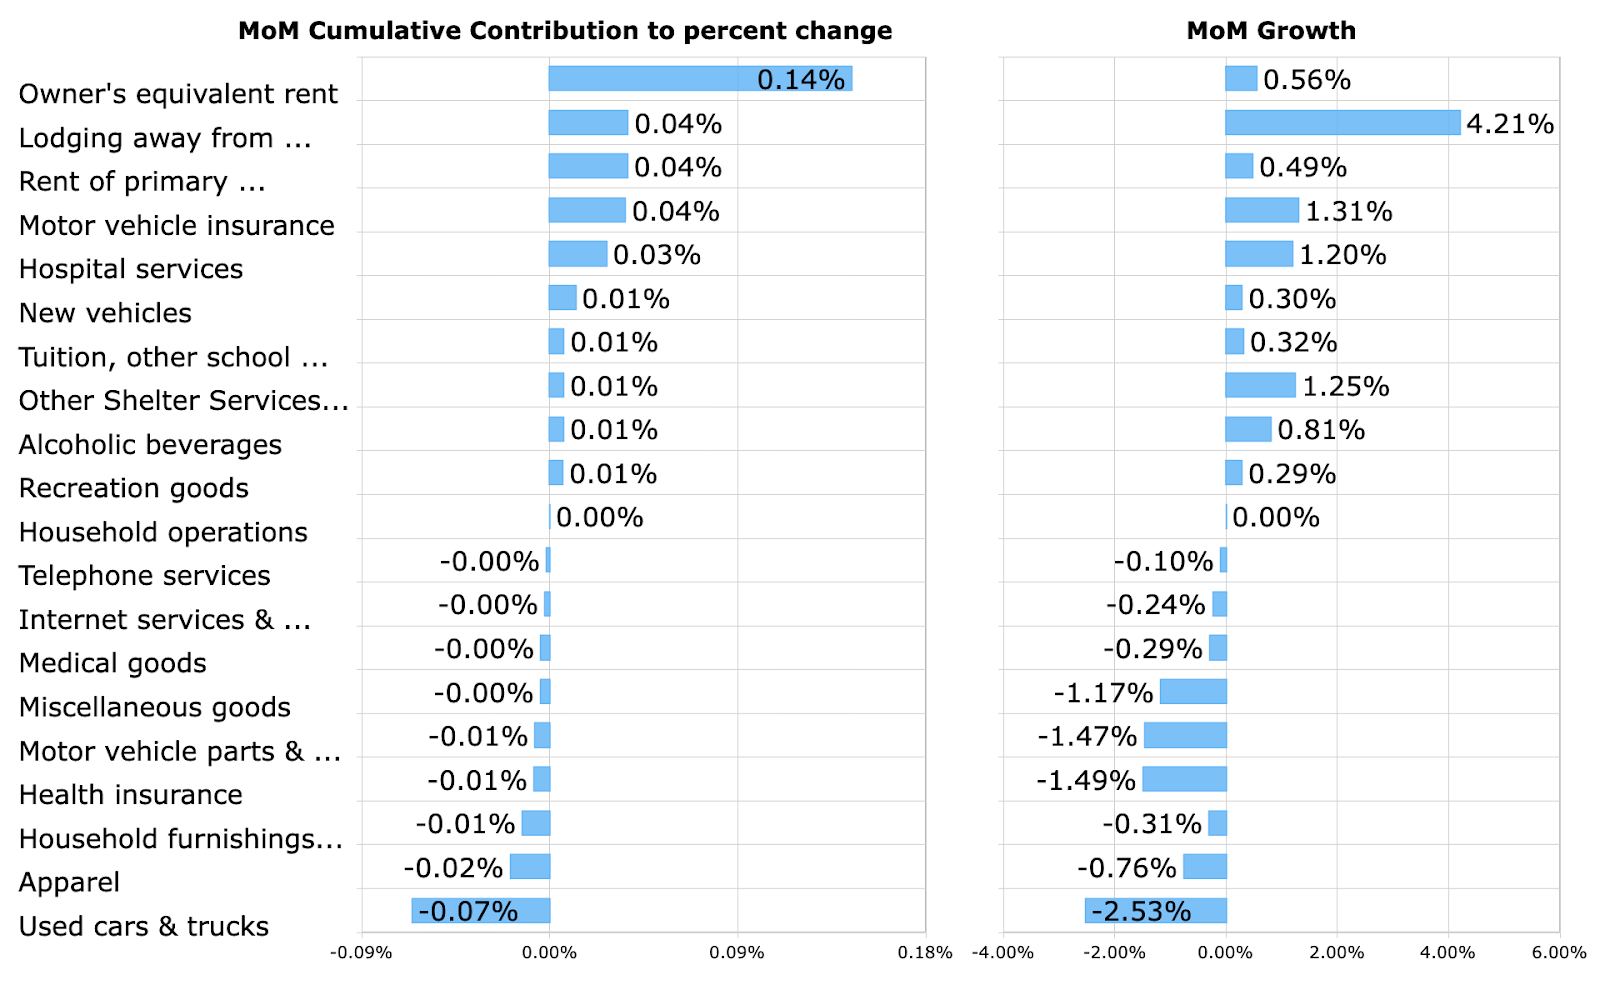
In Figure 4, we dig deeper down into the data and present a bar chart that highlights notable positive and negative contributors to the MoM percent change in Core CPI. These contributions take into account both the magnitude of the MoM change in each component as well as the weight of each component in CPI.
Figure 4: Top Contributors to MoM Percent Change
Top CPI Contributors (BLS, Investor Acumen)
Once again, the Owner's Equivalent Rent was the most important positive contributor to the monthly change in CPI. And again, Used Cars & Trucks -- a highly volatile item - contributed negatively to the monthly change in CPI.
Real-time indicators suggest that the deflationary trend in the used car market may at least pause in the next few months, which would eliminate this particular drag on core CPI.
Housing components have the largest weight in the CPI (accounting for about 40% of core CPI). It's important to note that real-time indicators suggest that these items will contribute significant disinflation in CPI for most of the remainder of 2023 and through much of 2024.
Contributions to Monthly Acceleration in Core CPI
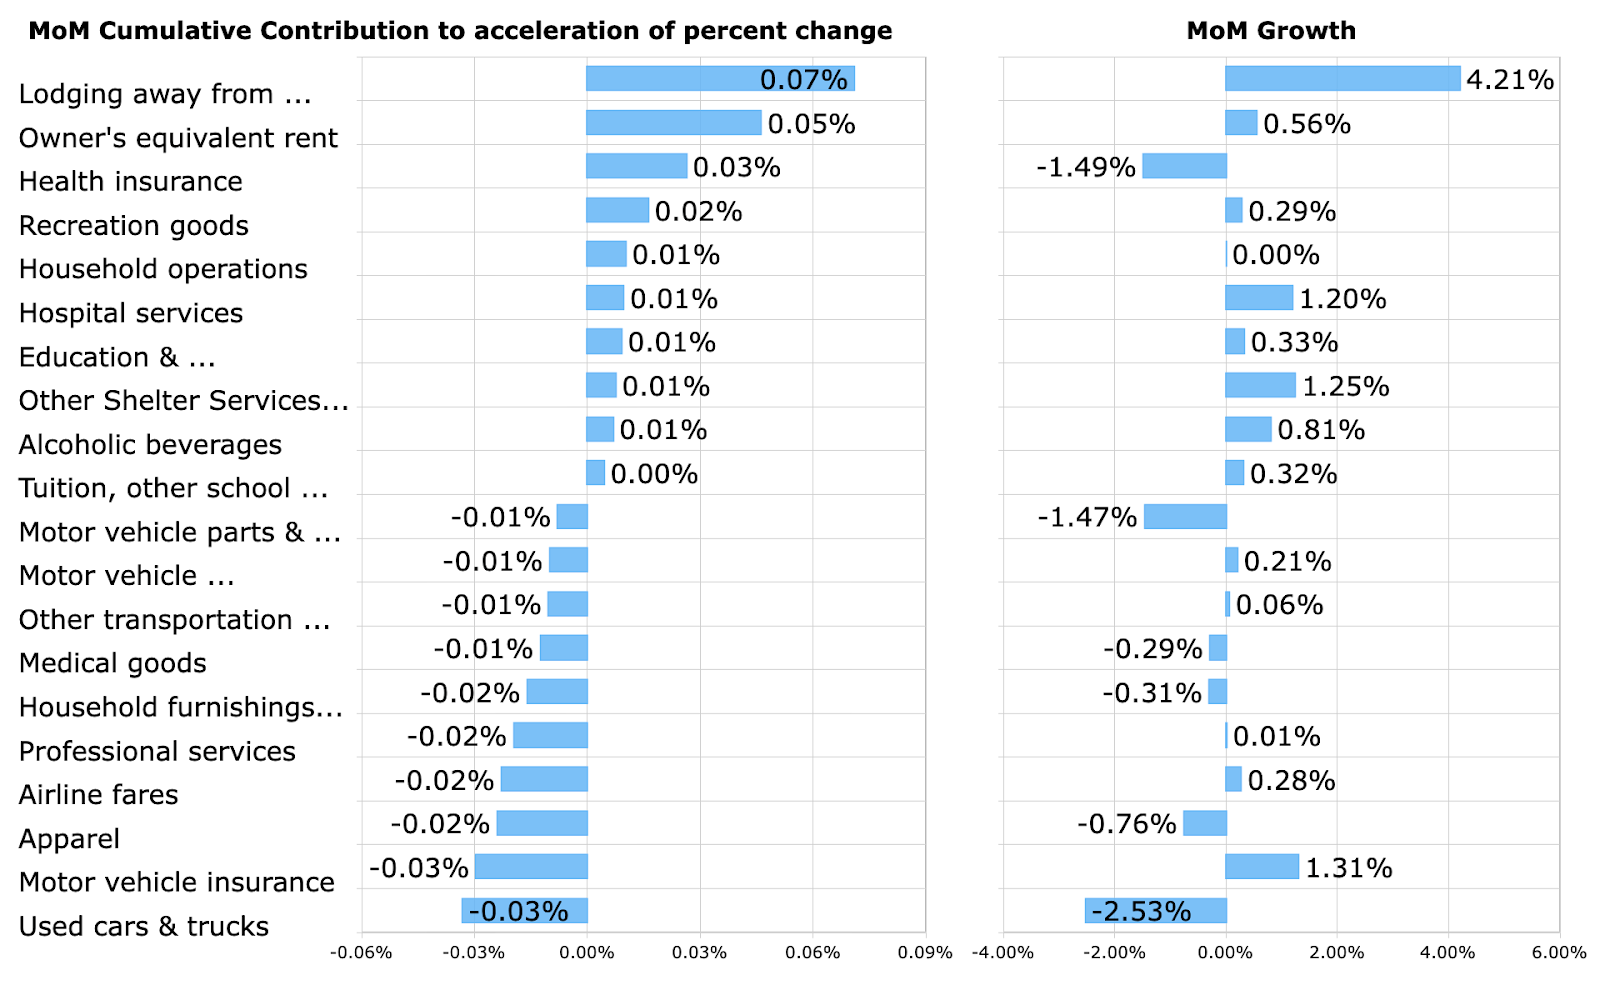
In Figure 5, we shift the focus from a decomposition of the rate of change, to a decomposition of the rate of acceleration. The bar chart highlights notable positive and negative contributors to the MoM acceleration in Core CPI. These contributions take into account both the magnitude of the MoM accelerations in the components as well as the weight of each component in CPI.
Figure 5: Top Contributors to MoM Acceleration
Top CPI Acceleration Contributors (BLS, Investor Acumen)
We recommend that readers examine this table carefully as it is likely to include most or all of the items that caused deviations from forecasters' expectations of Core CPI.
Lodging Away from Home was notably the largest individual positive contributor to the acceleration in Core CPI after being a large contributor to deceleration last month.
On the side of deceleration, Used cars & trucks and Motor vehicle insurance were the most notable contributors.
Top Movers
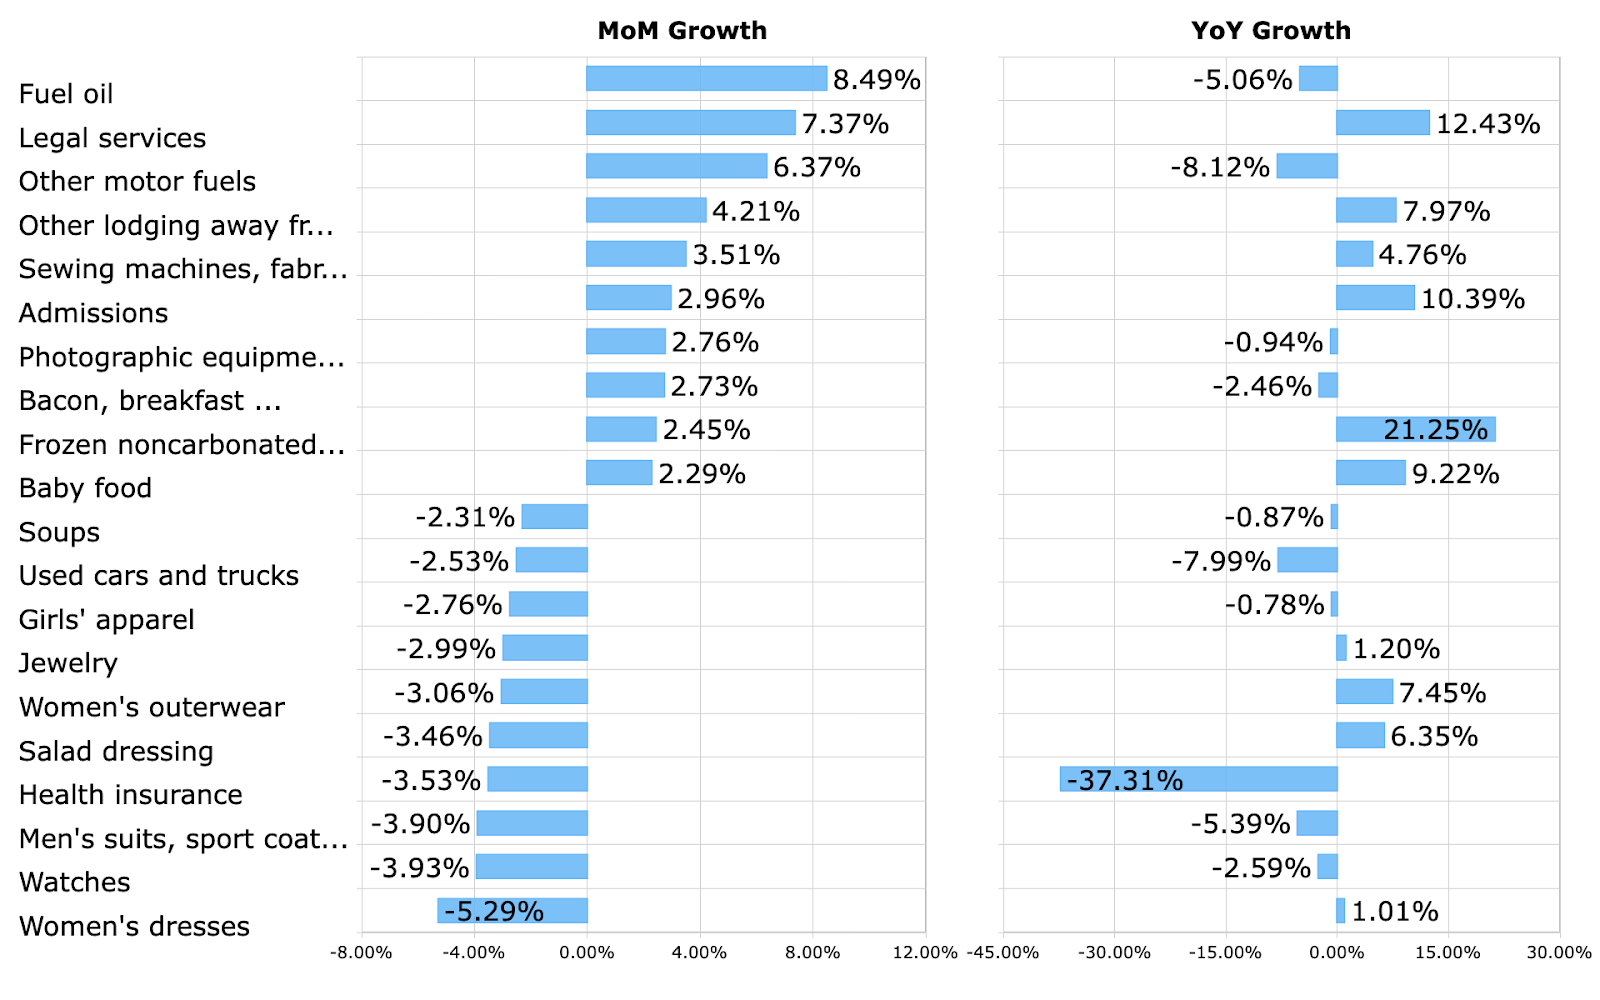
In Figure 6, for general interest purposes, we highlight a few CPI components (out of over 200) that exhibited the largest positive and negative change during the month. The YoY change in these particular components is displayed to the right.
Figure 6: Top Movers MoM Percent Change
Top CPI Movers (BLS, Investor Acumen)
Rising gasoline prices and motor fuels showed notable rises in the September report. Various Apparel items such as Women's dresses, Watches and Men's suits showed larges MoM declines. Health insurance also had a notable fall again this month.
Implications for the Economy
There was some good news and bad news in this report, from a macroeconomic point of view.
Let's start with the good news. First, and foremost, even though Core CPI was slightly higher than expected, this was mostly due to the impact of the housing components of CPI. This is good news because the housing components of CPI are lagged by 6-12 months, and in real time, housing rents are actually decelerating significantly. If you exclude the effects of the lagged acceleration from housing this month, core CPI would have been below 0.2%.
The second piece of good news is found in the broad based-disinflation and deflation in core goods. The downward momentum and breadth in this cyclically sensitive and important category is quite impressive.
However, despite the good news items above, there are some things that the Fed will be concerned about. First, and foremost, Core Services, ex Housing - the metric that the Fed is watching most closely - came in hot again this month, for the second consecutive month. This metric was up 0.46% in September (5.68% annualized) and is up 4.97% annualized over the course of the past 3 months.
The second problem is that highly volatile items such as used cars, car insurance and airline fares, once again, pushed core CPI down. The negative contributions from these items are not sustainable over time. If you exclude the effects without these volatile items, core CPI would have been over 0.4% for the month rather than 0.3% - and well above the 0.1% to 0.2% range that the Fed would like to see.
A final point that we will add is that the Fed needs to be concerned about rising energy prices. The last time there was a major spike in oil prices (CL1:COM), it triggered a major wave of inflation throughout the economy. The latest PPI report suggests that there are already some cost pressures building up in the pipeline.
Putting all of the above together, our view is that the details of this report were quite mixed. Although there are some things in this report that the Fed will feel relieved about, there is simply not enough here to warrant a softening in Fed policy or communications. We believe that the Fed is going to have to remain cautious, keeping pressure on interest rates and liquidity in the economy. The Fed may indeed temper its hawkish tone somewhat as a result of events in Israel, but not really due to the CPI data.
Implications for Financial Markets
As of the writing of this report, both stocks and bonds had a slight negative reaction. Our view is that the report does not warrant any major change in the inflation outlook which should have a major short-term impact on markets.
From an intermediate-term perspective, this report reinforces the fact that the Fed finds itself in a difficult position. The CPI data will force the Fed to maintain tight monetary policy and relatively hawkish rhetoric. This is potentially problematic going forward because there are increasing signs that the economy could be poised for a significant - and potentially dangerous - deceleration in economic activity. The CPI data do not give the Fed much leeway to be "pre-emptive" regarding any potential weakness in the economy. This raises the risk of recession which, in turn, tends to increase equity risk premiums for common stocks. By contrast, we view this environment as relatively bullish for long-term US Treasury bonds and TIPS in particular.
Conclusion
This CPI report was contained some positive and negative signals. However, the most salient thing about this report is that it does not enable the Fed to act preemptively in the face of a potential severe slowdown in the economy.
We will be looking to capitalize on the possibilities of market downside in coming months.
For further details see:
September CPI: A Complicated Situation