SIX - Six Flags Entertainment: Not Enough To Get The Pulse Racing
2023-09-06 07:15:03 ET
Summary
- Six Flags Entertainment's shares have failed to keep up with the broader market in recent months.
- The company's revenue and attendance have declined, primarily due to higher pricing.
- Financial results for the current fiscal year have been mixed, with higher revenue but worsening profitability metrics.
Although it has been many years since I have last been to a theme park, I do have fond memories of them from when I was younger. And who doesn't like investing in companies that provide goods and services that the person making the investment enjoys? In the theme park space, there are not too many prospects to seriously consider. But of those companies that are considered pure plays in the industry, one that most certainly deserves the attention of investors is Six Flags Entertainment ( SIX ). Over the past several months now, shares of the company have failed to keep up with the broader market. To some investors, this might mean that it's only a matter of time before the trend changes. But after looking at the overall financial health of the business, I would argue that perhaps it would be more likely that shares will continue to meander about for some time.
Mixed results are not encouraging
Back in late November of last year, I wrote an article detailing why I thought that Six Flags Entertainment made a better 'hold' prospect than a 'buy'. At that time, I pointed out that attendance data was weakening and that it may have been caused at least in part by high pricing. I felt as though the long-term picture for the company would be fine. But in the near term, I suggested that it could be painful. I didn't go so far as to say that shares were overvalued. At the end of the day, however, I pointed out that there were better prospects in this space for investors to consider. Since then, I feel as though the market has reflected this belief. From the time I published that article through today, shares have appreciated by only 7.7%. That's only a little better than half the 14.1% rise seen by the S&P 500 over the same window of time.
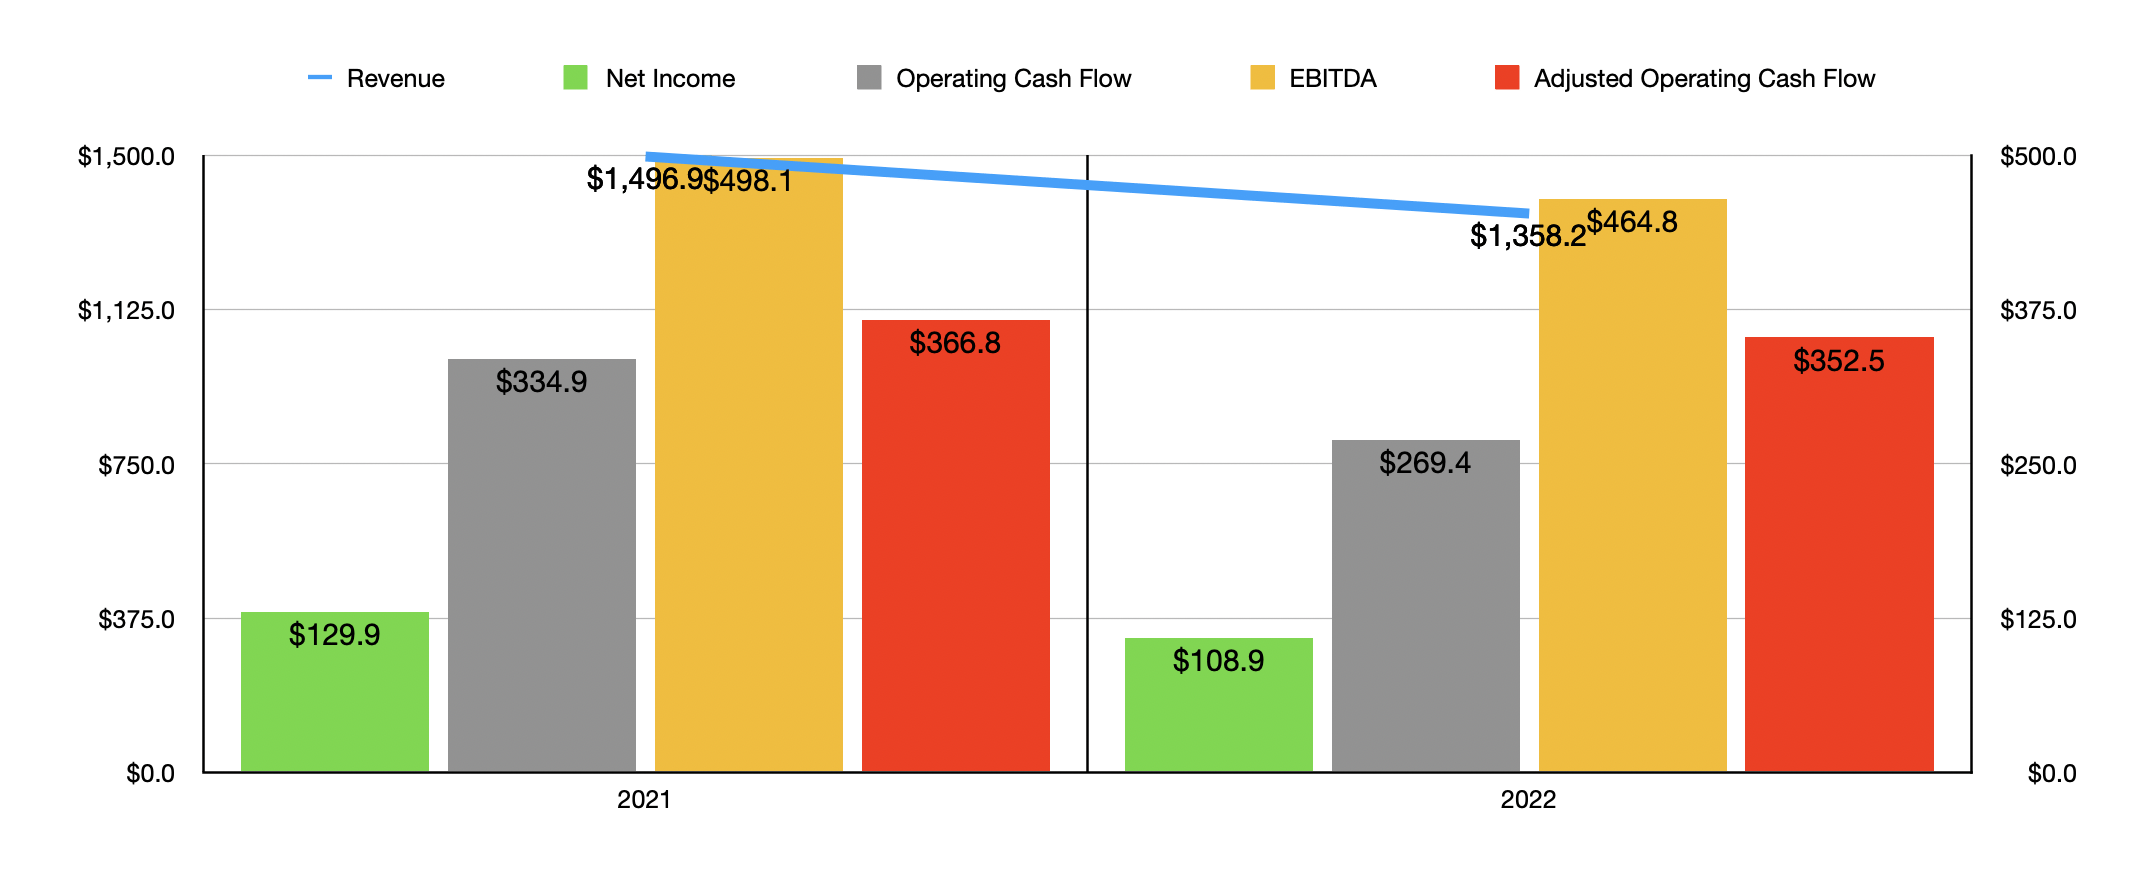
It might be helpful before we touch on more recent data to point out some of the pain that the company ended up going through. In 2022, for instance, revenue totaled $1.36 billion. That represents a decline of 9.3% over the $1.50 billion reported one year earlier. This drop was driven by one factor and one factor alone. And this was attendance. Total visitors at the company's parks came out to 27.69 million during 2021. Attendance plunged to 20.43 million in 2022. Management was very clear about what the troubles the company faced were. For starters, they attributed a good portion of this decline to higher pricing. And sure enough, that checks out. In 2021, the company reported per capita spending of $52.40. That number jumped to $63.93 in 2022. They also said that the elimination of free tickets and heavily discounted product offerings contributed to this pain.
The drop in revenue brought with it a decline in profitability. Net income, for instance, shrank from $129.9 million to $108.9 million. This makes sense when you consider the drop in sales. However, this was not the only profitability metric to worsen. Operating cash flow, as an example, went from $334.9 million to $269.4 million. Even if we adjust for changes in working capital, we would have seen a drop from $366.8 million to $352.5 million. Meanwhile, EBITDA for the theme park operator fell from $498.1 million to $364.8 million. It looks as though the cash flow metrics largely did not worsen to the extent that revenue did. And that's because the increase in pricing meant higher margins for each customer who did attend.
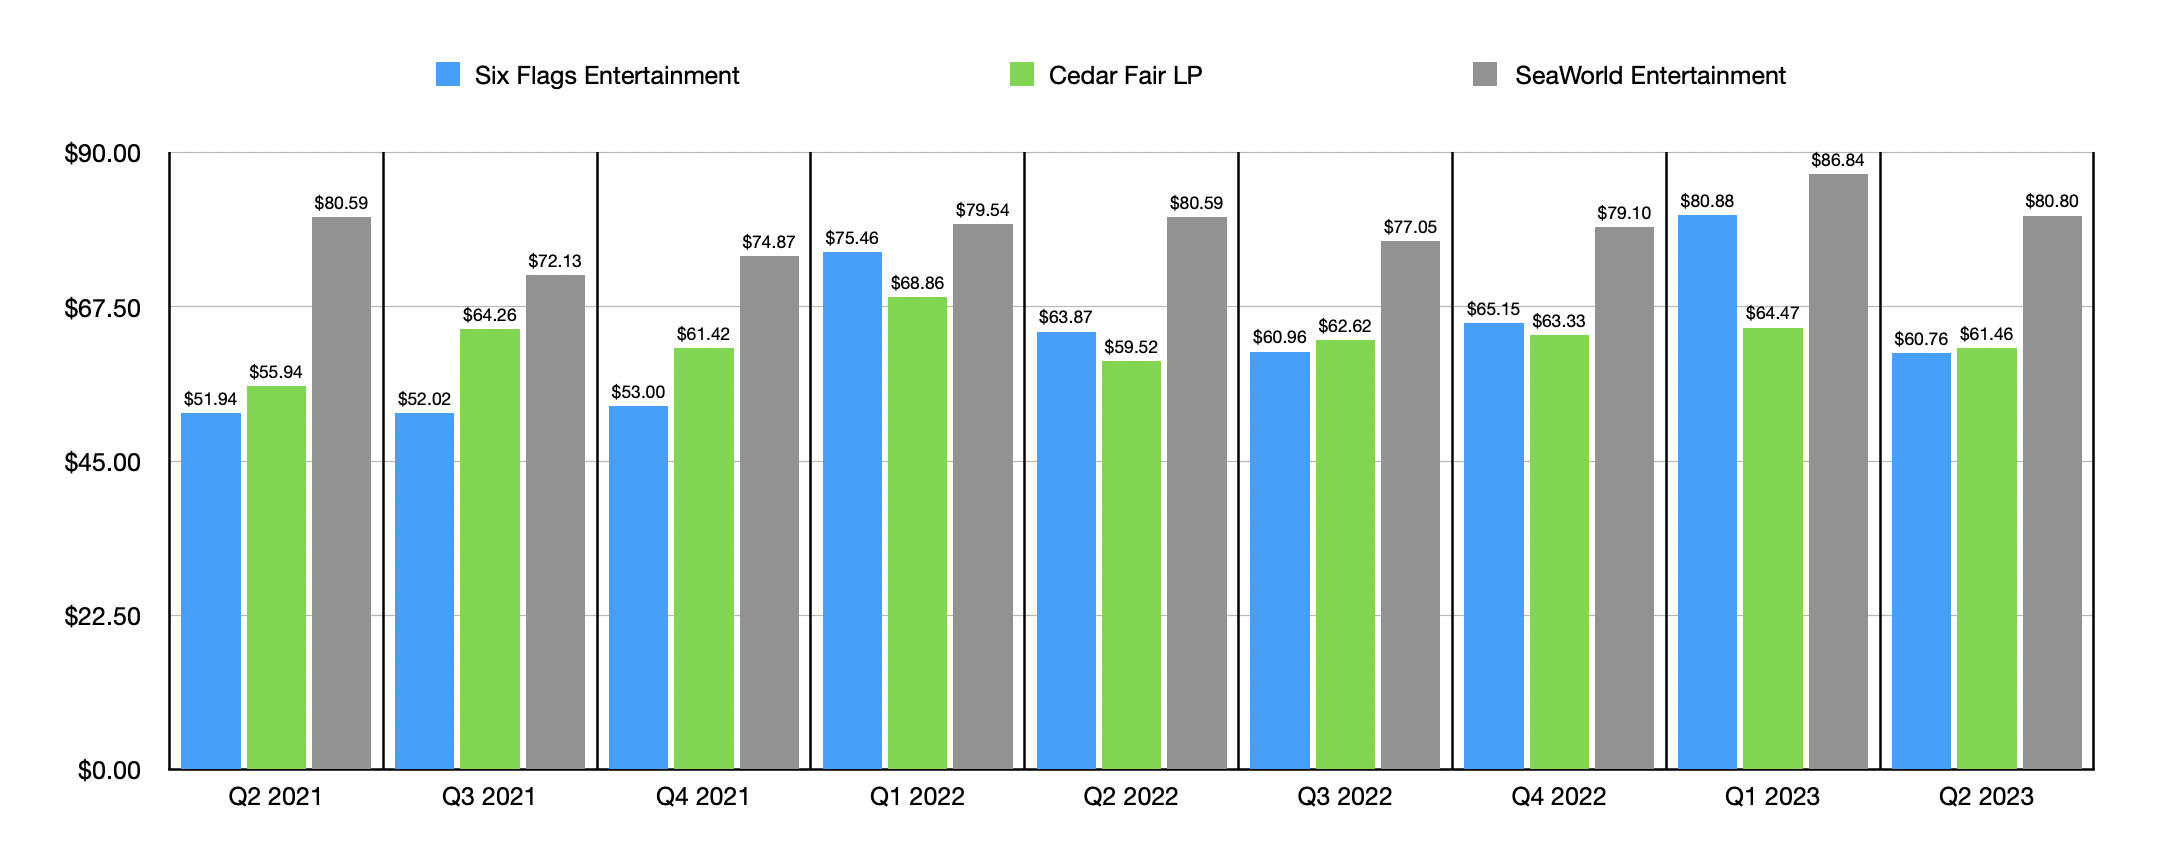
When it comes to the current fiscal year, financial results have been very mixed. For starters, management has learned from their lessons. This year, pricing is definitely lower than it was last year. In the first half of 2022, per capita spending was $66.21. That number for the same time this year is $64.46. In the second quarter alone, per capita spending was $60.76 compared to the $63.87 reported one year earlier. This helped to push attendance figures up. For the first half of this year, the company reported 8.67 million visitors. That represents an increase of 4% over the 8.34 million reported during the same time in 2022.
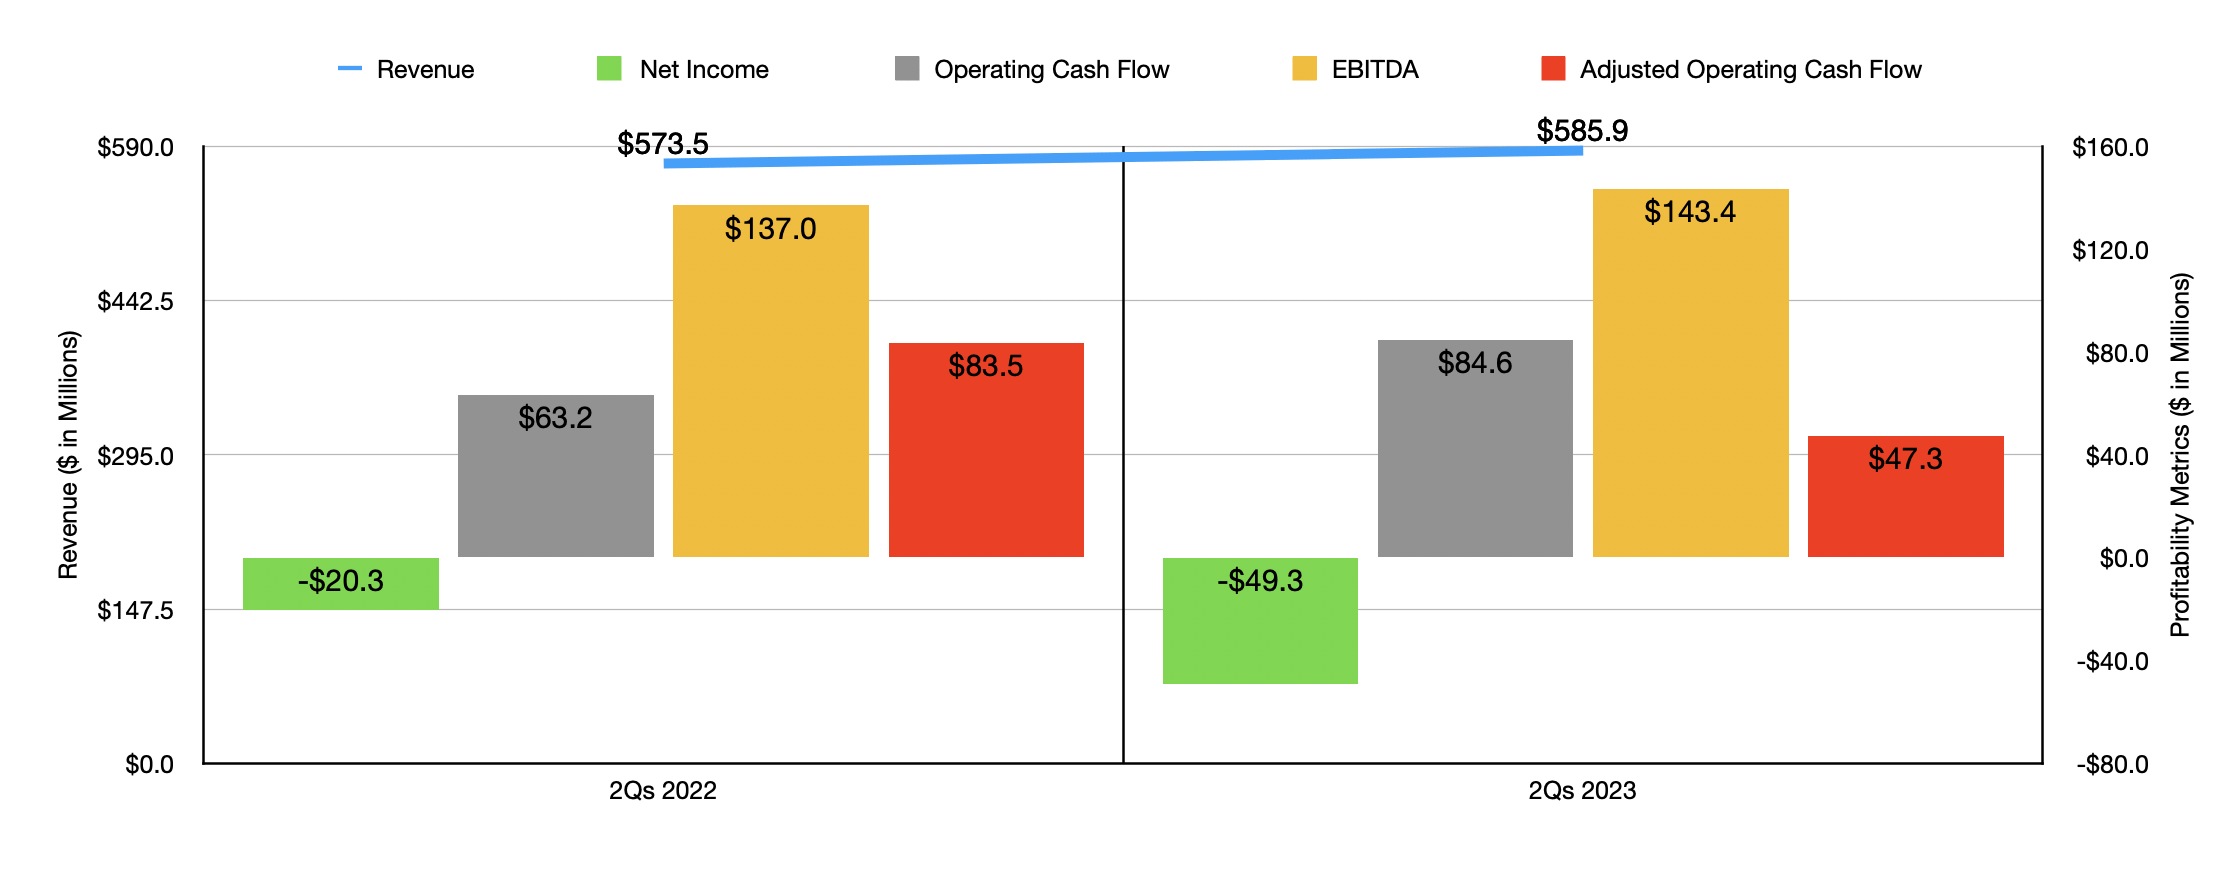
This improvement brought with it higher revenue. Sales of $585.9 million beat out the $573.5 million reported one year earlier. But on the bottom line, the picture is more complicated. The firm went from generating a net loss of $20.3 million in the first half of 2022 to generating a net loss of $49.3 million at the same time this year. However, these results are somewhat deceptive. I say this because of where the cost increases came from. Selling, general, and administrative costs jumped 45% year over year. 89.7% of this increase, or $37.6 million in all, came from self-insurance reserves that the company had to book. However, it didn't stop some of the other profitability metrics for the company from worsening.
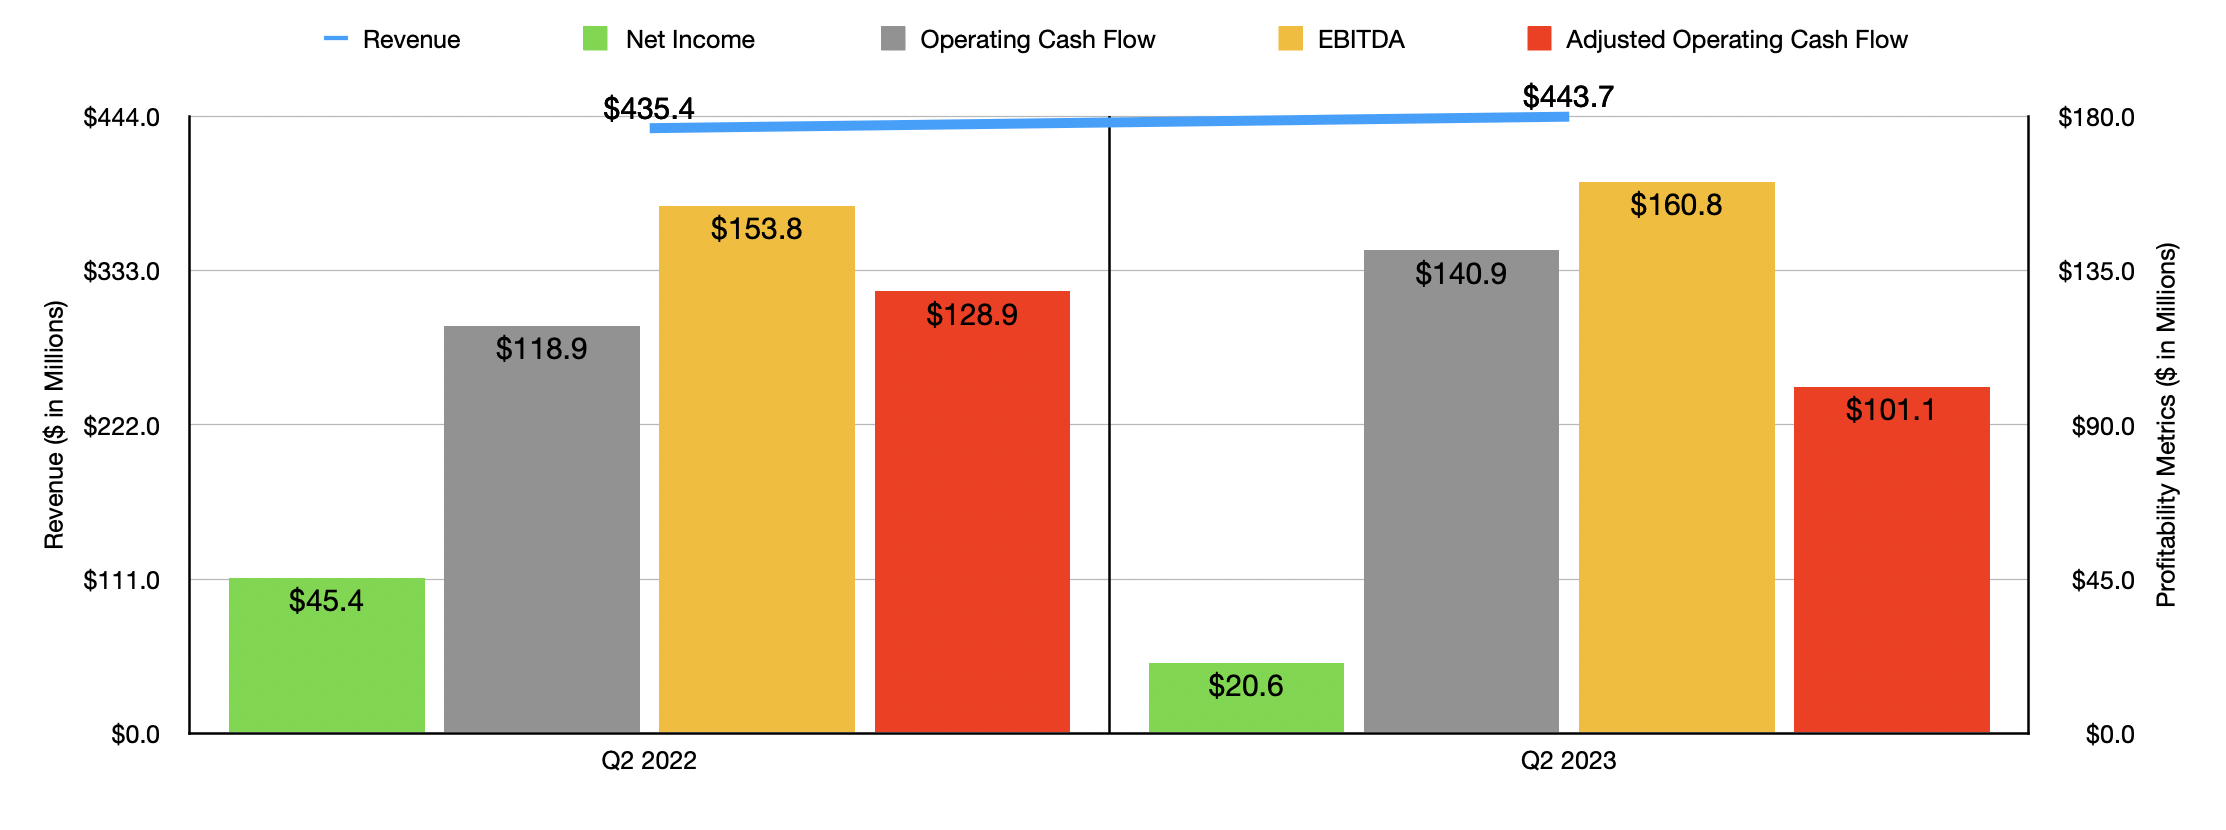
While operating cash flow grew from $63.2 million last year to $84.6 million this year, it did worsen if we adjust for changes in working capital. On that basis, it plunged from $83.5 million to $47.3 million. At the same time, however, EBITDA for the business increased from $137 million to $143.4 million. I don't think any additional detail is required. But in the chart above, you can see financial results covering just the most recent quarter alone. Revenue rose, but profitability metrics were mixed, just as was the case with the first half of the year as a whole.
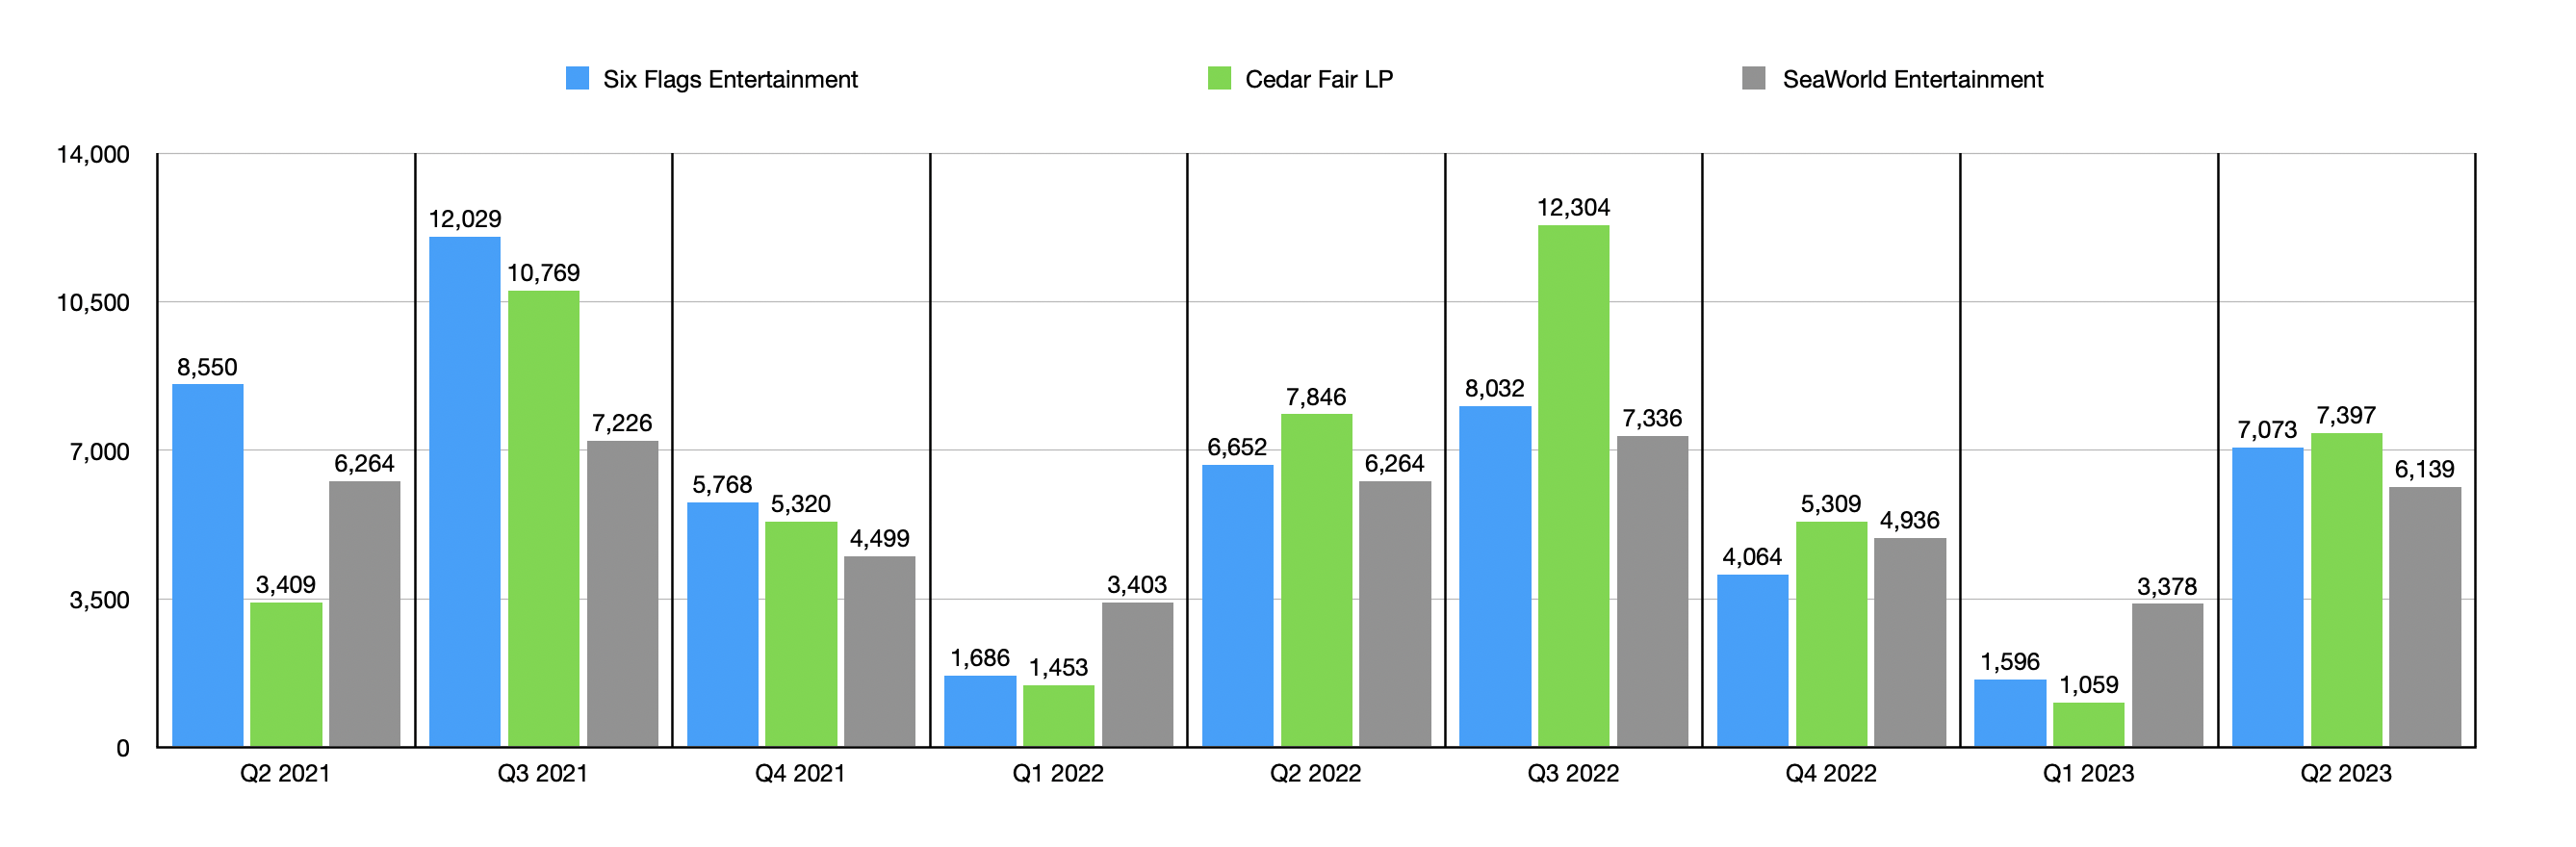
One thing I did do as part of my analysis is to look and see if there were any insights that we could get from comparing pricing and attendance numbers from quarter to quarter when it comes to not only Six Flags Entertainment but also when it comes to Cedar Fair, L.P. ( FUN ) and SeaWorld Entertainment ( SEAS ). In the chart above, you can see quarterly spending for each of the theme park operators. And in the chart below, you can see what attendance figures look like from quarter to quarter. Naturally, Six Flags Entertainment and Cedar Fair are more alike than SeaWorld Entertainment is. So I'm not surprised to see higher pricing from it. You can also see how, at the start of 2022, Six Flags Entertainment did indeed hike its pricing. In the second quarter of that year, when attendance really started to pick up, the company saw an increase relative to the first quarter of 294.5%. But the increase for Cedar Fair, which held pricing down relative to what Six Flags Entertainment hiked it to, saw a jump in attendance of 440%. Year over year, attendance at Six Flags Entertainment was actually down 22.2% while, at Cedar Fair, it was up an impressive 130.2%.
What this tells me is that the two companies very much are substitutes for one another. This is interesting because it means that prospective attendees view the two companies as being more or less interchangeable. This is not positive for any player that has to or decides to hike its prices. And that is because it will ultimately put the firm in a financially inferior position relative to its rifle. SeaWorld is likely more immune to this, given that its attractions are materially different than what you would see at either of the other parks. But I suppose that, if pricing there rose enough, you would see some weakness.
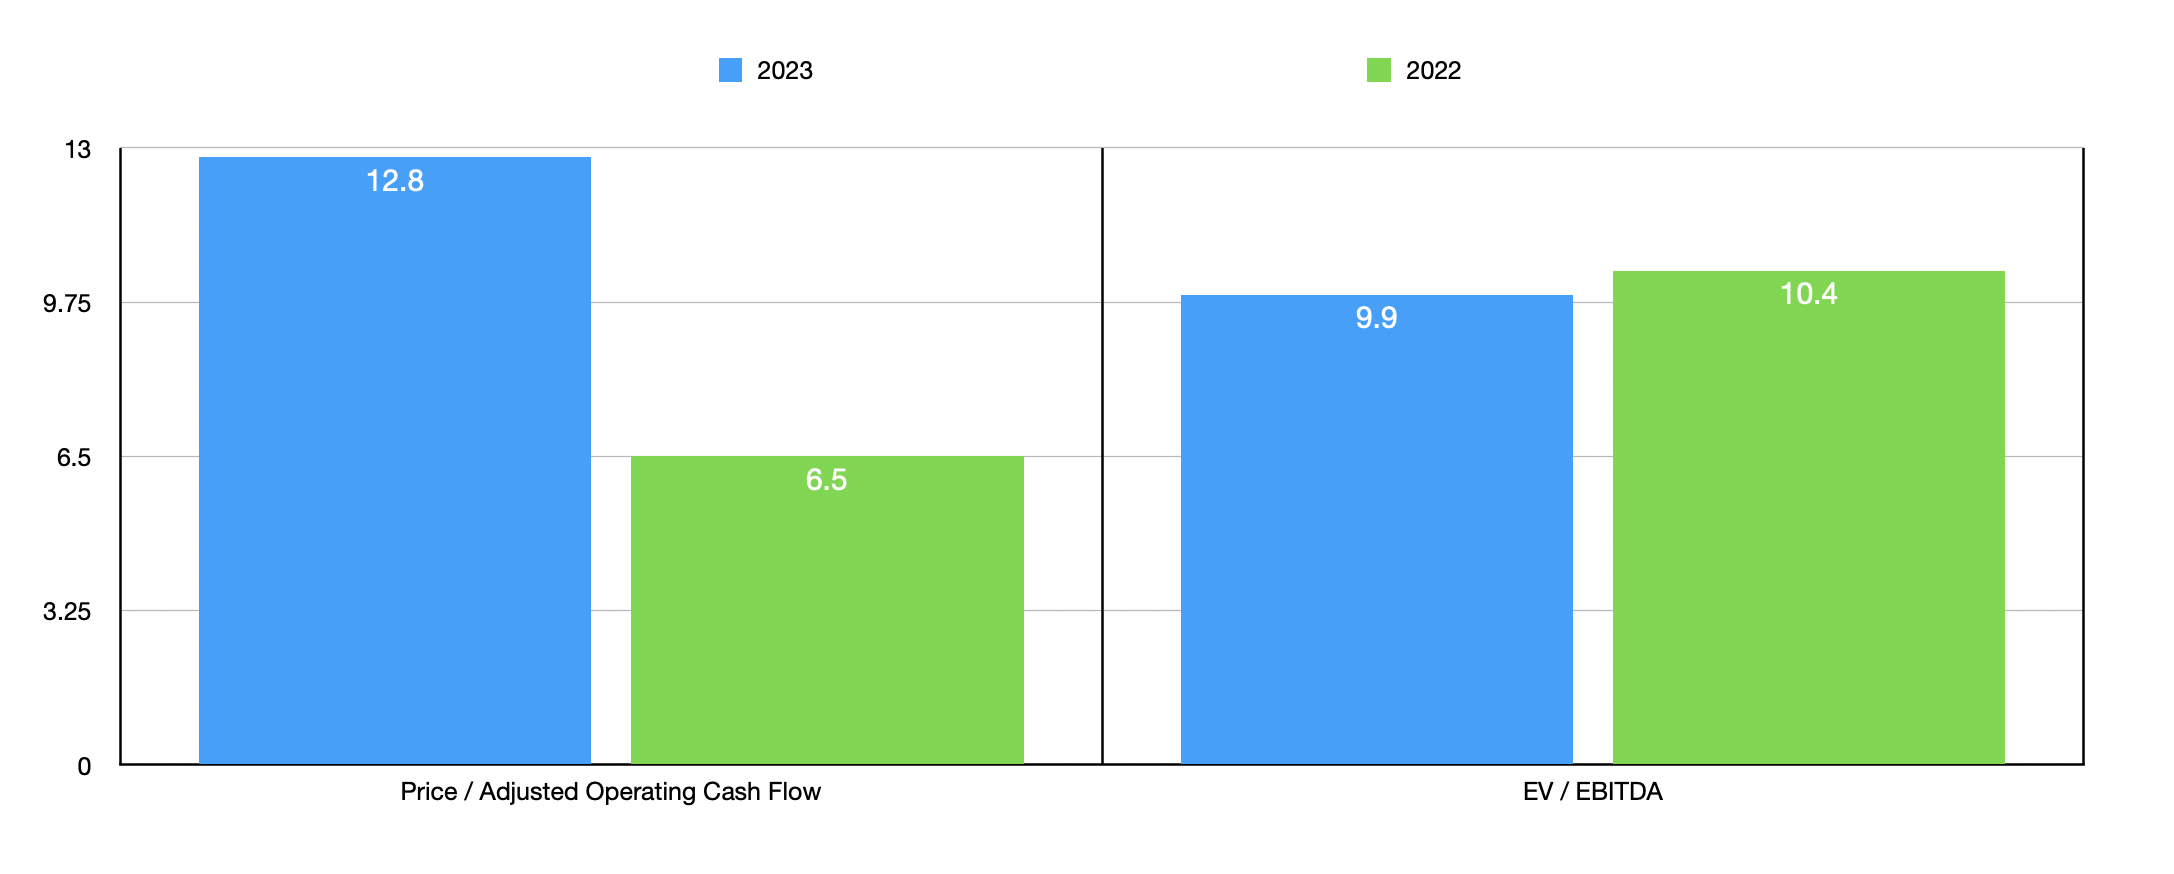
In terms of valuation, I forecast out what the rest of 2023 might look like. Based on my estimates, adjusted operating cash flow for Six Flags Entertainment will likely come in at around $199.7 million, while EBITDA should be somewhere around $486.5 million. In the chart above, you can see how shares are priced on a forward basis and how they are priced relative to results from 2022. Taking these figures, I then compared the company to the two similar firms I mentioned earlier in this piece. That comparison can be seen in the table below. Even if we are generous and use the results from 2022, we would find that Six Flags Entertainment lies in between its two rivals when it comes to the price to operating cash flow perspective. But when it involves the EV to EBITDA approach, shares are materially more expensive.
| Company |
| Price/Operating Cash Flow |
| EV/EBITDA |
| Six Flags Entertainment |
| 6.5 |
| 10.4 |
| Cedar Fair, L.P. |
| 8.0 |
| 7.2 |
| SeaWorld Entertainment |
| 6.4 |
| 4.7 |
Takeaway
From all the data that I see in front of me, I must say that my feelings regarding Six Flags Entertainment have not really changed. The company is a fine operator that, in the long run, will probably do fine. However, I see no reason why somebody would like it over a rival like Cedar Fair. Given the totality of the picture, I've decided to keep the business rated a 'hold' for now.
For further details see:
Six Flags Entertainment: Not Enough To Get The Pulse Racing