TSLA - Tesla: Lower ASPs Aren't An Issue Other Factors Dampen The Buy Case
Summary
- Tesla’s gradual transition from a premium play to a mass-market option will be instrumental in cracking some of the major global markets.
- Even as ASPs have declined over time, other key metrics have only improved and are unlikely to slide overnight.
- The near doubling of the share price from the Jan 2023 lows makes the risk-reward less alluring.
- We have a Hold rating on the TSLA stock.
Don't Fret Over Lower ASPs
Over the years, Tesla, Inc. ( TSLA ) has had to cope with its fair share of criticism, and more recently, some of the pushback has been centered around the company's positioning with prices, which were cut by roughly 20% last month across the globe.
I don't believe this gradual shift from being a premium player to an affordable mass-market type entity is a particularly bad thing. In fact, you could argue that Tesla runs the risk of being priced out of some of the next decade's most promising EV markets if it continues to get too ensconced with its elitist aura.
For instance, in China, Tesla already is poorly positioned on the price front against one of its largest peers in the EV market - BYD Company Limited ( BYDDF ). After accounting for government subsidies, Tesla's lowest price vehicle costs 2.5-3x as much as BYD's budget offering, in local currency terms.
The weak positioning isn't limited to just China alone. BYDDF is already present in the burgeoning Indian EV market and is looking to capture 40% of the market by the end of this decade. Meanwhile, Tesla is yet to stage an entry in this value-conscious market. I don't know how long Tesla can continue to stay away from the Indian market, given the growth potential on offer there. While the US EV market will likely grow at a CAGR of ~25% through 2028, its Indian counterpart will likely grow at a whopping rate of ~94% through 2030!
Thus, in light of what I've just touched upon, a declining trend of ASPs doesn't necessarily have to set alarm bells ringing. Tesla also can push through further affordability of its vehicles by passing on the benefits it gets from the advanced manufacturing production credits for battery packs. Initially, management expects to receive benefits to the tune of $1bn a year, but this looks set to expand over time.
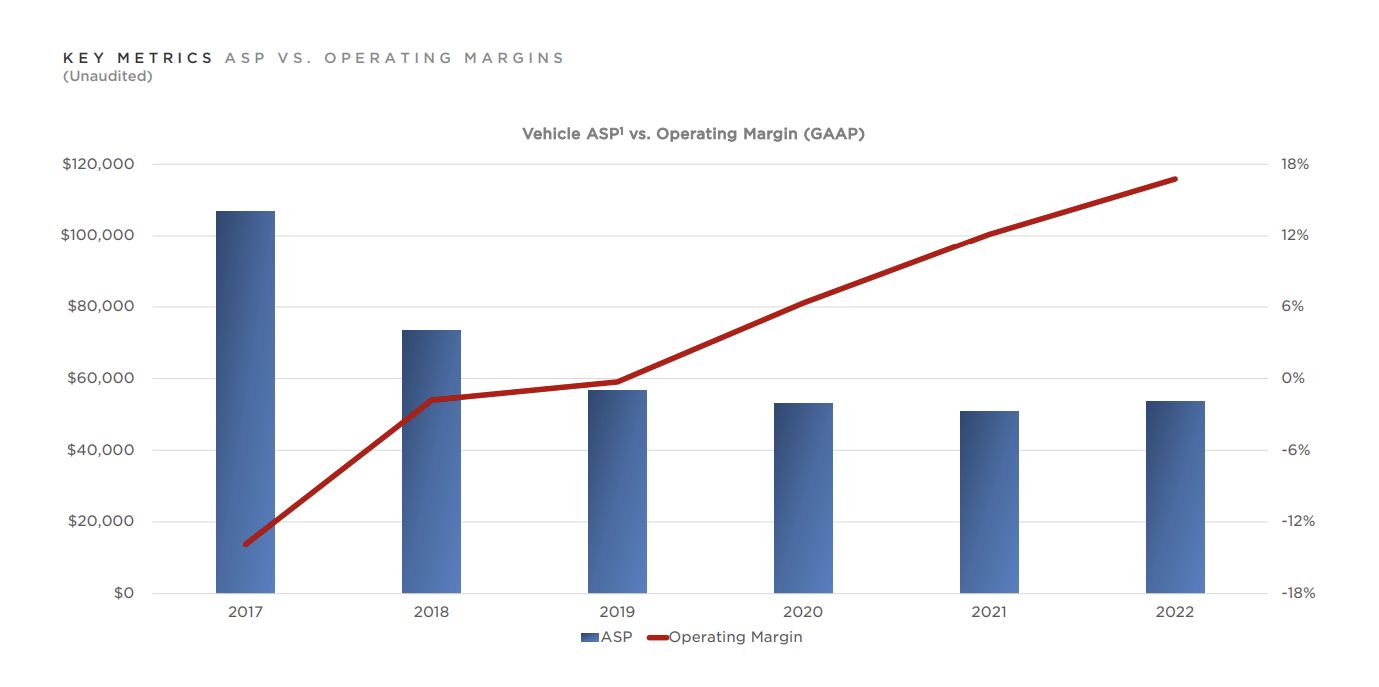
I can understand investor concerns over ASP weakness if it was something that TSLA was embarking on for the first time. However, the decline in average selling prices ((ASP)) has been rumbling along for a few years now. Five years back, the average ASP of a Tesla vehicle was well over the $100k mark. Since then, it has almost halved.
That trend would have been a concern for me if certain pivotal financial metrics that one would ordinarily consider, while gauging manufacturing entities, were trending lower, but that's hardly the case. In fact, things have actually improved. Crucially, these metrics are still a lot better than the numbers that the competition throws up!
Key Metrics
Firstly, one ought to commend the shifting texture and quality of TSLA's asset base, which makes it a little less capital-heavy and a little more defensive.
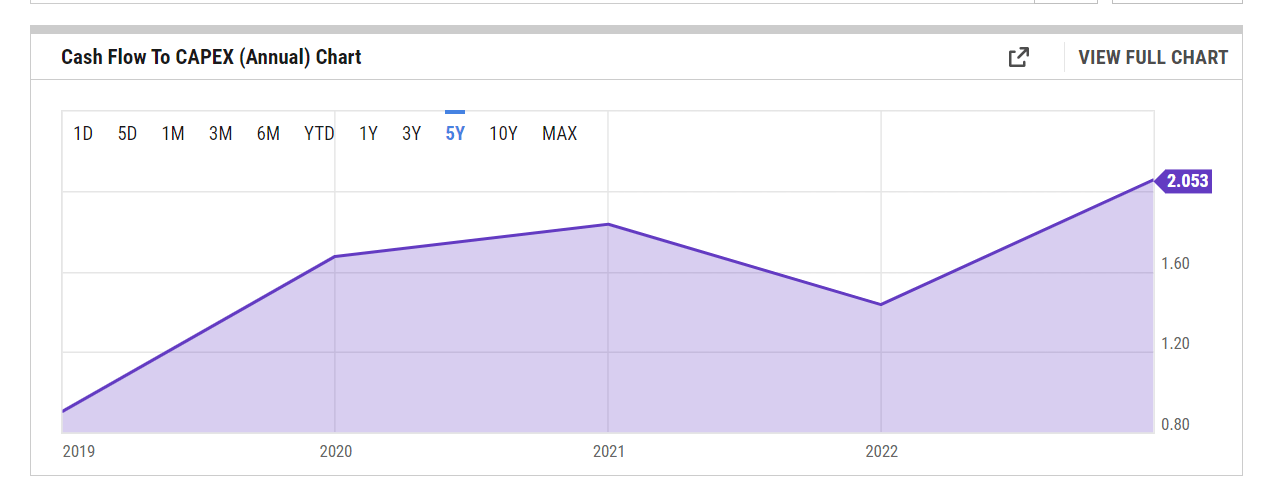
Gross PPE accounted for 78% of the asset base in FY18. These days it's at 58%. Four to five years back, Tesla was investing a great deal in capacity with capex as a function of revenue, typically accounting for 9%-10% p.a. Based on management's capex forecasts for the next three years (the mid-point of the forecasts give you a capex outlay of $7bn and $8bn through FY25), and taking revenue consensus numbers from YCharts , it looks like the capex intensity will dim in the years ahead as capex to sales could dip to 5% in a couple of years.
Tesla, YCharts
Even if, for some reason, the level of capex needs to ramp up well over the historical range, note that TSLA generates ample operating cash flow to cover this by over 2x.
Only Li Auto ( LI ) offers a better coverage ratio when you consider other notable peers in the EV space.
YCharts
The defensive profile of TSLA's balance sheet is exemplified by the fact that cash and short-term investments that accounted for just 12% of Tesla's asset base in FY18 now make up 27% of the asset base, something that could prove to be very useful in a down cycle.
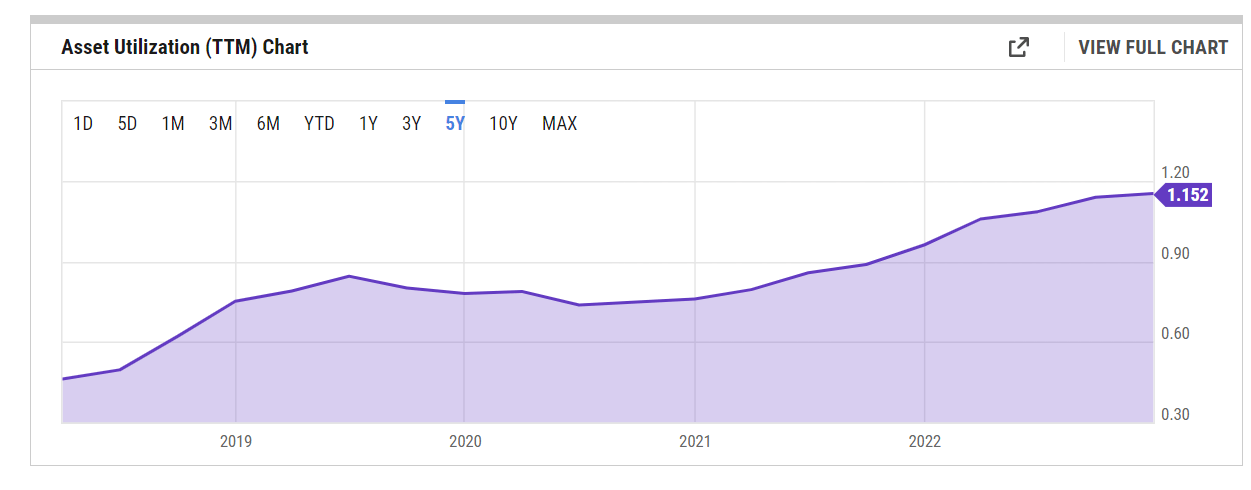
With an efficient asset base as your foundation, TSLA has done well to ramp up asset utilization over time. The image below shows you how the level of revenue generated for every dollar of assets has grown over time. Also note that asset utilization levels are best in class.
YCharts
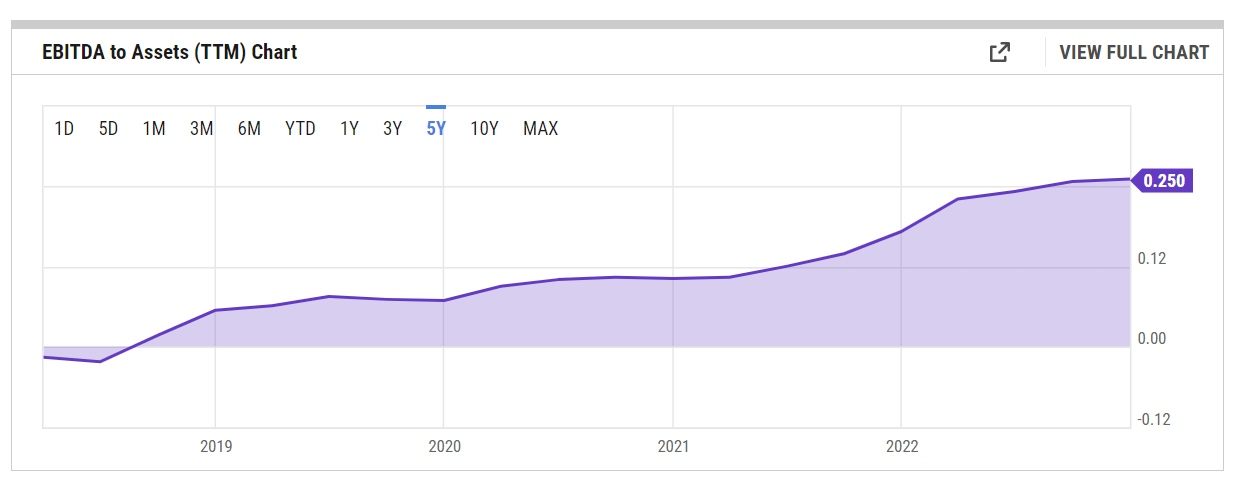
Tesla's combination of assets has also been instrumental in driving through increased EBITDA over time (despite lower ASPs).
Relative to other peers, even the second-placed XPeng's ( XPEV ) EBITDA to assets figure is not even half as good as Tesla's corresponding figure.
YCharts
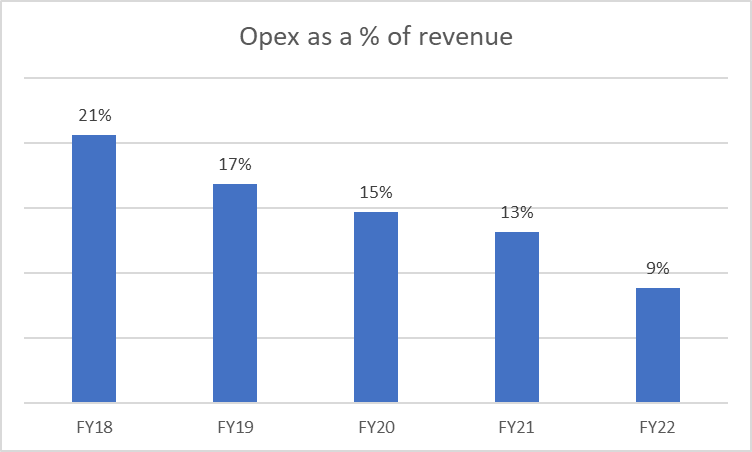
This reiterates the fact that the ASP narrative isn't the only game in town. You also have other levers like operating leverage, overhead efficiency, increased localization content, etc. that make a difference, areas in which Tesla has demonstrated ample competency. This narrative is augmented by the fact that Tesla's OPEX as a percent of revenue has steadily declined over the years and is currently at single-digit levels.
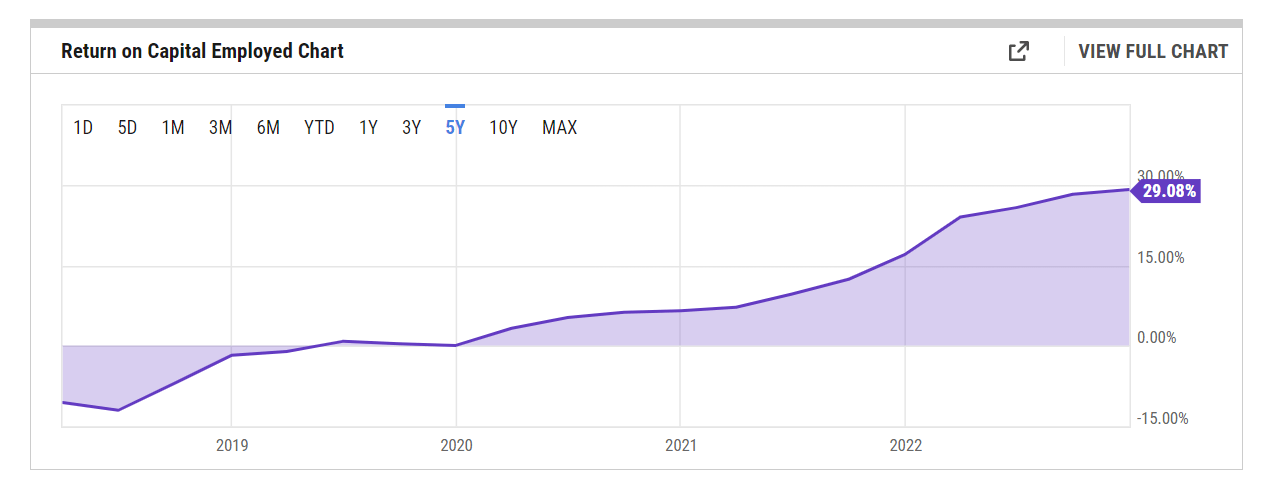
Finally, I'll end this segment by highlighting one of the most important metrics which validates the TSLA management's credibility in managing capital - the ROCE. The ROCE uses EBIT in the numerator rather than net income, which can be more susceptible to accounting gimmicks.
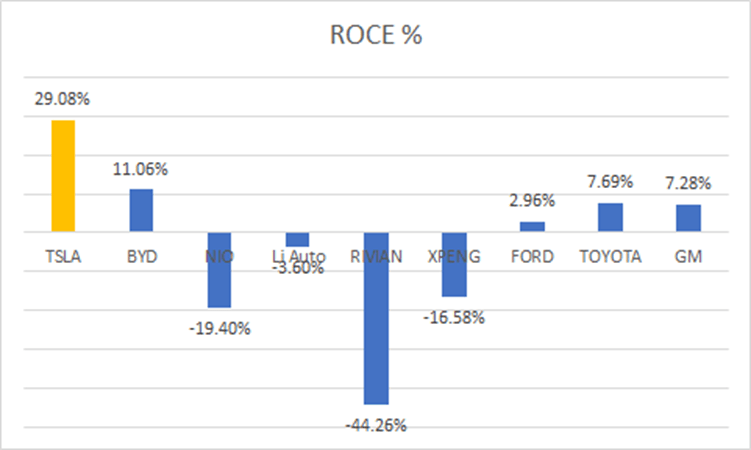
TSLA's ROCE is currently just a tad lower than 30%. To see how elite that is, consider the figures associated with the competition. BYD, the company with the second rank has a figure which is a good 1800bps lower!
All in all, I'm not dismissing the fact that Tesla may face a few blips along the way, but given the management's strong track record with managing capital, revamping the asset base, and generating returns in the face of lower ASPs, it would be foolhardy to blindly write off the company.
Closing Thoughts - Is TSLA stock a Buy, Sell or Hold?
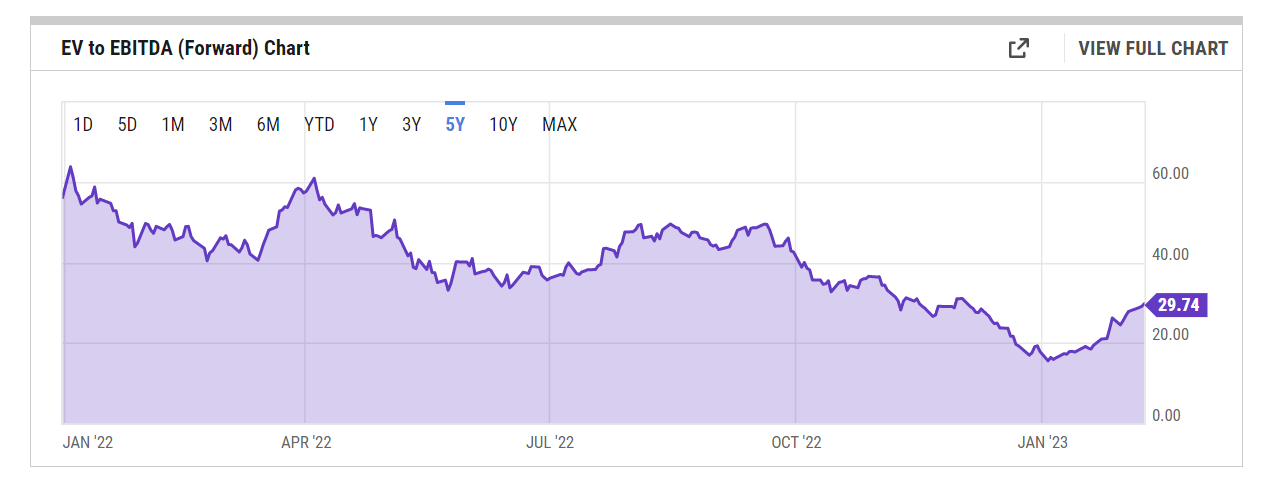
Since peaking in Nov 2021, the Tesla stock has lost considerable ground and is currently trading over the $210 level. Unsurprisingly, in light of this steep price correction, forward valuations look a lot more palatable than what they did a few years ago, even if the share price has staged a smart recovery YTD , with a near doubling of the price from the January lows. Based on the FY23 EBITDA forecasts , TSLA's EV/EBITDA multiple of 30x represents a 25% discount to its long-term average.
Admittedly, some investors may still feel that the current 30x EV/EBITDA multiple feels bloated, as FY23 will be the first time in five years that TSLA's annual EBITDA growth will likely lag the annual top-line growth. As implied in the image below, on average, over the last four years, TSLA's EBITDA growth has exceeded revenue growth by 1.93x, but this year, the former will likely only grow at one-third the pace of the latter.
Seeking Alpha, YCharts
Then, on the charts, Tesla may no longer look overbought relative to its peers from the auto sector (as represented by the ETF - CARZ) or its peers from the lithium and battery tech space (as represented by the ETF - LIT). Note that the respective relative strength ratios have pulled back significantly, and are a lot closer to the mid-point of the range, which was not the case around a year ago.
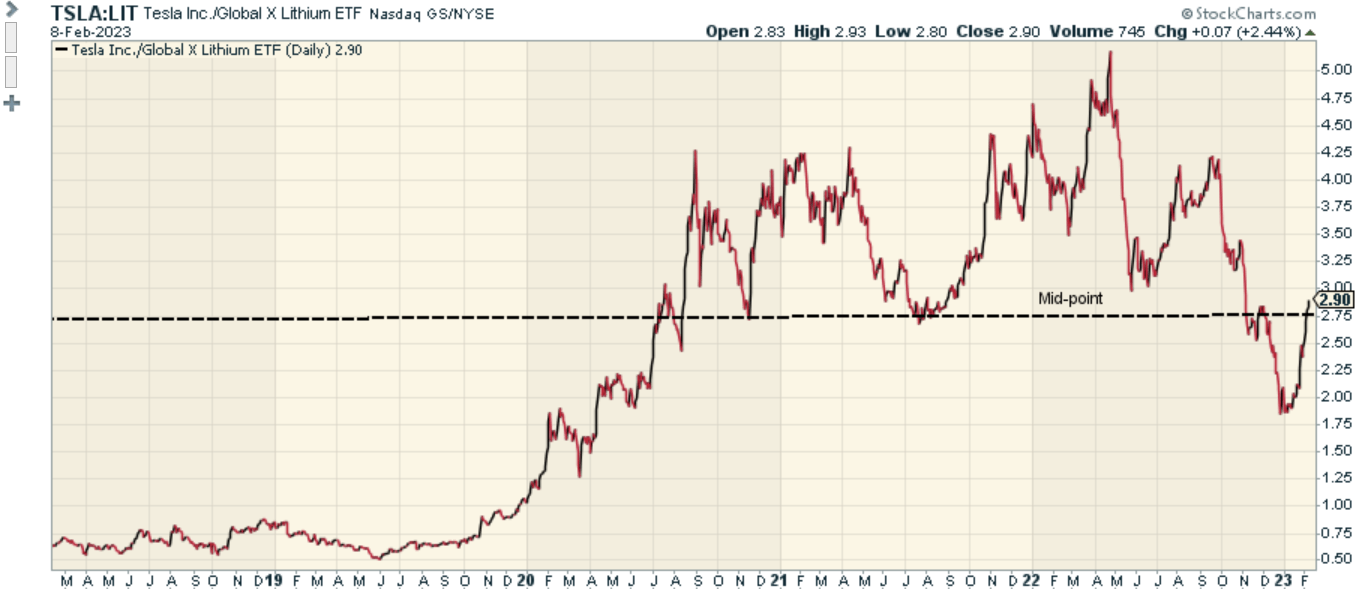
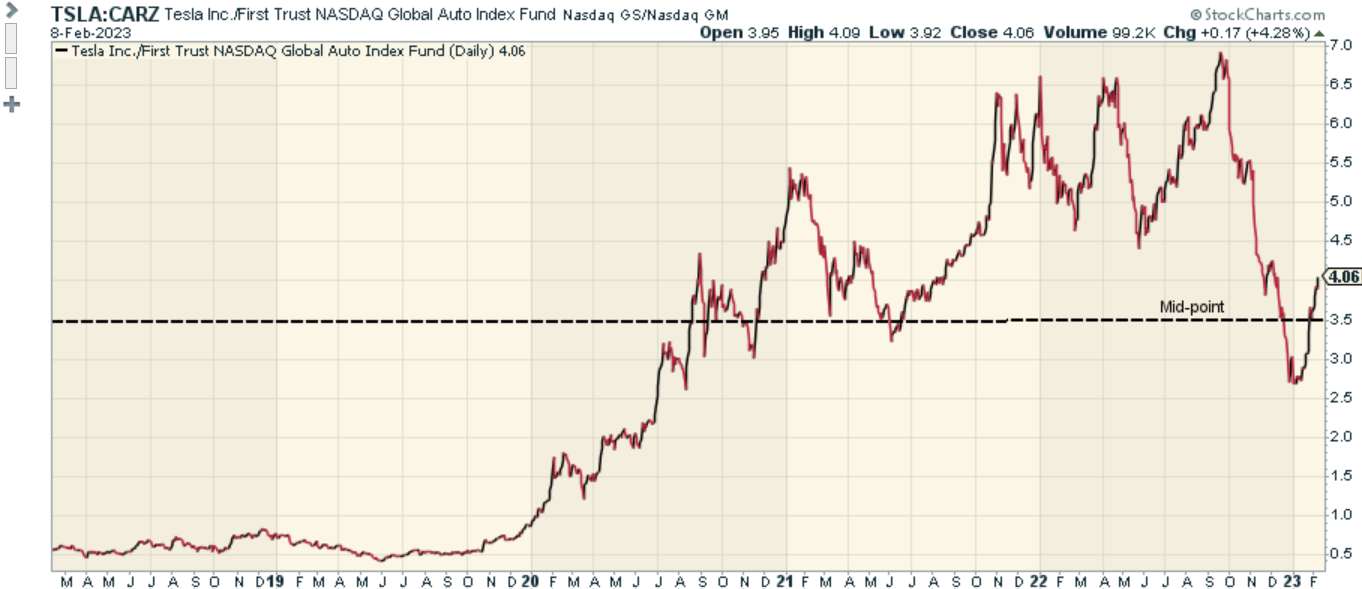
The implication here is that investors who only fish in the auto and lithium chain space may be less enthused to rotate out of TSLA into other peers. But then again, even if you want to turn bullish, I feel it would be asking for a lot to expect a V-shaped pivot in the price imprints when the institutional cohort is yet to let go of its largely bearish stance.
The latest data as of the end of Jan shows that the number of institutions that own the TSLA stock and the net shares owned by these guys continues to dip (in effect, the growth in both these metrics are down by 6-7% since the start of Q4-22).
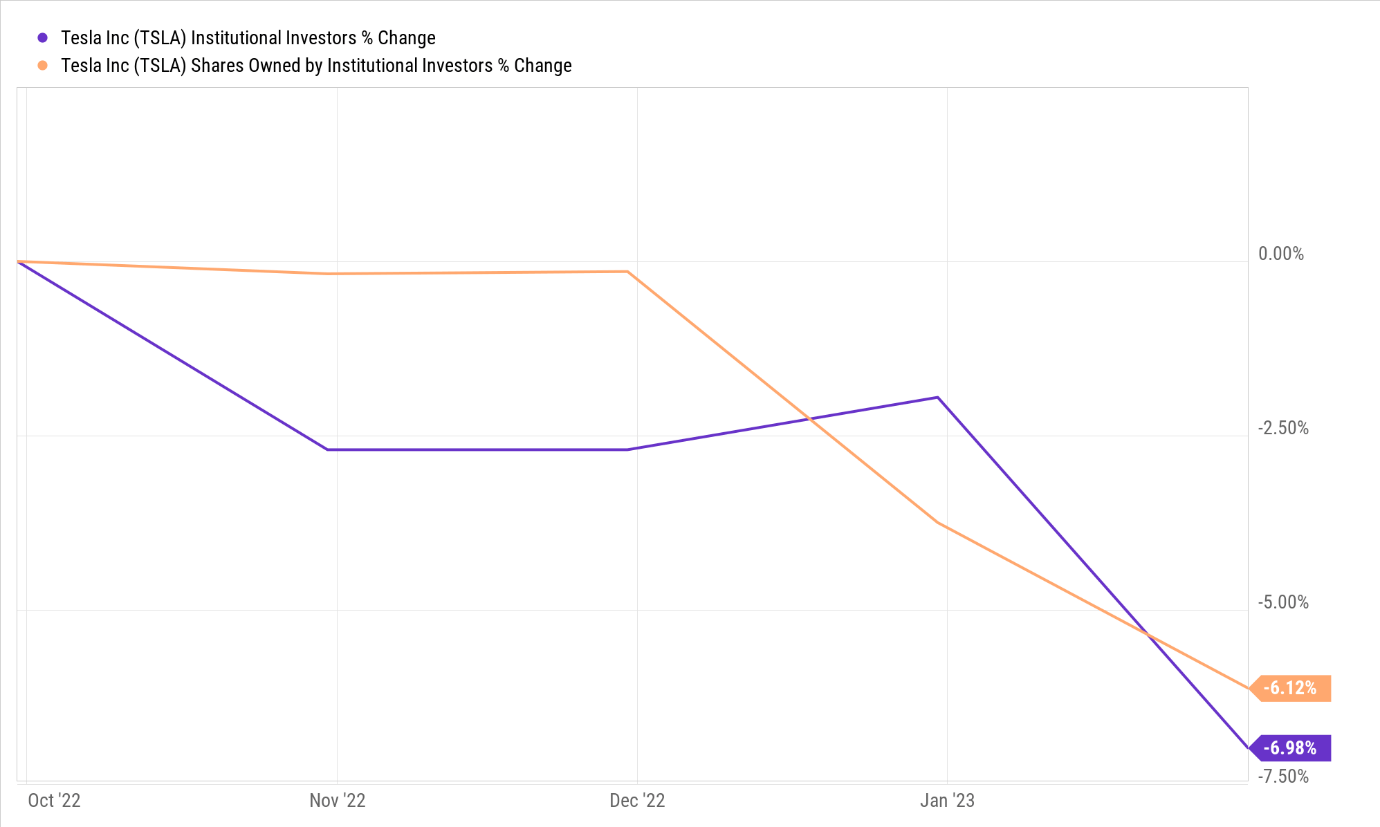
It's difficult to see these institutions turning bullish any time soon when you consider that the average sell-side analyst price target of $191.88 (of 33 sell-side analysts) is lower than the current share price.
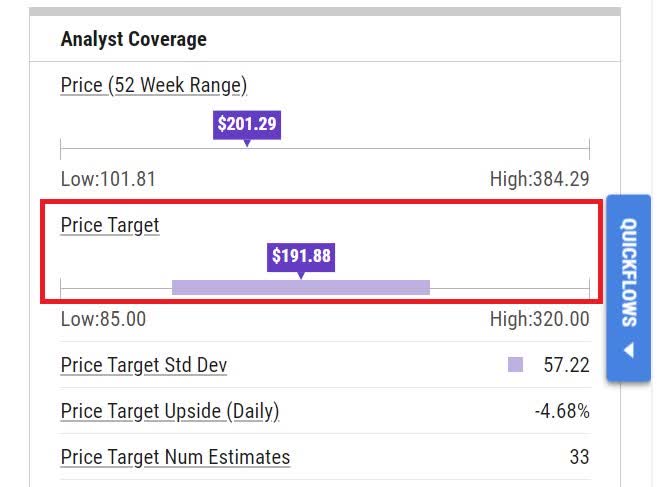
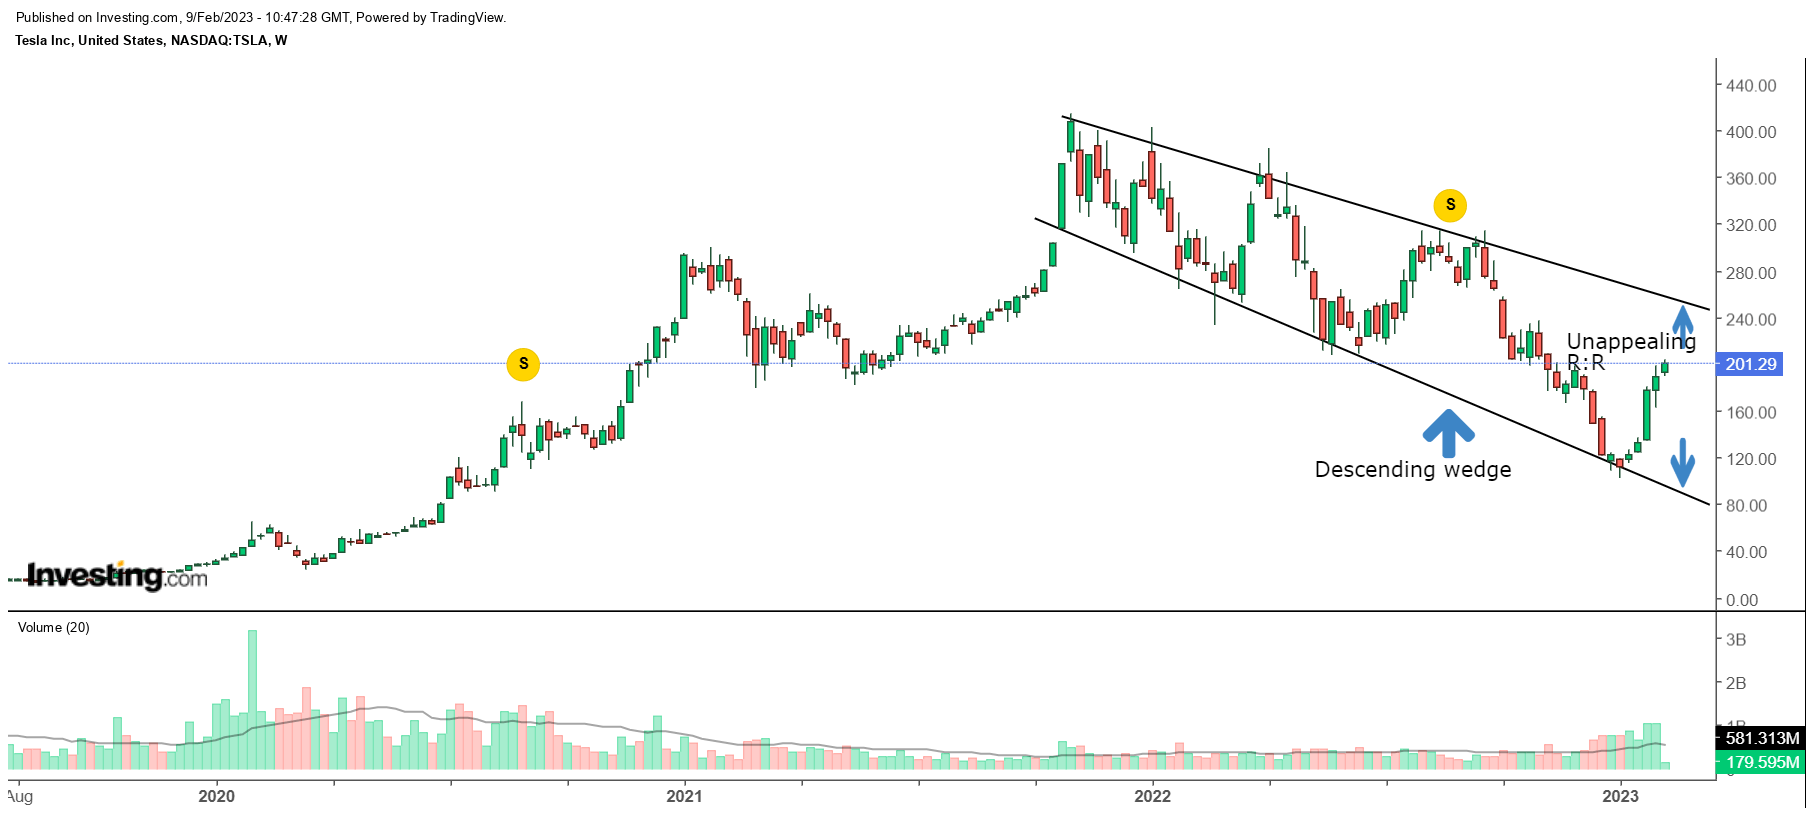
On TSLA's weekly chart, one can also see that since Q4-21, the price imprints have largely taken the shape of a descending wedge pattern. If you were to keep the upper (~$240) and lower (~$80) boundaries of this wedge pattern as your fence posts, I don't believe one can get too excited about staging an entry at this juncture when the reward to risk equation is rather weak at 0.32x.
To conclude, while I still believe that Tesla has some commendable qualities that will hold it in good stead, at this juncture, the stock is a Hold.
For further details see:
Tesla: Lower ASPs Aren't An Issue, Other Factors Dampen The Buy Case