WBA - The 4% DGI Core Portfolio: 2022 Year-End Review
Summary
- We present the 2022 year-end review of our eight-year-old Passive DGI-Core Portfolio. We consider this portfolio and strategy as the foundation of our overall portfolio.
- We will provide updates on changes, additional investments, dividends collected, and an overall 2022 performance.
- We believe a well-thought-out DGI strategy provides almost everything that most retirees and conservative investors would need: Decent income, relative safety, and reasonable growth.
With the year 2022 already in the rearview mirror, it's a good time to reflect on our investment plans and strategies and see how they handled last year's ups and downs and if they need any adjustments going forward. We present the annual review of our "4% Passive DGI-Core Portfolio." We have been managing this portfolio since August 2014 and have provided yearly performance reviews over the years.
History shows that a well-planned DGI (dividend growth investing) strategy usually outperforms the broader market over the long term. Also, we believe it would offer less volatility and smaller drawdowns during recessions and bear markets. This was proven during the 2008-2009 recession and again during the 2020 coronavirus-induced correction when the drawdowns of most DGI portfolios were one-third less than that of broad market indexes. This was once again proved right during 2022, when the broader market took a deep dive, and the S&P500 Index (SP500) lost about 18.5% for the year; however, our DGI portfolio lost only a minimal, roughly 2%. Also, a significant stream of dividend income makes it a little easier to wait out any downturn. Another significant advantage of a DGI portfolio is that it requires little work after the initial setup.
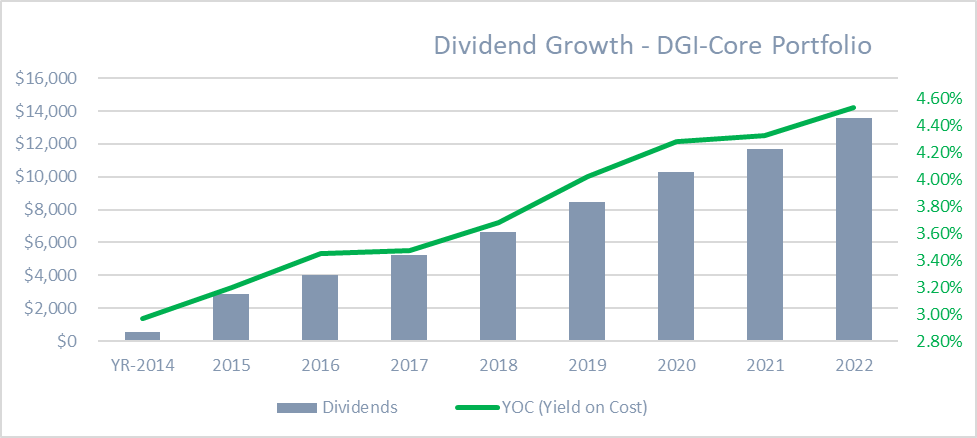
For a DGI portfolio, our primary goal is consistent, reliable, and growing income. The income growth should beat at least the rate of inflation in the long term. As such, the performance on the basis of total return on a year-to-year basis is not the objective of this portfolio, but over the long term, it certainly is. This portfolio has been meeting its primary goal handily. When we started the portfolio, we had an average YOC (yield on cost) of 2.97%. However, over the years, it has grown to 4.56% (yield on cost), and it is expected to be 4.64% in 2023. This is in spite of the fact that we have invested the capital over the years and not in one lump sum (which drags the YOC down a bit every year). Hypothetically, if we had invested a million dollars in this portfolio over the years, we should be generating at least $46,400 of annual income by now. For any retiree, once you add other income sources like social security or pension etc., one could expect a comfortable retirement and living off of dividends alone.
However, this strategy requires 10-12 years of re-investment of dividends to be able to generate a sizable income. So, our recommendation is to start investing at an early age, at least 10-15 years before retirement or the withdrawal stage.
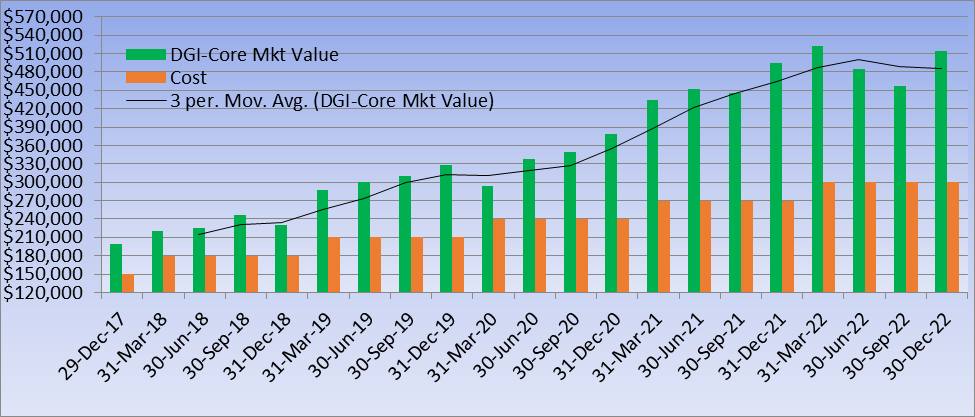
Here's the performance (quarterly) of the Passive DGI portfolio during the last few years and the gradual dividend growth over the years.
Chart-1:
Chart-2:
What is a DGI portfolio?
Note: Experienced DGI investors could skip this section.
DGI generally means that you invest in a set of blue-chip dividend-paying stocks with solid dividend history. Such companies usually grow their dividend payout year after year. Assuming you are still in the accumulation phase, you could re-invest (or DRIP) the dividends, which would result in more shares every quarter/year and higher future income. With each passing year, this growth of dividend income becomes bigger and bigger. More time you have until the withdrawal phase, the higher the income you can aim for. We should preferably mix high-yielding, slower-growth companies with low-yielding fast-growing ones. Besides, we should diversify among various sectors and industries and keep a maximum allocation of 5% to any individual stock.
If implemented with some prudent planning and over an extended period of time, the DGI strategy can provide almost everything that a retiree needs - decent income, relative safety, and reasonable growth.
The best part is that it's a far superior strategy to draw 4% inflation-adjusted income compared to index investing since it lets you do this without ever selling the shares.
The Passive DGI Core Portfolio: Background
We launched this DGI portfolio roughly eight years ago, in August 2014. We wanted to create a well-diversified portfolio with mostly blue-chip companies that had a history of raising dividends year after year and holding them for years. We also wanted to invest over an extended period of time so as to take advantage of dollar-cost averaging and create a decent enough income stream without the need to ever withdraw the capital by selling shares.
We named this portfolio "passive" because we thought it would require minimal management. Many times, there's been no action in this portfolio for months.
Basic Portfolio Structure:
The underlying principles of the portfolio were:
- Select 30 plus solid dividend-paying, dividend-growing companies, and invest the initial capital divided equally.
- Invest additional money on fixed intervals according to a pre-determined schedule.
- Use dollar-cost averaging and buy in a spread-out manner on a set timetable.
- Stay consistent and rarely sell or replace a company.
- Re-invest the dividends for the first ten years or more (depending on the personal situation) to grow the yield on cost (YOC). Thereafter, reap the benefits!
This is what we have done so far:
- $1,000 invested on Aug. 1, 2014, in each of the 30 original stocks, a total of $30,000.
- $1,000 was invested on Nov. 3, 2014, the first trading day of November 2014, in each of 30 stocks, a total of $30,000.
- Starting February 2015, every year, on the first day of trading in February, we invested $1,000 in each of the 30 stocks (a total of $30,000 each year). This was completed for the years 2015, 2016, 2017, 2018, 2019, 2020, 2021, and 2022. These annual investments will continue for two more years until the year 2024.
- In 2017, we stopped re-investing dividends automatically. Instead, we now let the cash accumulate and invest when we feel the price is right.
The original article that launched the portfolio can be accessed here and here .
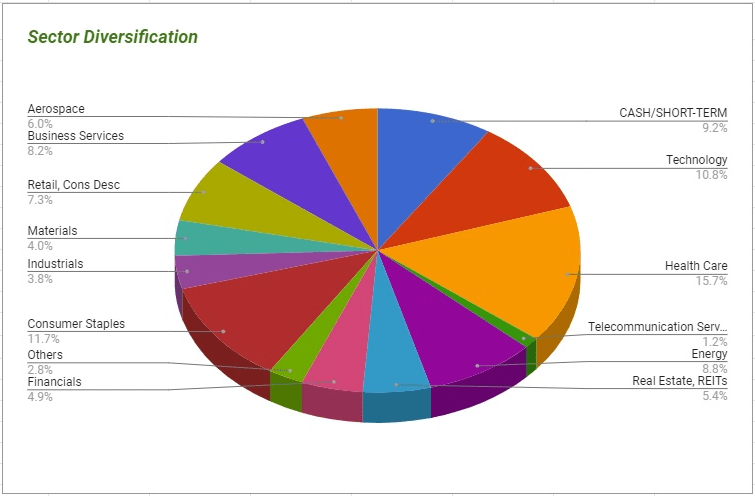
Over the years, we added a few additional stocks. Below is the current list of 43 stocks with the industry/sector information for easy reference. However, please note that the top 25 holdings constitute nearly 80% of the portfolio (excluding the cash reserve).
( ABBV ), ( ABT ), ( ADP ), ( AFL ), ( APD ), ( CI ), ( CL ), ( CLX ), ( CSCO ), ( CVS ), ( CVX ), ( DEA ), ( DWX ), ( EMR ), ( INTC ), ( ITW ), ( JNJ ), ( LMT ), ( MCD ), ( MDT ), ( MMM ), ( MO ), ( MSFT ), ( OTCPK:NSRGY ), ( O ), ( OHI ), ( PEAK ), ( PEP ), ( PFE ), ( PG ), ( PRU ), ( QCOM ), ( RIO ), ( RTX ), ( T ), ( TEVA ), ( UNH ), ( VLO ), ( VTR ), ( WBA ), ( WM ), ( WMT ), ( XOM ).
Table-1:
Author
Brief Highlights from Additional Investments
February 2022:
As per our annual pre-determined schedule of contribution in the first week of February, we added $30,000 of new money to this portfolio. We also utilized this contribution and some of the cash reserve and invested/added roughly $1,500 each to 23 of the existing securities at the time. The selected securities (23 out of 41 positions at the time) were chosen based on relative valuation and dividend safety scores. They were ABBV, ABT, ADP, AFL, CI, CL, CLX, CSCO, EMR, INTC, ITW, JNJ, LMT, MDT, MMM, MSFT, QCOM, RIO, T, UNH, WBA, WM, and WMT.
Additional Buy/Sell during the Year 2022
For the rest of 2022, we did not engage in any buying/selling except selling 78 shares of WBD (Warner Bros Discovery), which we got due to the Spinoff of WarnerMedia from AT&T. There were no other buy or sell transactions. The objective in 2022 was to keep building the cash reserve as much as possible. (Note: All buy/sell decisions are communicated to subscribers of our marketplace service HIDIY in advance.)
Table-2:
| Date |
| Action |
| Shares |
| Price |
| Amount |
| 04/05/2022 |
| Sell |
| 78 |
| 24.42 |
| 1904.76 |
Dividends
Note: Starting in April 2017, we stopped re-investing the dividends automatically. This was to allow us to build some cash position and make some opportunistic buys from time to time.
Table-3:
| Dividends in 2014 |
| $560 |
| Dividends in 2015 |
| $2,830 |
| Dividends in 2016 |
| $4,025 |
| Dividends in 2017 |
| $5,207 |
| Dividends in 2018 |
| $6,622 |
| Dividends in 2019 |
| $8,451 |
| Dividends in 2020 |
| $10,266 |
| Dividends in 2021 |
| $11,681 |
| Dividends in 2022 |
| $13,607 |
| Total dividends since inception (49,642 + 13,607) |
| $63,249 |
| Current Yield: (13,607/513,866) as of 12/31/2022 |
| 2.65% |
| Yield on Cost [YOC]: (13,607/300,000) |
| 4.54% |
| Forward Yield on COST (End of year 2022) |
| 4.64% |
Dividend Cuts or Freezes in 2016/2017/2018/2019/2020/2022
- In 2017, CVS froze its dividend at $0.50 per share prior to its acquisition of Aetna Inc. The acquisition was completed in 2018, but CVS continued to pay the same dividend amount. However, it has now resumed the increase from 2022.
- PEAK (formerly HCP) had to cut its dividend by 35% in 2017, following the spinoff of the ManorCare assets in 2016. HCP changed its name to Healthpeak Properties and its symbol to PEAK in 2019. It further reduced the dividends in 2021 to $0.30 per share from $0.37 a share earlier.
- TEVA eliminated the dividends entirely in the fourth quarter of 2017. It no longer suits our portfolio, but since it's a minor position, we still have it, but we intend to exit it sometime.
- In June 2020, Ventas ( VTR ) cut its dividend by nearly 43% due to the negative impacts of the COVID-19 pandemic. It is still paying a fixed amount of dividend.
- AT&T ( T ) had earlier frozen its dividends, pending the spinoff of WarnerMedia (and WarnerMedia’s merger with Discovery). This was completed in April 2022. AT&T re-adjusted (and reduced) its dividend. However, shareholders of AT&T also get some shares in the new company WBD.
Dividend Increases over the Years:
2017 summary:
Out of 35 individual stocks in 2017, dividends were increased by 30 companies, kept the same by four companies, and cut by one.
2018 summary:
A total of 33 companies announced dividend increases in 2018. The average for these 33 companies was roughly 8.8%. The average for all 38 positions was roughly 7.6%.
2019 summary:
In total, 32 companies increased dividends at an average rate of 7.19%. But if we average out for all positions, the increase comes down to 6.36%.
2020 summary:
In the year 2020, a total of 32 companies out of 41 increased their dividend payouts. The number of companies that have frozen their dividends increased to five. One company Ventas (a healthcare REIT), cut the dividend by nearly 43%. The average dividend increase for 32 companies was 6.52%. However, if we were to include VTR's cut, the average increase would come down to 5.16% .
2021 summary:
In the year 2021, a total of 35 companies increased their dividend payouts. In terms of the total dividend amount, we received a total of $11,681 in 2021, an increase of 13.78% over the amount received in 2020.
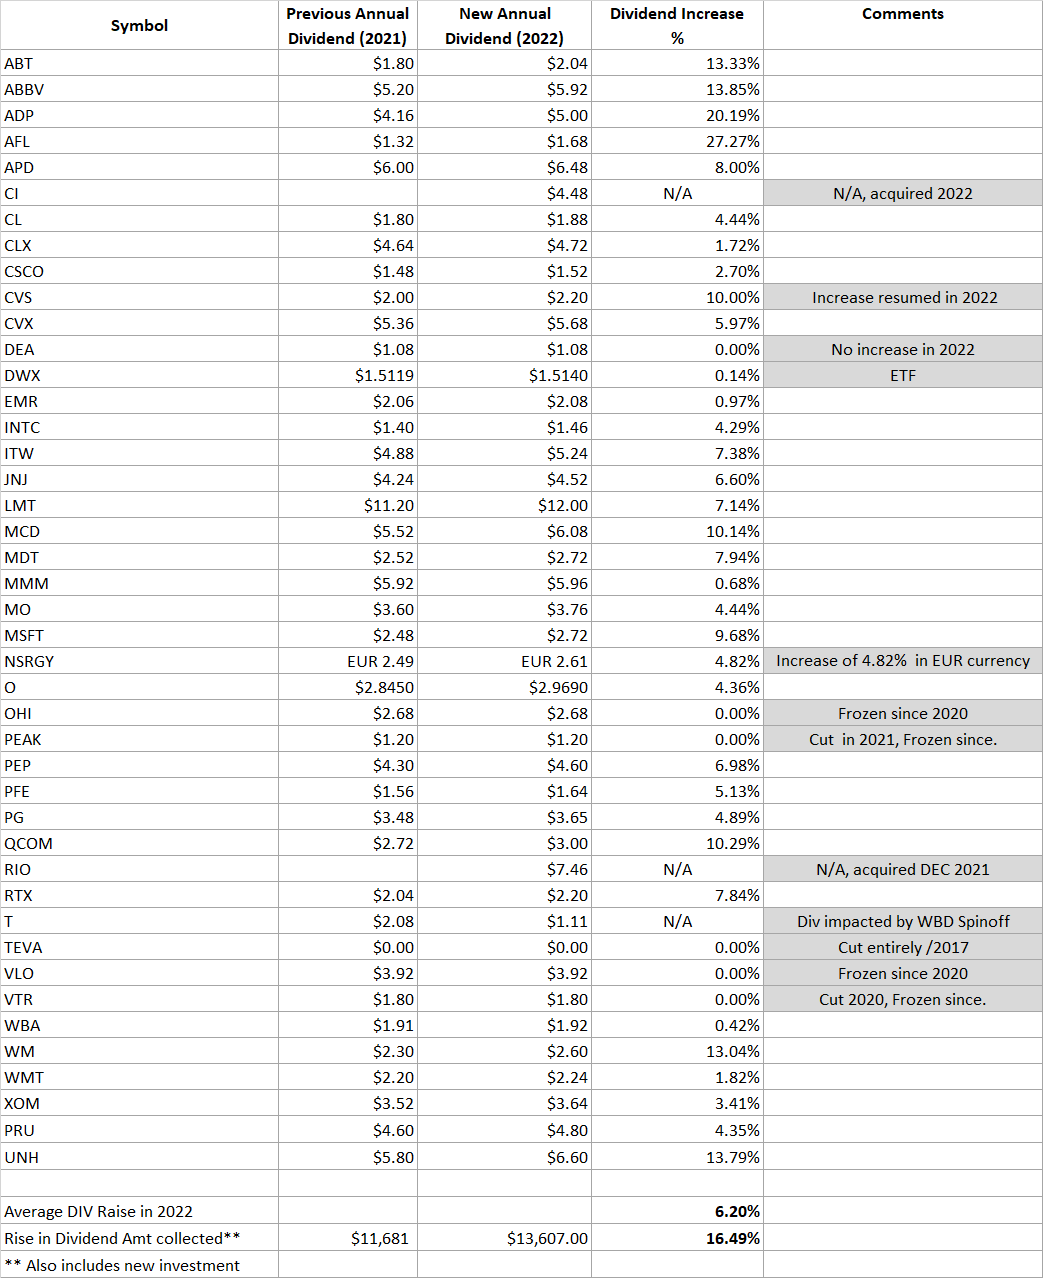
2022 Summary:
No new dividend cuts were announced in 2022, except that AT&T’s effective dividend got reduced roughly by 30% due to spinoff action. However, CVS resumed the dividend increases in 2022. A total of 34 companies increased their dividend payouts. The average increase was 6.20%. The total dividend amount increased to $13,607, an increase of 16.49%, in part due to additional investments from the contributions and cash reserves.
Table-4:
Portfolio Positions, Total Return, and Relative Performance
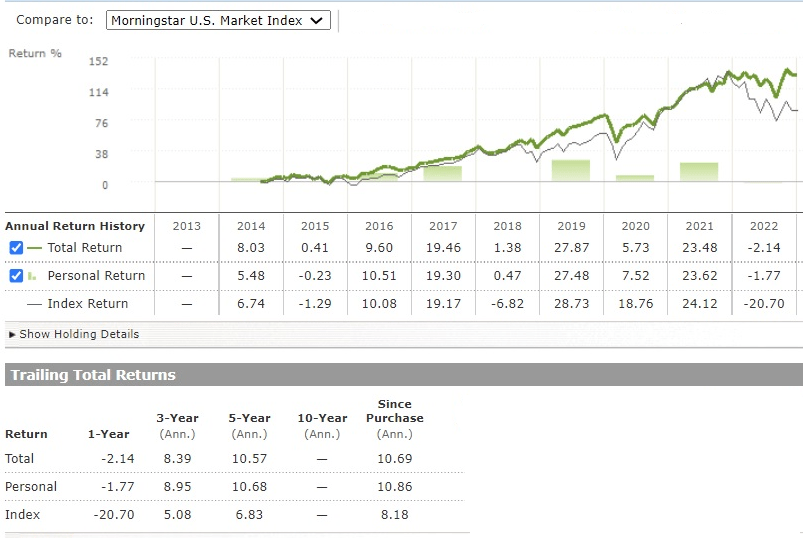
Here's a snapshot of relative performance as of Dec. 30, 2022, created using the Morningstar Portfolio Tool. The DGI portfolio and Morningstar Market Index are represented by green and gray lines, respectively. It may be relevant to note that prior to 2022, the DGI portfolio never had a down year since its inception. In 2022, the negative performance of the DGI portfolio was very minimal at -2% compared to -20.7% of the Market Index and -18.5% of the S&P 500.
Chart-3:
Note: Morningstar describes "Personal Return" as follows: The calculation of Personal Return illustrates how your allocation of capital has affected the performance of your portfolio.
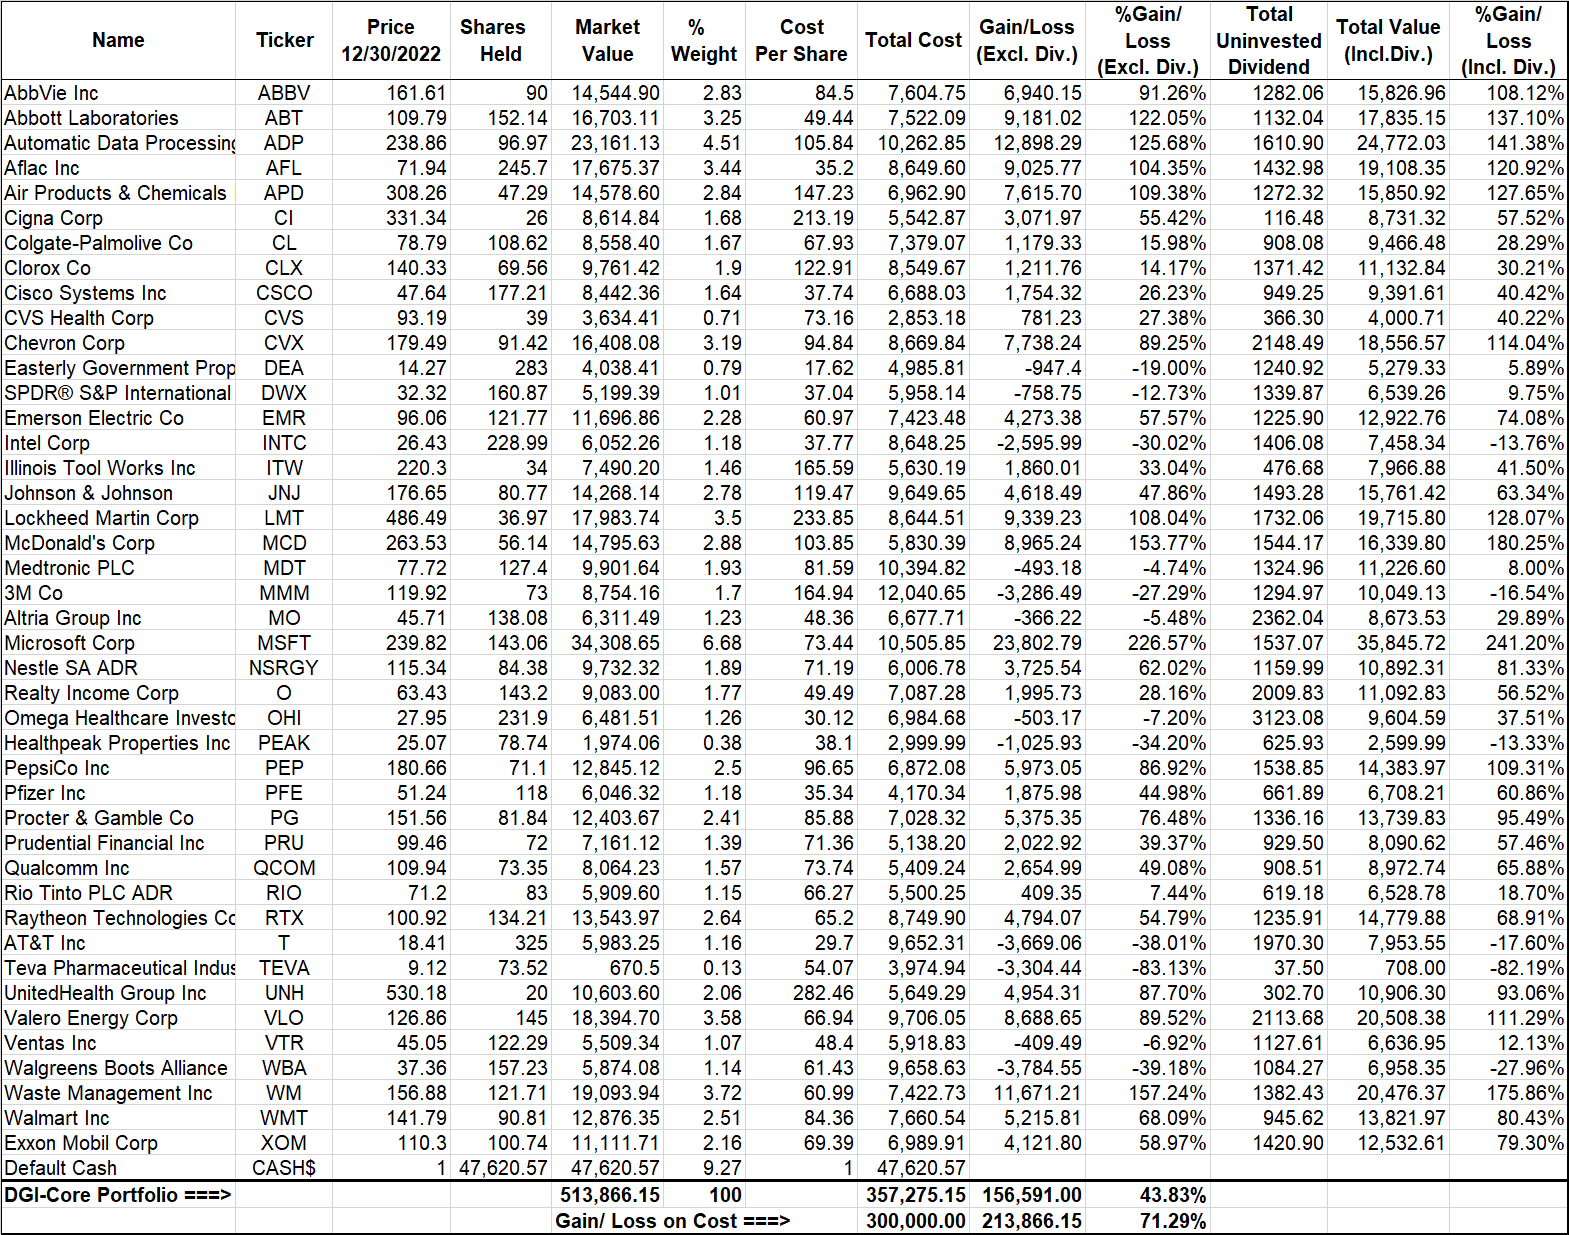
Here's the image of the current portfolio from excel as of 12/30/2022:
Table-5:
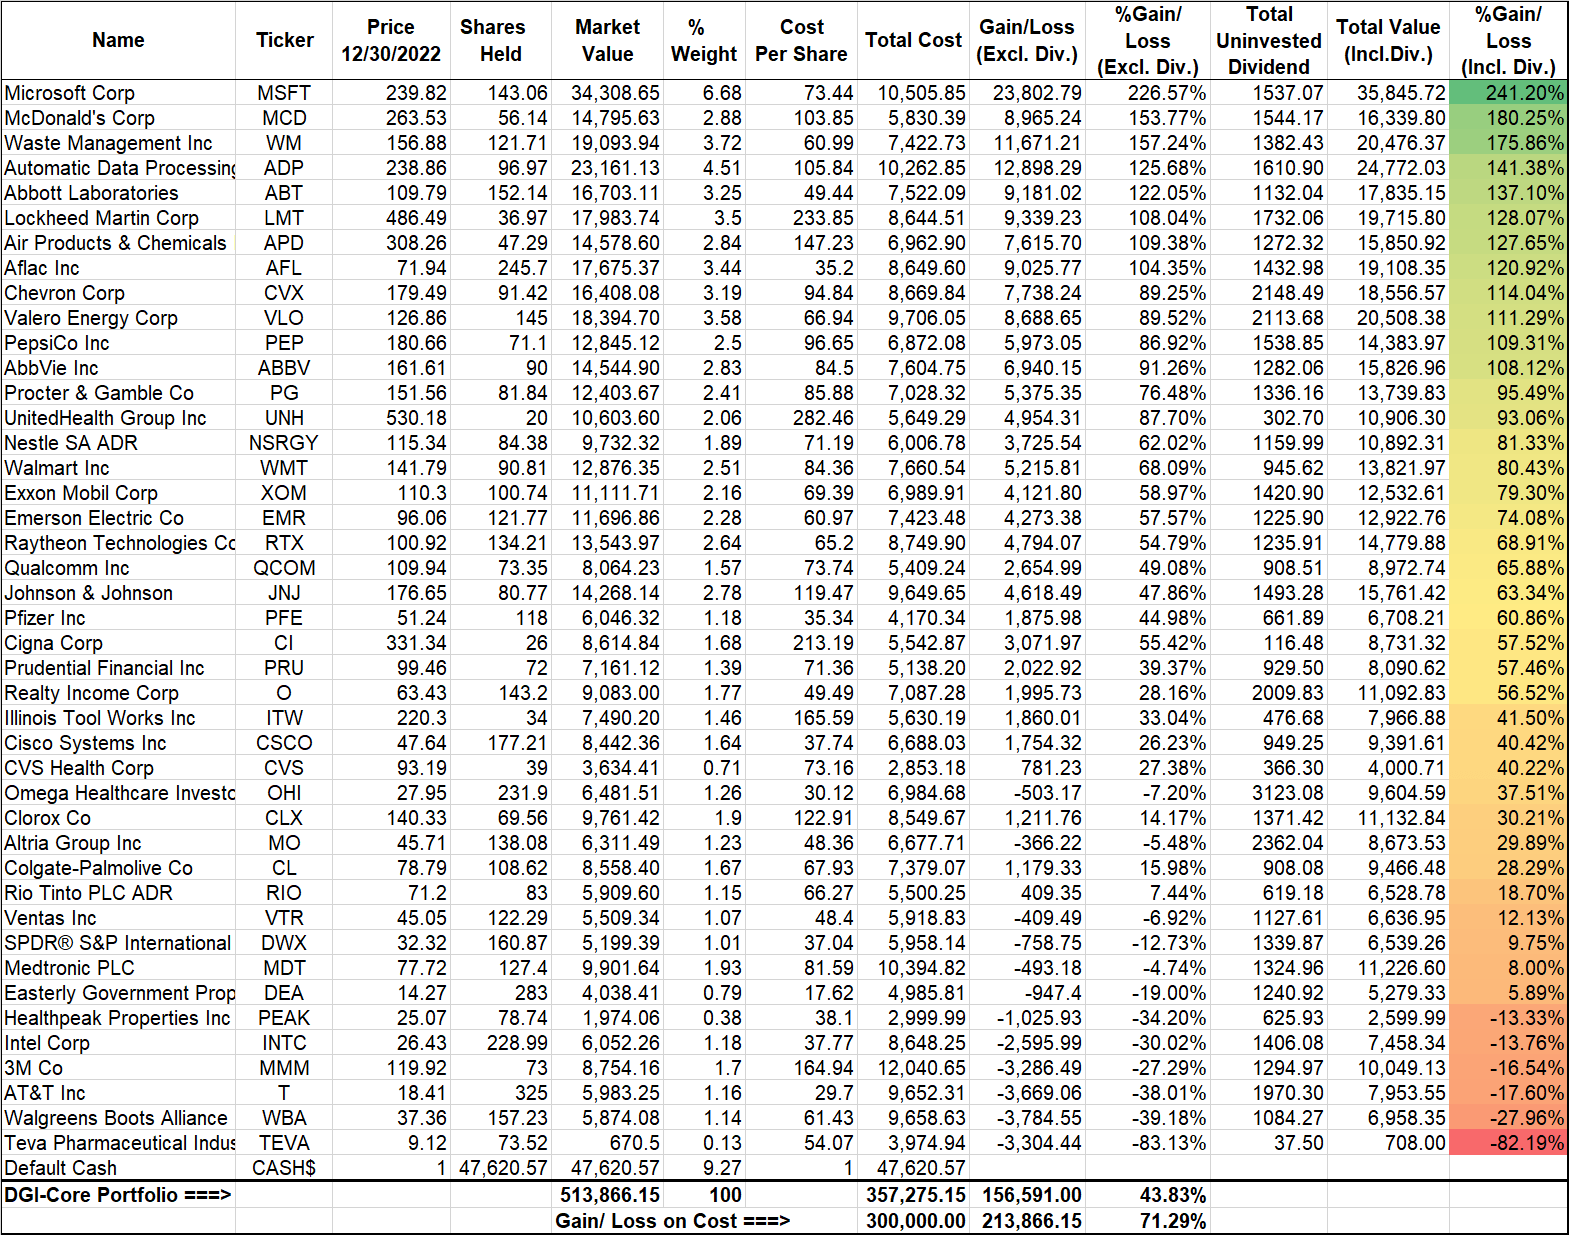
The below table shows positions in the order of performance after including the (uninvested) dividends:
Table-6:
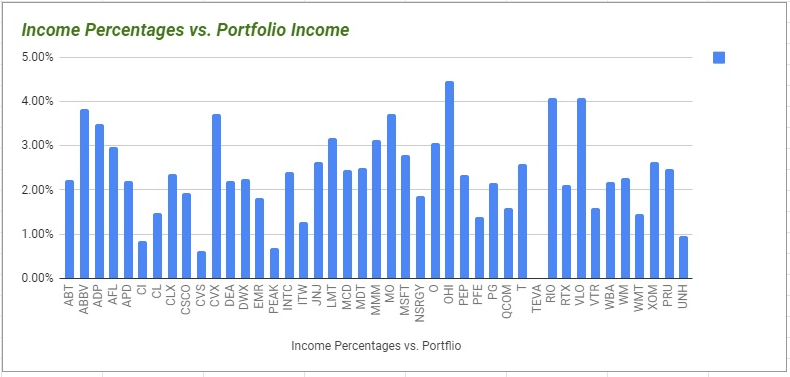
Chart-4:
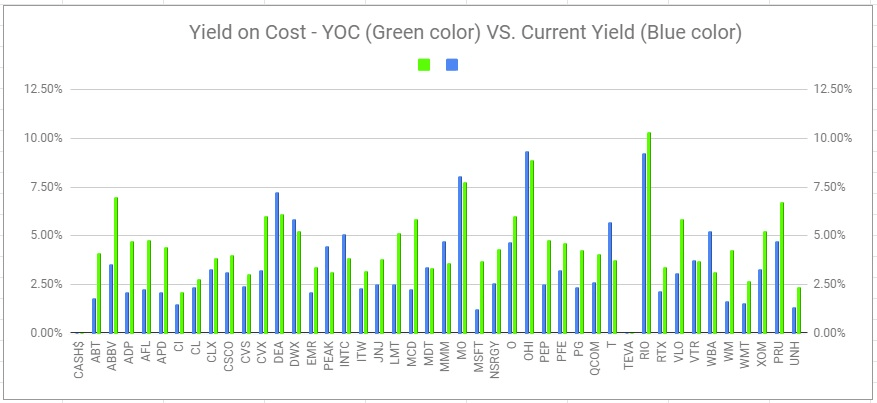
Chart-4b:
Chart-4c:
Chart-4d:
The Good, the Bad, and the Ugly
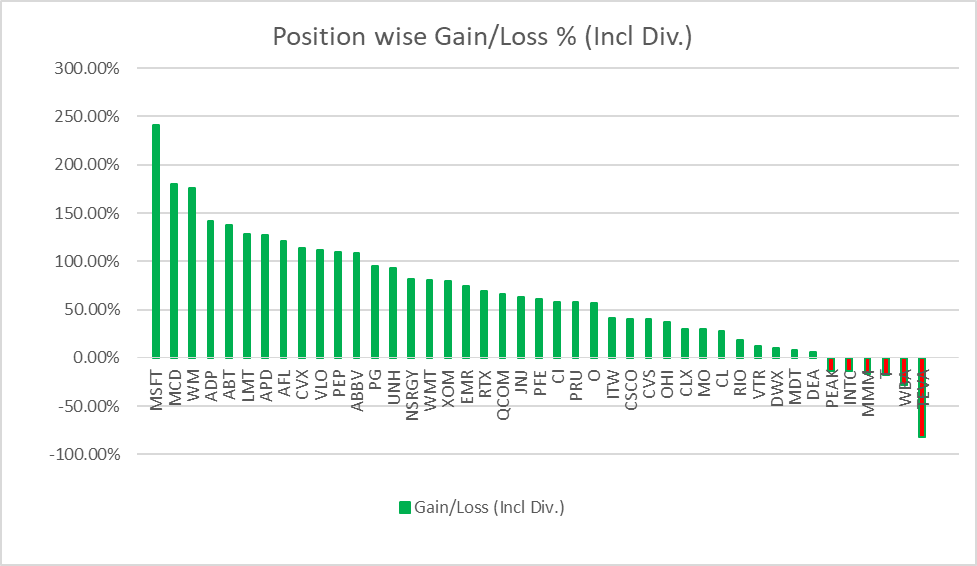
As of 12/30/2022, the portfolio had 43 positions, and when we include all of the dividends (including the dividend amounts that were not dripped), this is how they performed. There are six of them showing negative returns, only two of them being significant (one nearly a total loss and irrelevant at this stage).
Chart-5:
We know that there always are going to be a few bad choices in our portfolio that are not going to pan out according to our expectations. In fact, this underlines the importance of diversification. But more importantly, this also demonstrates that a few bad choices are not going to have any meaningful impact on the overall prospects of the portfolio.
Concluding Remarks
We regularly write about several types of strategies and portfolios here on SA. We also follow them personally and inside our Marketplace service. These strategies range from DGI, CEF-income, High Growth, and several Rotational portfolios. But the DGI has a special place among them, and that's why we call it a "core" portfolio.
For passive-type investors, a DGI strategy is ideally suited as it requires minimal effort, mostly just a few times a year. In addition, unlike ETFs and mutual funds, there are no fees to pay for holding them. It's a well-accepted notion that over a long period of time, dividend-paying companies provide a higher total return compared to non-dividend-paying companies. We believe, in the long term, this portfolio will offer better returns, lower volatility, lower drawdowns, and consistently growing income. The best part is that it requires minimal management. This portfolio is simple, easy to implement, and hassle-free. We believe the DGI portfolio strategy described above is the simplest way to accumulate wealth over a long period of time.
This DGI portfolio is an essential part of our overall investment strategy and plays a foundational role. In our allocation model, we suggest investing 35%-50% of the investment assets into DGI, depending on personal factors. The rest is allocated to other compelling and complementary strategies that provide not only strategic diversification but also some hedging against unknown future events and downturns. A multi-basket approach certainly requires more effort and may sound complex. But we believe it is worth the effort and time.
Below is our investment allocation model, and as you can see, the DGI portfolio forms the foundation of the overall strategy. The other portfolios are focused on high-income and risk management and are suited for active investors. These allocations are just for broad guidance - everyone should decide what's right for them based on their goals and risk tolerance.
Author
For further details see:
The 4% DGI Core Portfolio: 2022 Year-End Review