COST - The $50000 Dividend Portfolio: Your Path To Financial Freedom
2023-04-25 08:00:00 ET
Summary
- In this article, I discuss a model dividend growth portfolio based on the request of a follower.
- The portfolio consists of both ETFs and single stocks aimed to achieve outperforming returns with subdued volatility.
- I guide readers through my thoughts and provide some insights that might help them with various portfolio compositions and strategies.
Introduction
It's time to talk about asset allocation. This article is based on a question I got from a follower who asked me to help him with the construction of his portfolio. I really liked the stock picks he had and his approach to building long-term wealth. As I believe that it was the perfect basis for an in-depth discussion of portfolio management and stock picking, I decided to just write this article to discuss this topic with all of my readers.
Hence, in this article, I will show you how I would invest $50,000 in a dividend growth portfolio with a very favorable risk/reward and how consistent investing can help anyone build a decent nest egg.
So, let's get to it!
The Assignment
What's fun about investing is that building a portfolio is like cooking a five-course meal. People have different tastes, expectations, allergies, you name it.
When it comes to investing, we're also dealing with significant differences. Some people make more money than others (monthly investing volume), some cannot handle risk, some know nothing about the stock market, some will inherit millions at some point, some are in debt, some are in poor health, and the tax situation is different per nation. Even worse, all of these factors can change in the future, as nobody knows what the world will look like next year - let alone in 5-10 years.
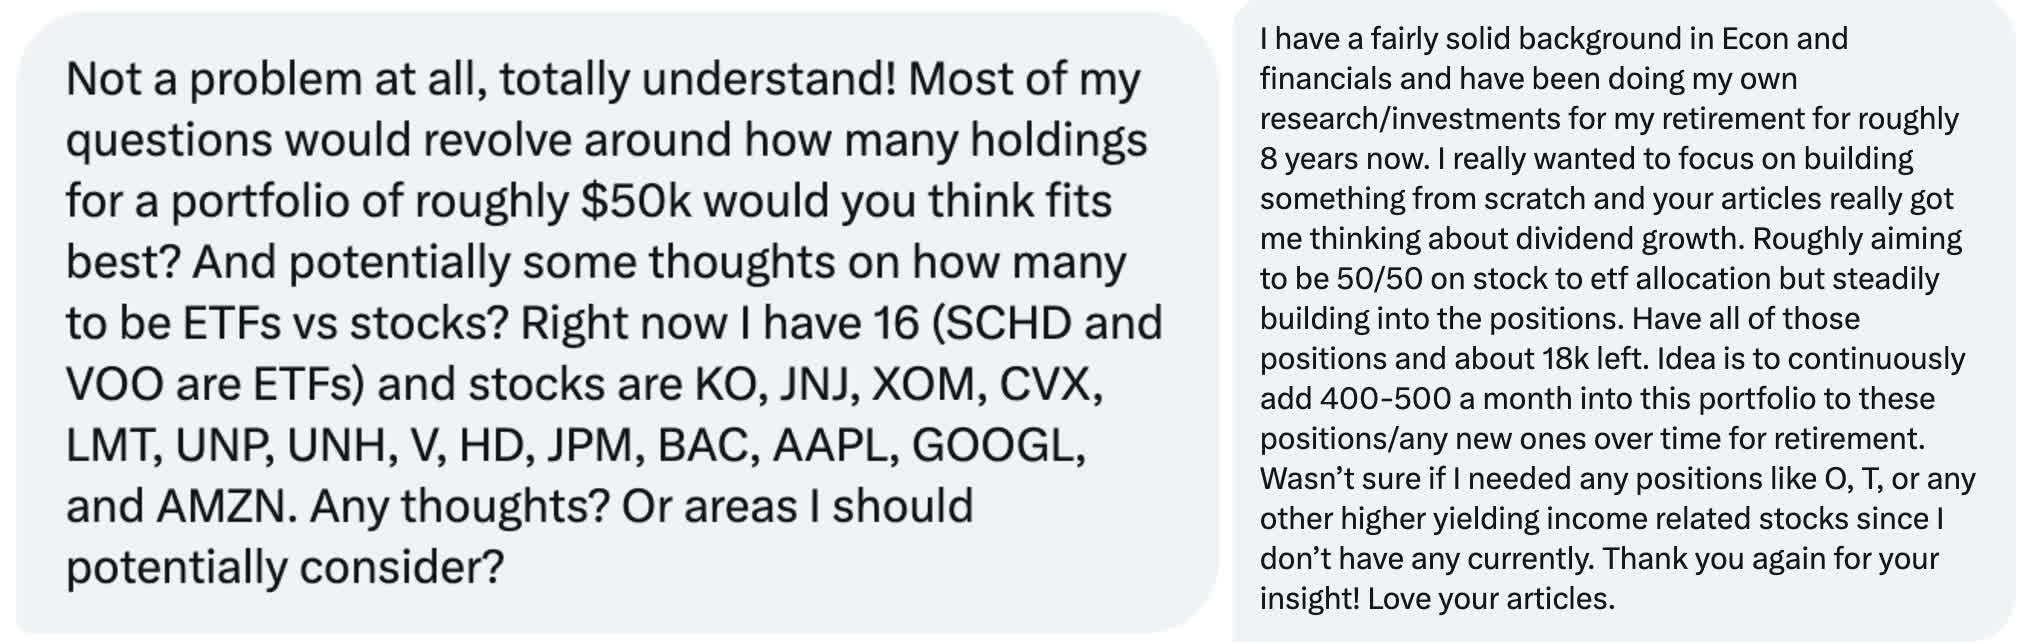
The person who reached out to me has a clear understanding of what he's looking for (which is a fantastic start).
Here's a short summary of the situation.
- An initial investment of $50,000.
- An existing strategy based on an ETF and single-stock mix.
- A background in economy and financials.
- Eight years of experience.
- The desire to build a new portfolio from scratch (that's what I did after selling everything in 2020).
- The goal is to go 50/50 stocks/ETFs -> risk awareness.
- A plan to invest $400-500 a month in this portfolio.
- A clear timeline and goal (retirement).
In other words, this is the perfect basis to start investing. If this person did not have a background that would indicate the ability to analyze or understand single stocks, I would go with a 100% ETF portfolio. However, in this situation, we can experiment with stocks and build a portfolio with a good (expected) risk/reward.
After all, we're dealing with financial numbers that can turn this $50K portfolio into a large nest egg.
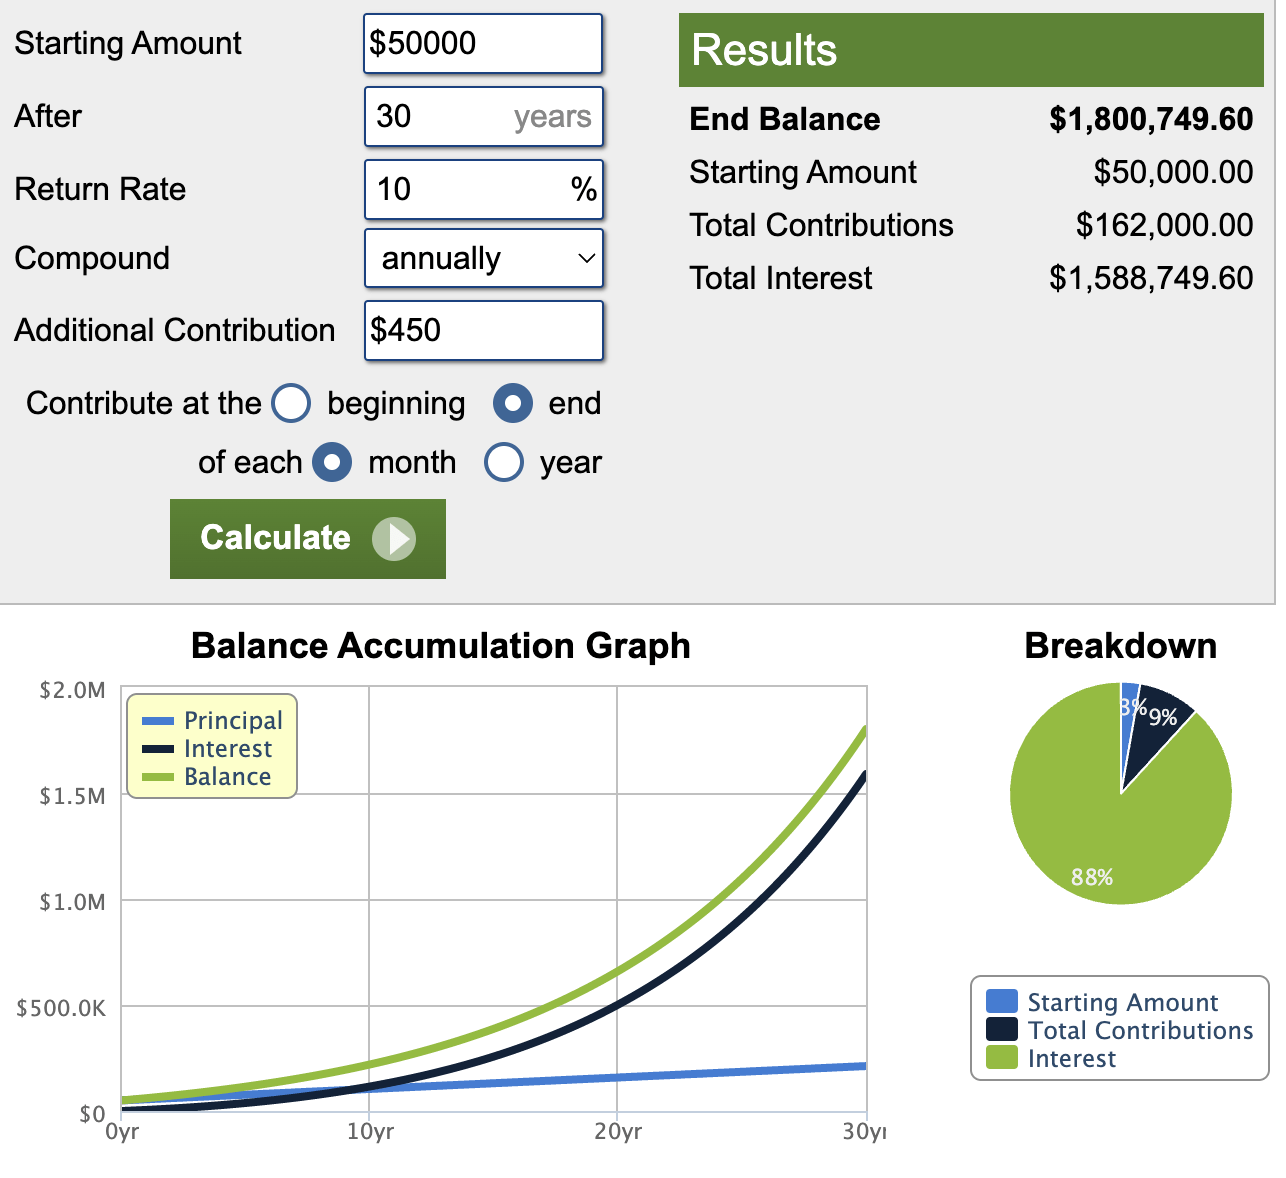
- Investing $50,000 today and adding $450 per month at an average annual return of 10% per year results in a $1.8 million balance after 30 years.
Of that number, total contributions would be just $162 thousand, which shows the magic of compounding. Please note that I came up with the 30 year time horizon. This wasn't part of the assignment.
With that said, compounding is fun. It's also low-maintenance. The tricky part is building a great portfolio to work with. Once investors have taken care of that, the only thing left to do is monitor the portfolio and consistently add new cash.
A 50/50 Portfolio That Makes Sense - To Me
Let's start with the ETFs.
50% ETFs
I believe that a 50% ETF strategy is great for people who want to incorporate single stocks but who also like to avoid the risks that come with a 100% single-stock portfolio.
Countless people who I advise and or discuss investments with follow a similar strategy.
In this case, the person this article is about owns the Schwab U.S. Dividend Equity ETF ( SCHD ) and the Vanguard S&P 500 Fund ( VOO ). This is a smart move. SCHD is one of the best high-yield ETFs on the market, with a 3.6% yield and a 0.06% expense ratio. I discuss SCHD in this article . VOO is an S&P 500 ETF with a 0.03% expense ratio.
By buying these two ETFs, investors get access to high-quality high-yield dividend growth stocks and the S&P 500. By adding the S&P 500, investors improve their portfolio performance in times when dividend stocks tend to underperform. Most recently, this happened in 2020 and the start of 2021, when low rates and low inflation boosted growth stocks.
While there's no need to change this composition, I would make one adjustment if I were to implement this strategy using my own money.
Investors who have at least 10-20 years until retirement might benefit from adding a bit more growth. I would buy three ETFs instead of two.
- The high-yield SCHD ETF with 1/3 ETF exposure.
- The Vanguard Total Stock Market ETF ( VTI ) with 1/3 exposure.
- The Invesco QQQ ETF ( QQQ ) with 1/3 exposure.
By purchasing a combination of diversified high-yield securities, an ETF that tracks the Nasdaq-100 for growth, and the VTI ETF for exposure to a well-diversified stock market, investors can achieve a balanced and diversified portfolio.
After all, by adding a growth-focused ETF, there's no need to buy the S&P 500 for outperformance. Investors can pick an ETF with even better diversification.
Moreover, by adding QQQ, investors do not necessarily need to focus on dividend growth stocks in the technology sector. Buying dividend growth stocks in the tech space is very tricky as the best tech stocks are usually the ones with high growth, not the ones with mature business models and high cash flows. I know that stocks like Apple ( AAPL ) and Microsoft ( MSFT ) are expectations, but I think people get my point. It's very hard to combine dividend growth with high-growth tech.
50% Stocks
As I'm a stock guy, this part is my favorite.
I asked the person who contacted me to provide me with a list of stocks he's considering adding to his portfolio.
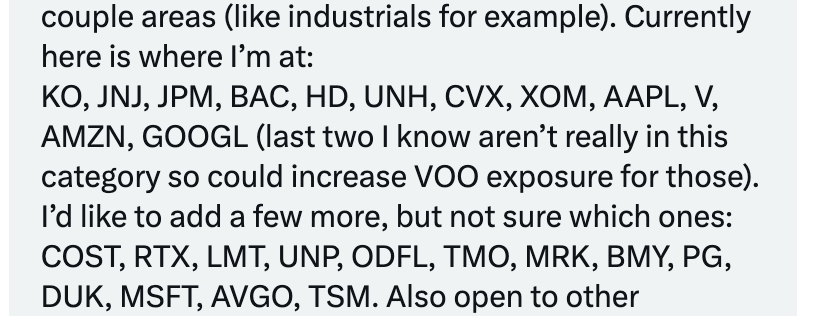
First of all, that's a decent list, and buying all of these stocks wouldn't be an issue.
However, I have some suggestions - especially for people who aren't close to retirement (not dependent on a high yield).
- I wouldn't necessarily buy Coca-Cola ( KO ). I have nothing against this company. If you own it: great. However, I do not like the risk/reward. Growth is slow, and its dividend yield of 2.9% isn't high enough to justify buying this soda giant.
- In a portfolio with a limited number of single stocks, I wouldn't buy two oil majors. While I believe that owning oil is important (as discussed in this article ), there's no need to buy both Exxon Mobil ( XOM ) and Chevron ( CVX ). I own both, but I have a 21-stock portfolio.
- I would not buy both Bank of America ( BAC ) and JPMorgan ( JPM ). I would prefer JPM due to its faster growth and less exposure to traditional banking.
- Buying Apple ( AAPL ), Amazon ( AMZN ), and Alphabet ( GOOGL ) might be a smart move. However, there's no need for that, as I added QQQ to the model portfolio. That said, investors can still add 1-2 growth stocks if they feel comfortable researching the tech space. Especially AAPL is doing a great job turning into a tech dividend growth stock.
On a side note, the list of potential picks made my heart beat a little bit faster, as it includes some of my all-time favorite dividend (growth) stocks.
That said, on that list, I have an issue with Bristol-Myers Squibb ( BMY ). It's a great company, yet I am not a big fan of the risk/reward for younger dividend growth investors (similar to my KO comments).
Furthermore, I wouldn't buy the Taiwan Semiconductor ( TSM ). This decision is 100% personal and based on two issues:
- I'm not sure what to make of the long-term situation between China and Taiwan. I have a hard time assessing the geopolitical risks that could impact TSM.
- Semiconductors are the backbone of our modern technology. We don't need TSM if we own QQQ already. They are somewhat related.
Again, TSM might be a massive outperformer in the future. I just wanted to share my thought process when it comes to stock picking and long-term portfolio building.
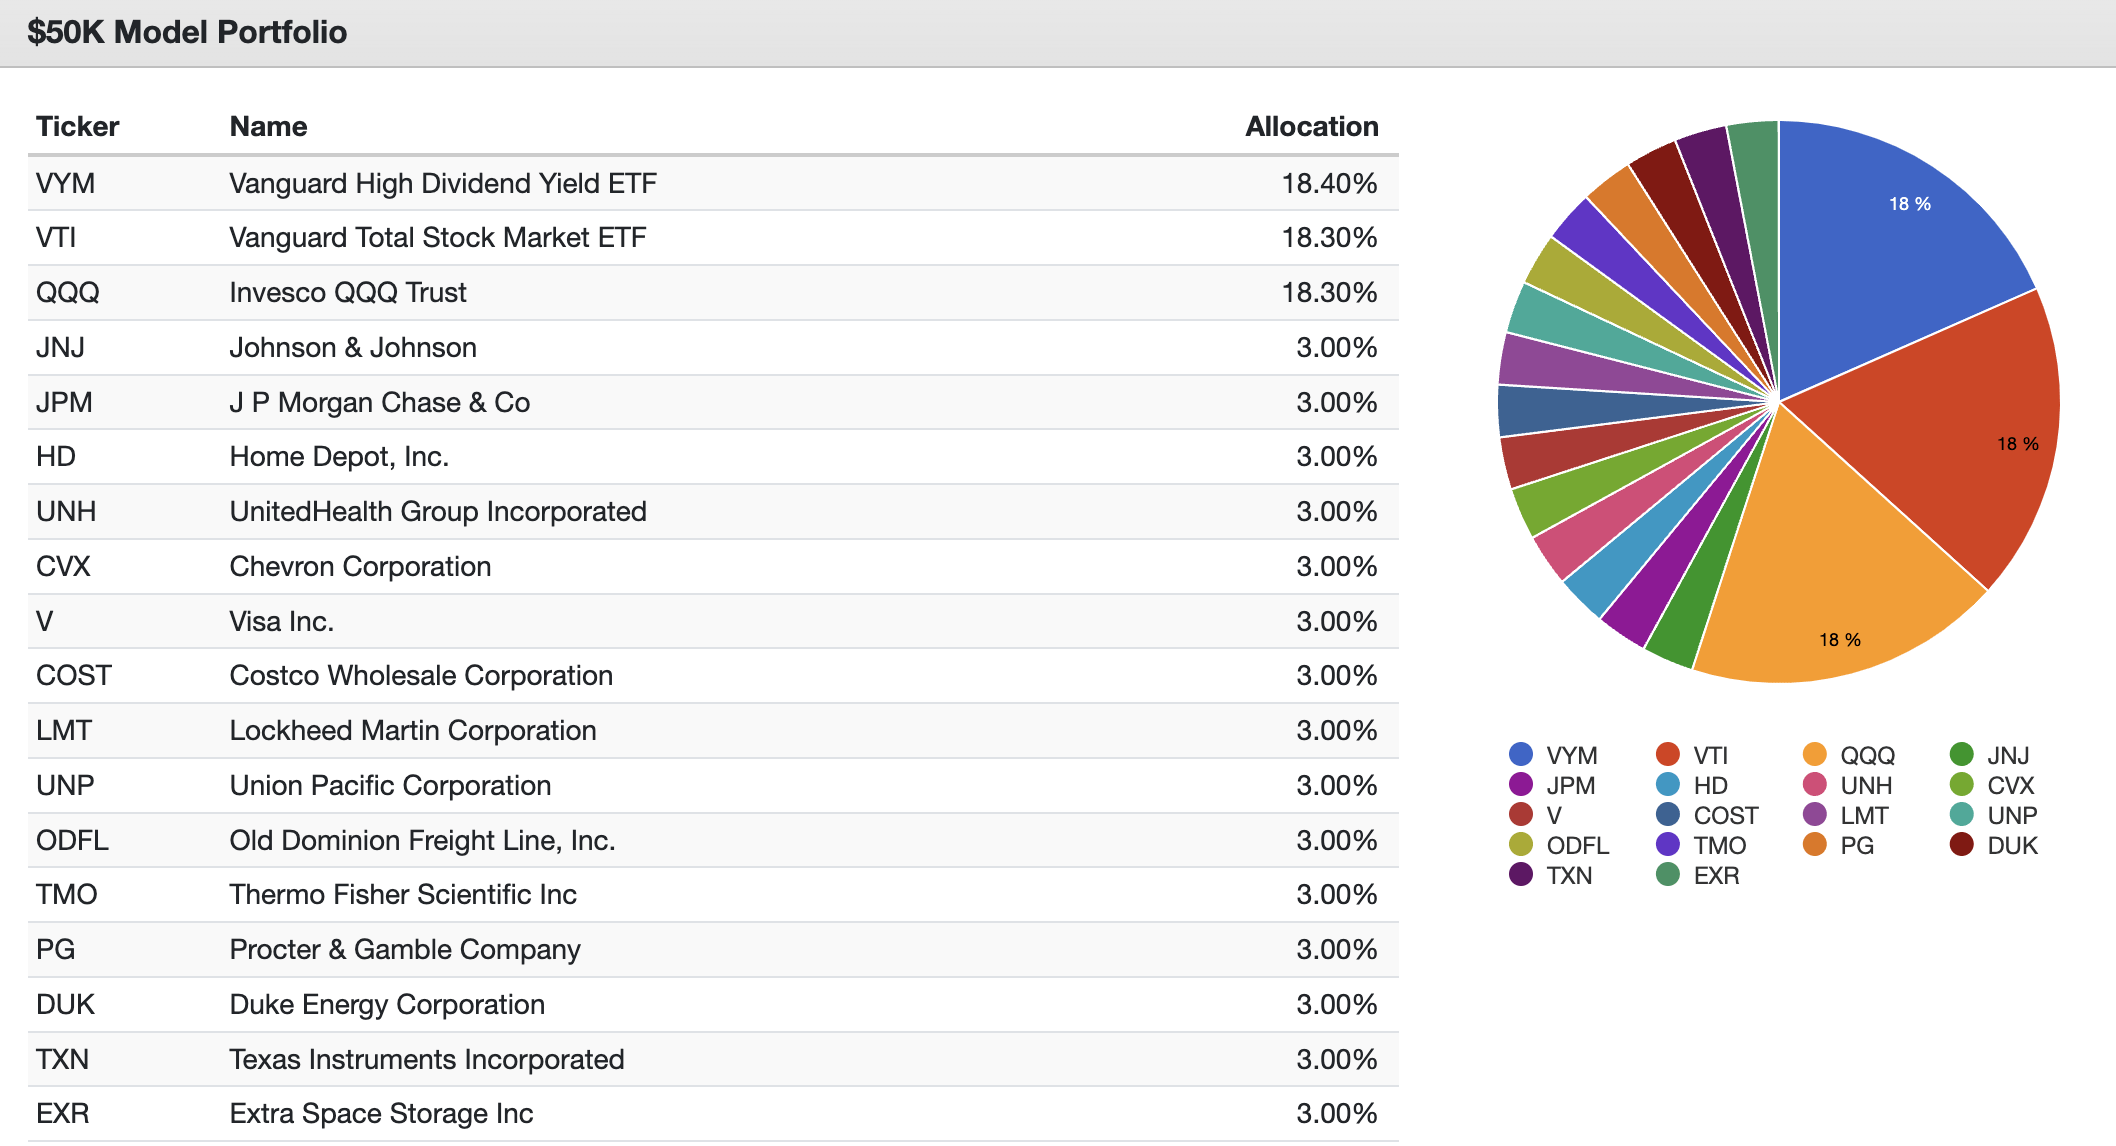
With that said, while multiple roads lead to Rome, here are my 15 picks. Please note that I added links to some of my articles.
| Name |
| Industry |
| Div. Yield |
| Div. 5Y CAGR |
| Payout Ratio |
| JOHNSON & JOHNSON ( JNJ ) |
| Pharmaceuticals |
| 2.9% |
| 6.1% |
| 44% |
| JPMORGAN CHASE & CO. ( JPM ) |
| Banking Services |
| 2.9% |
| 12.9% |
| 30% |
| THE HOME DEPOT, INC. ( HD ) |
| Specialty Retailers |
| 2.8% |
| 16.0% |
| 47% |
| UNITEDHEALTH GROUP INCORPORATED ( UNH ) |
| Healthcare Providers & Services |
| 1.4% |
| 17.0% |
| 29% |
| CHEVRON CORPORATION ( CVX ) |
| Oil & Gas |
| 3.6% |
| 5.8% |
| 30% |
| VISA INC. ( V ) |
| Software & IT Services |
| 0.8% |
| 18.0% |
| 21% |
| COSTCO WHOLESALE CORPORATION ( COST ) |
| Diversified Retail |
| 0.8% |
| 12.5% |
| 26% |
| LOCKHEED MARTIN CORPORATION ( LMT ) |
| Aerospace & Defense |
| 2.5% |
| 8.7% |
| 42% |
| UNION PACIFIC CORPORATION ( UNP ) |
| Freight & Logistics Services |
| 2.6% |
| 14.8% |
| 46% |
| OLD DOMINION FREIGHT LINE, INC. ( ODFL ) |
| Freight & Logistics Services |
| 0.5% |
| 35.3% |
| 10% |
| THERMO FISHER SCIENTIFIC INC. ( TMO ) |
| Healthcare Equipment & Supplies |
| 0.2% |
| 15.1% |
| 5% |
| THE PROCTER & GAMBLE COMPANY ( PG ) |
| Personal & Household Products & Services |
| 2.4% |
| 5.7% |
| 64% |
| DUKE ENERGY CORPORATION ( DUK ) |
| Electrical Utilities & IPPs |
| 4.1% |
| 2.6% |
| 75% |
| TEXAS INSTRUMENTS INCORPORATED ( TXN ) |
| Semiconductors & Semiconductor Equipment |
| 2.8% |
| 16.4% |
| 48% |
| EXTRA SPACE STORAGE INC. ( EXR ) |
| Residential & Commercial REIT |
| 4.3% |
| 14.4% |
| 73% |
- Average dividend yield: 2.3%
- Weighted average dividend 5Y CAGR: 11.0%
As the numbers above show, this well-diversified portfolio of 15 stocks has an average yield of 2.3% and an average weighted dividend growth rate of 11.0% per year.
The portfolio includes both slow-growing high-yield stocks and stocks with very low yields but high growth rates.
One major drawdown of managing 15 individual stocks with a monthly cash flow of $400 to $500 is that it may take a while until new investments can be made - unless you pick a broker that lets you invest in fractional shares.
- As previously discussed, I added just one oil stock. I also added one bank and one financial service provider. I added two healthcare companies. One insurance company and one equipment provider. I added both defensive and cyclical consumer exposure, two industrial transportation stocks, one boring utility stock with a decent yield, one real estate stock with high growth, and one defense giant.
Portfolio Performance
A few important notes.
- Please note that I replaced the SCHD ETF with the Vanguard High Dividend Yield ETF ( VYM ) in the portfolio below. That is purely based on the fact that VYM allows me to backtest going back to 2008. While I like VYM, I still recommend investors buy SCHD instead.
- I gave the ETFs 55% exposure, as I went with three ETFs instead of two.
- This portfolio is based on annual rebalancing. The way I do it is by consistently buying the smallest stocks in my portfolio.
- The portfolio is based on an initial investment of $50K and a regular monthly investment of $450.
- We're backtesting, which includes a survivor basis. We obviously do not include stocks that have performed poorly over the past few years. There is no guarantee that we would not have included some of these stocks if I had written this article in 2008. To somewhat combat this bias, I picked companies that I trust to remain strong performers, which includes wide-moat business models and healthy balance sheets.
With all of this in mind, let's discuss the performance.
- Going back to 2008, this portfolio has returned 21% per year. The money-weighted rate of return (internal rate of return) was 17%.
- A $50,000 investment in 2008 would have turned into more than $750,000 with support from regular monthly $450 investments.
- The S&P 500 returned 17.4% during this period, with an internal rate of return of 13.0%.
- These returns are wild and amplified by the fact that this model starts close to the bottom of the Great Financial Crisis.
- The standard deviation of this portfolio is 14.4%, which is below the market's standard deviation. It has caused the risk/adjusted return (Sharpe Ratio) to come in at 1.14, well above the Sharpe Ratio of the market.
- The worst drawdown was less than 20%, which is slightly better compared to the market.
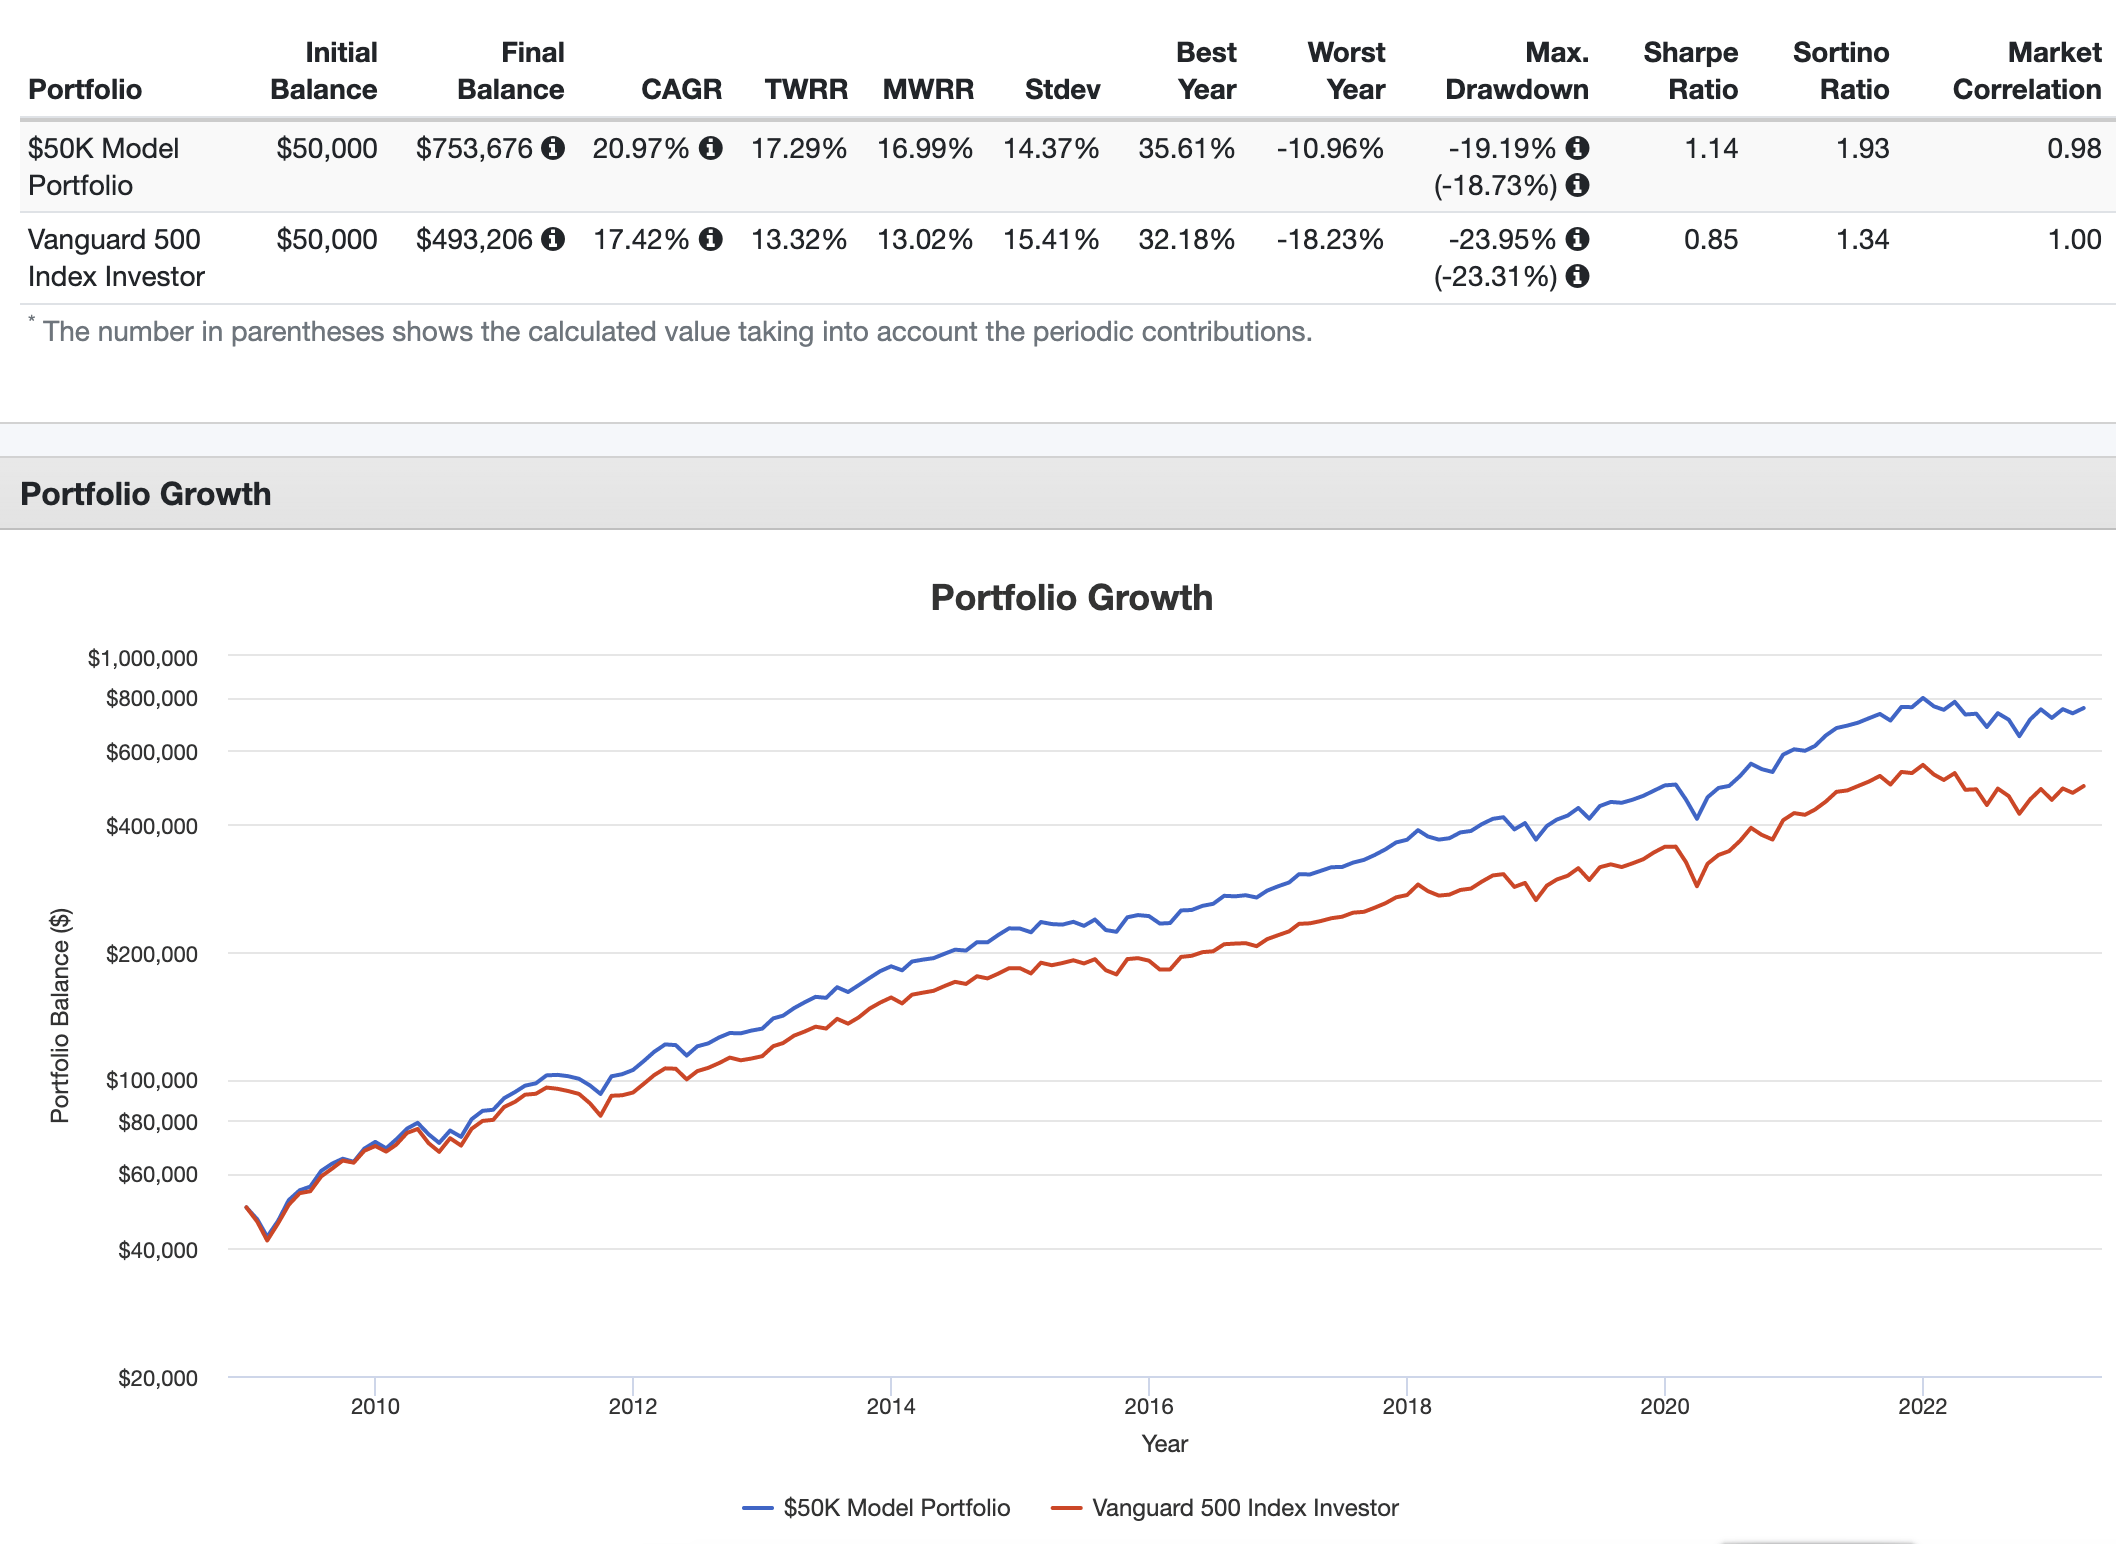
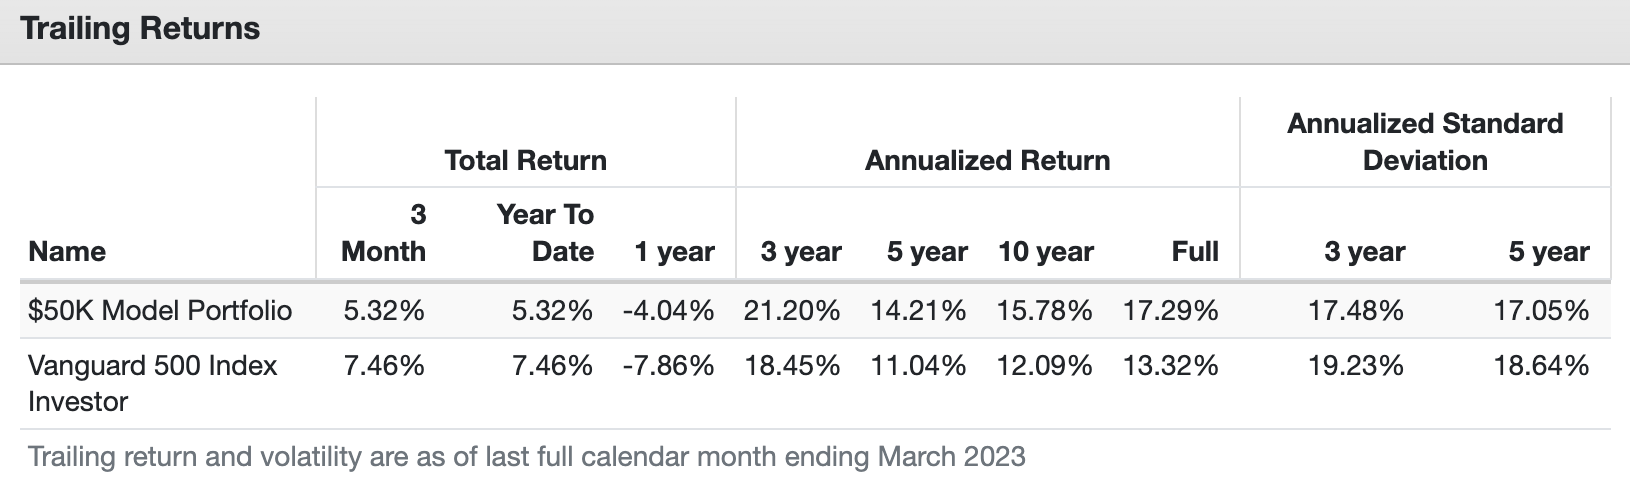
Based on this context, it's important to mention that this portfolio has consistently outperformed the market. Over the past ten years, this portfolio has returned 15.8% per year. Over the past five years, that number was 14.2%. It has consistently beaten the market with lower volatility.
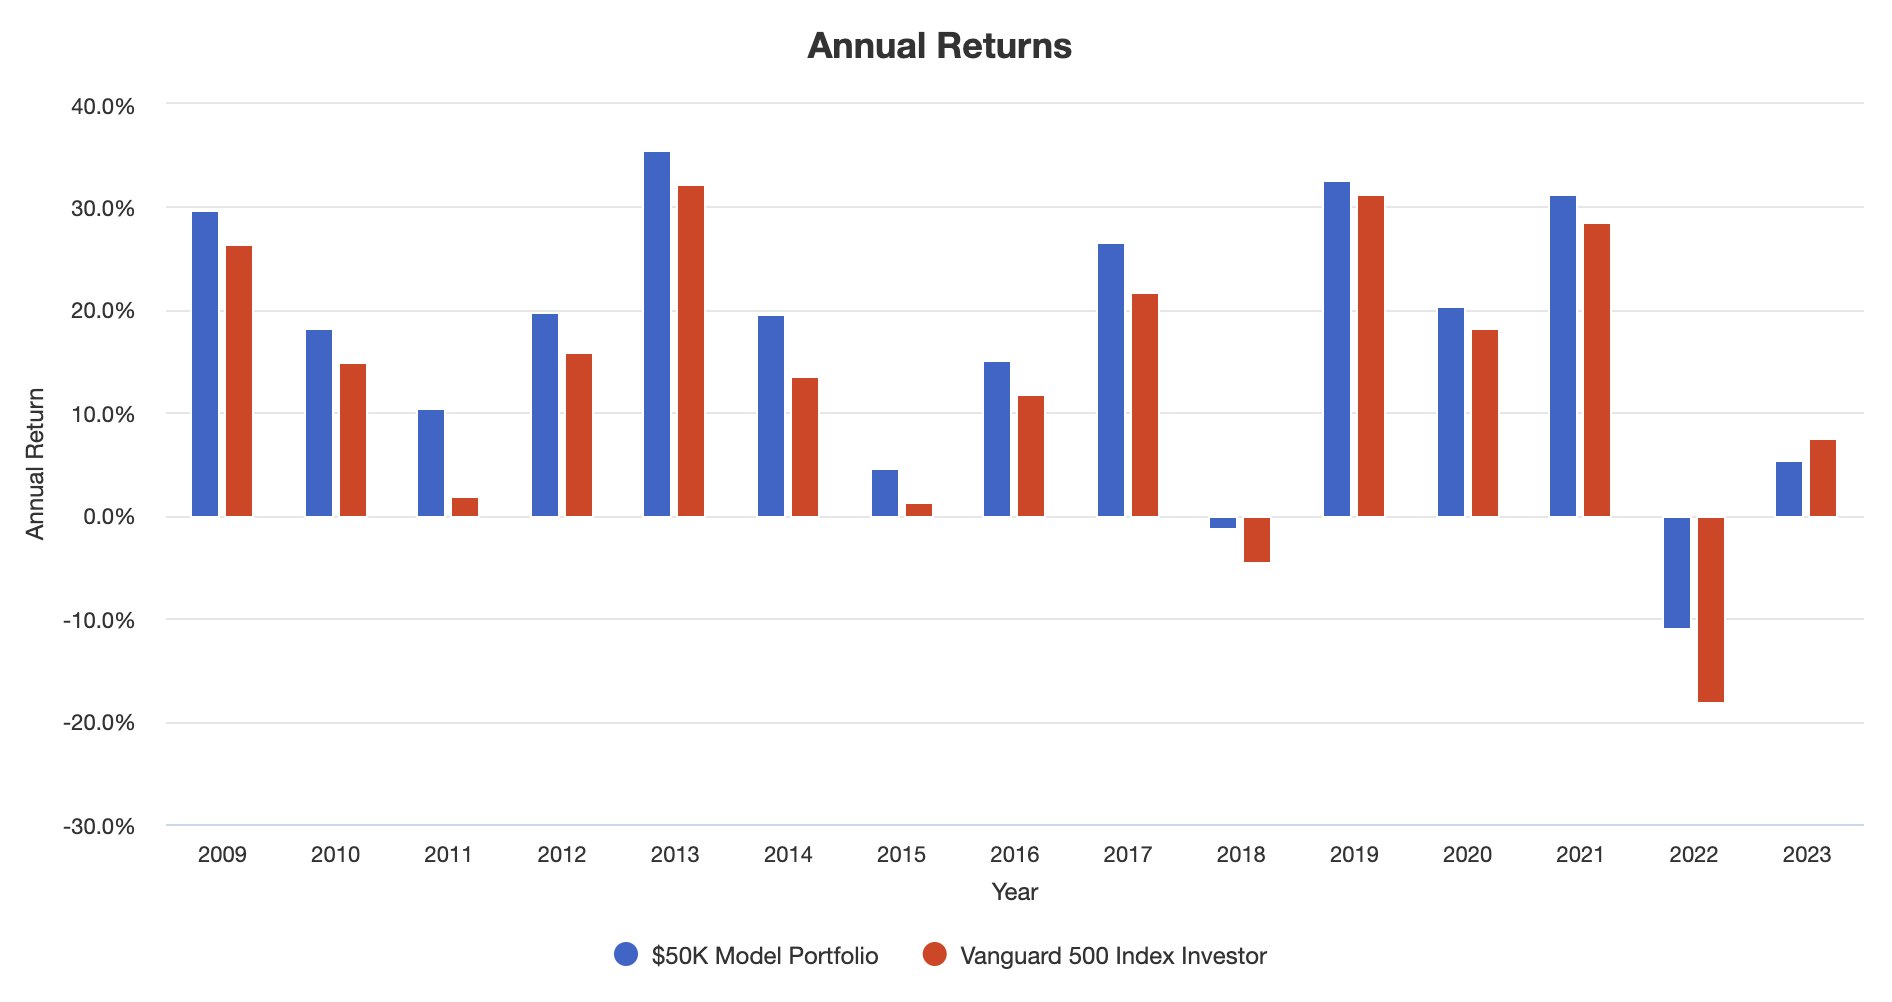
Furthermore, this model portfolio outperformed the market in almost every strong year and during every negative year. This is what makes the risk/reward so attractive.
Also, with regard to dividend growth, this is what the portfolio's income looks like:
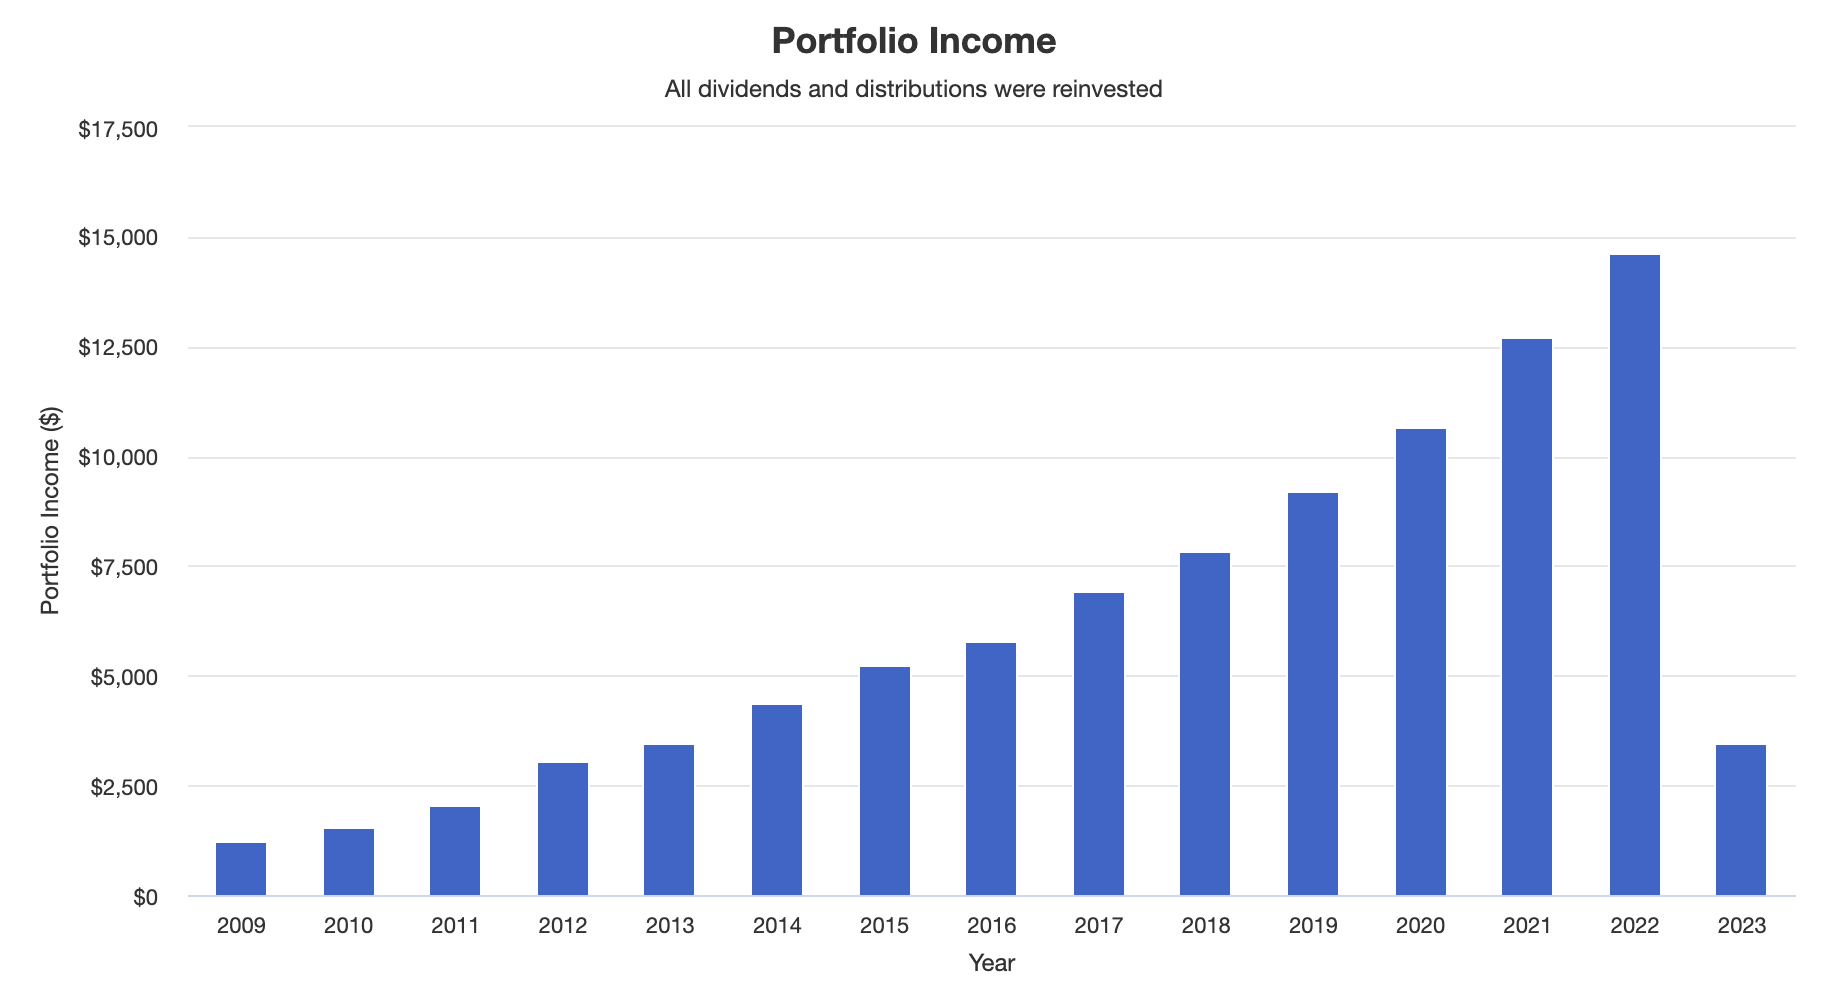
I expect outperforming capital gains with subdued volatility and high dividend growth to continue for many years/decades (which is why I'm writing this article).
The table below shows the performance per individual asset.
| Ticker | Name | CAGR | Stdev | Best Year | Worst Year | Max Drawdown | Sharpe Ratio | Sortino Ratio | Market Correlation |
|---|---|---|---|---|---|---|---|---|---|
| VYM | |||||||||
| Vanguard High Dividend Yield ETF | |||||||||
| 11.80% | |||||||||
| 14.81% | |||||||||
| 30.08% | |||||||||
| -5.91% | |||||||||
| -24.85% | |||||||||
| 0.79 | |||||||||
| 1.22 | |||||||||
| 0.93 | |||||||||
| VTI | |||||||||
| Vanguard Total Stock Market ETF | |||||||||
| 13.35% | |||||||||
| 15.85% | |||||||||
| 33.45% | |||||||||
| -19.51% | |||||||||
| -24.81% | |||||||||
| 0.83 | |||||||||
| 1.31 | |||||||||
| 1.00 | |||||||||
| QQQ | |||||||||
| Invesco QQQ Trust | |||||||||
| 19.25% | |||||||||
| 17.94% | |||||||||
| 54.68% | |||||||||
| -32.58% | |||||||||
| -32.58% | |||||||||
| 1.04 | |||||||||
| 1.80 | |||||||||
| 0.91 | |||||||||
| JNJ | |||||||||
| Johnson & Johnson | |||||||||
| 10.10% | |||||||||
| 15.21% | |||||||||
| 34.62% | |||||||||
| -11.64% | |||||||||
| -15.73% | |||||||||
| 0.67 | |||||||||
| 1.08 | |||||||||
| 0.55 | |||||||||
| JPM | |||||||||
| J P Morgan Chase & Co | |||||||||
| 13.27% | |||||||||
| 27.27% | |||||||||
| 47.27% | |||||||||
| -19.97% | |||||||||
| -37.10% | |||||||||
| 0.57 | |||||||||
| 0.90 | |||||||||
| 0.76 | |||||||||
| HD | |||||||||
| Home Depot, Inc. | |||||||||
| 22.57% | |||||||||
| 21.48% | |||||||||
| 59.50% | |||||||||
| -21.98% | |||||||||
| -33.09% | |||||||||
| 1.03 | |||||||||
| 1.83 | |||||||||
| 0.68 | |||||||||
| UNH | |||||||||
| UnitedHealth Group Incorporated | |||||||||
| 24.08% | |||||||||
| 21.90% | |||||||||
| 45.21% | |||||||||
| -10.54% | |||||||||
| -30.64% | |||||||||
| 1.07 | |||||||||
| 1.81 | |||||||||
| 0.50 | |||||||||
| CVX | |||||||||
| Chevron Corporation | |||||||||
| 9.95% | |||||||||
| 25.06% | |||||||||
| 58.48% | |||||||||
| -25.97% | |||||||||
| -40.69% | |||||||||
| 0.48 | |||||||||
| 0.81 | |||||||||
| 0.66 | |||||||||
| V | |||||||||
| Visa Inc. | |||||||||
| 22.96% | |||||||||
| 20.96% | |||||||||
| 67.86% | |||||||||
| -18.99% | |||||||||
| -27.28% | |||||||||
| 1.07 | |||||||||
| 1.90 | |||||||||
| 0.60 | |||||||||
| COST | |||||||||
| Costco Wholesale Corporation | |||||||||
| 19.73% | |||||||||
| 19.11% | |||||||||
| 51.81% | |||||||||
| -19.06% | |||||||||
| -20.32% | |||||||||
| 1.01 | |||||||||
| 1.69 | |||||||||
| 0.59 | |||||||||
| LMT | |||||||||
| Lockheed Martin Corporation | |||||||||
| 16.51% | |||||||||
| 20.92% | |||||||||
| 68.02% | |||||||||
| -16.33% | |||||||||
| -24.32% | |||||||||
| 0.81 | |||||||||
| 1.34 | |||||||||
| 0.53 | |||||||||
| UNP | |||||||||
| Union Pacific Corporation | |||||||||
| 18.60% | |||||||||
| 22.92% | |||||||||
| 47.55% | |||||||||
| -32.85% | |||||||||
| -39.03% | |||||||||
| 0.83 | |||||||||
| 1.45 | |||||||||
| 0.74 | |||||||||
| ODFL | |||||||||
| Old Dominion Freight Line, Inc. | |||||||||
| 29.86% | |||||||||
| 27.98% | |||||||||
| 84.15% | |||||||||
| -23.92% | |||||||||
| -32.34% | |||||||||
| 1.06 | |||||||||
| 1.90 | |||||||||
| 0.64 | |||||||||
| TMO | |||||||||
| Thermo Fisher Scientific Inc | |||||||||
| 22.35% | |||||||||
| 20.78% | |||||||||
| 75.78% | |||||||||
| -18.77% | |||||||||
| -31.29% | |||||||||
| 1.05 | |||||||||
| 1.93 | |||||||||
| 0.56 | |||||||||
| PG | |||||||||
| Procter & Gamble Company | |||||||||
| 9.59% | |||||||||
| 15.62% | |||||||||
| 39.70% | |||||||||
| -9.95% | |||||||||
| -23.30% | |||||||||
| 0.63 | |||||||||
| 1.03 | |||||||||
| 0.43 | |||||||||
| DUK | |||||||||
| Duke Energy Corporation | |||||||||
| 10.43% | |||||||||
| 15.53% | |||||||||
| 30.25% | |||||||||
| -10.76% | |||||||||
| -18.80% | |||||||||
| 0.68 | |||||||||
| 1.06 | |||||||||
| 0.30 | |||||||||
| TXN | |||||||||
| Texas Instruments Incorporated | |||||||||
| 22.06% | |||||||||
| 22.35% | |||||||||
| 71.84% | |||||||||
| -9.90% | |||||||||
| -25.91% | |||||||||
| 0.98 | |||||||||
| 1.76 | |||||||||
| 0.75 | |||||||||
| EXR | |||||||||
| Extra Space Storage Inc | |||||||||
| 25.62% | |||||||||
| 25.82% | |||||||||
| 100.95% | |||||||||
| -32.81% | |||||||||
| -44.02% | |||||||||
| 0.99 | |||||||||
| 1.75 | |||||||||
| 0.47 |
- There are some outliers like ODFL, TMO, HD, and EXR. These stocks benefited from the massive bull market, low rates, and the fact that this portfolio started in 2008. While I expect these returns to come down a bit in the future, I still believe that these stocks will contribute to (significant) outperformance.
Takeaway
In this article, we discussed a model portfolio and a strategy that is likely to help dividend (growth) investors accumulate wealth. In this case, I used the requirements of a follower who aims to build a portfolio consisting of ETFs and dividend stocks with $50,000 and consistent monthly contributions.
The model portfolio presented in this portfolio fits this strategy, and it can be used in a wide variety of other situations, regardless of whether investors start with more or less money.
While multiple roads lead to Rome, I believe that a mix between ETFs and high-quality single stocks can allow investors to generate high returns on a long-term basis with subdued volatility.
The model portfolio presented in this article has consistently beaten the market with a more favorable risk/reward.
Hence, I believe that the stock picks in this portfolio are a great way to get started and to further improve existing portfolios. I own a lot of the picks in my personal portfolio and have a number of them on my watchlist.
With all of this said, let me know what you think of these picks. Did you like anything or disagree with certain parts? I hope to incorporate as many comments as possible in my next article. I also want to thank readers for participating in past discussions, which are truly the foundation for articles like this one.
For further details see:
The $50,000 Dividend Portfolio: Your Path To Financial Freedom