ACTV - The Private Domestic Sector Prints A $295B Deficit In April Pointing To Down Markets In May
2023-05-12 03:54:34 ET
Summary
- The private domestic sector balance decreased by $295+ billion in April 2023 with headwinds in all sectors.
- Bank credit retraction was -$62+ billion as more loans were repaid or written off than were created. The four-month drop continues.
- The seasonal pattern is downwards now into summer 2023 and probably into Xmas 2023 as well. Crowned with a Fed-induced recession.
- The Fed's demand destruction policy has baked a recession into the economic pie for the end of this year or the beginning of next.
The purpose of this article is to examine the USA sectoral flows for April 2023 and assess the likely impact on markets as we advance into May 2023. This is pertinent, as a change in the fiscal flow rate has an approximately one-month-lagged effect on asset markets and is a useful investment forecasting tool. Other macro-fiscal flows can point to events months or years ahead.
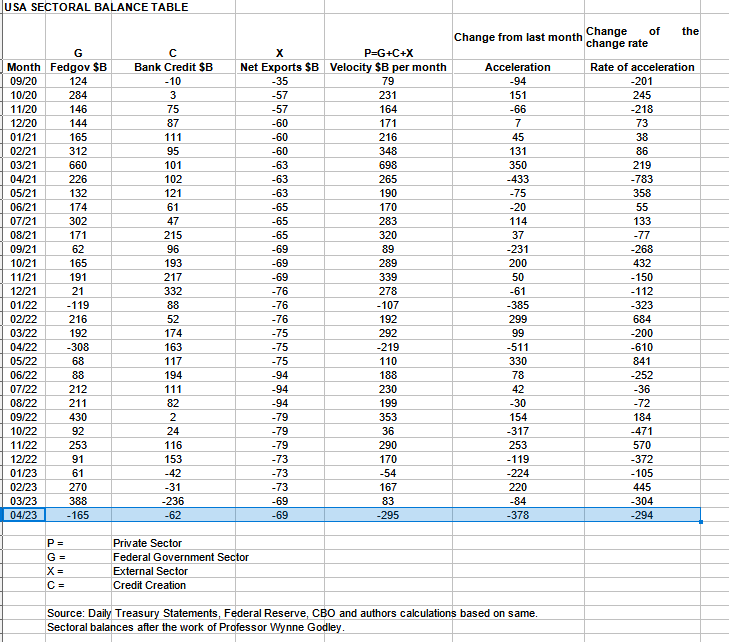
The table below shows the sectoral balances for the USA which are produced from the national accounts.
A big minus for the private domestic sector in April, even bigger than the year before, this starts off the summer slowdown, and the tax collection in June crowns it, and then the seasonal averages recover from there into an end-of-year rally. However, with the Fed raising rates and draining liquidity with QT, and thus transforming national income into interest income to banks that has no counterpart in real production of goods and services, a recession is more likely than an Xmas rally.
In April 2023, the domestic private sector recorded a $295B decline in financial balances overall and this is a damaging result.
From the table, one can see that the -$295+ billion private domestic sector drainage of funds came from a large -$165+ billion extraction of funds by the federal government [and this includes the new injection channel from the Fed of around $8.28B from interest on reserves that went directly into the banking sector], less -$62B+ billion of credit retraction from commercial banks [IE more loans were repaid or written off than were created] and less the -$69B+ billion that flowed out of the private domestic sector and into foreign bank accounts at the Fed in return for imported goods and services.
The rate of decline of bank credit retraction is slowing which is the only positive one could draw from this result.
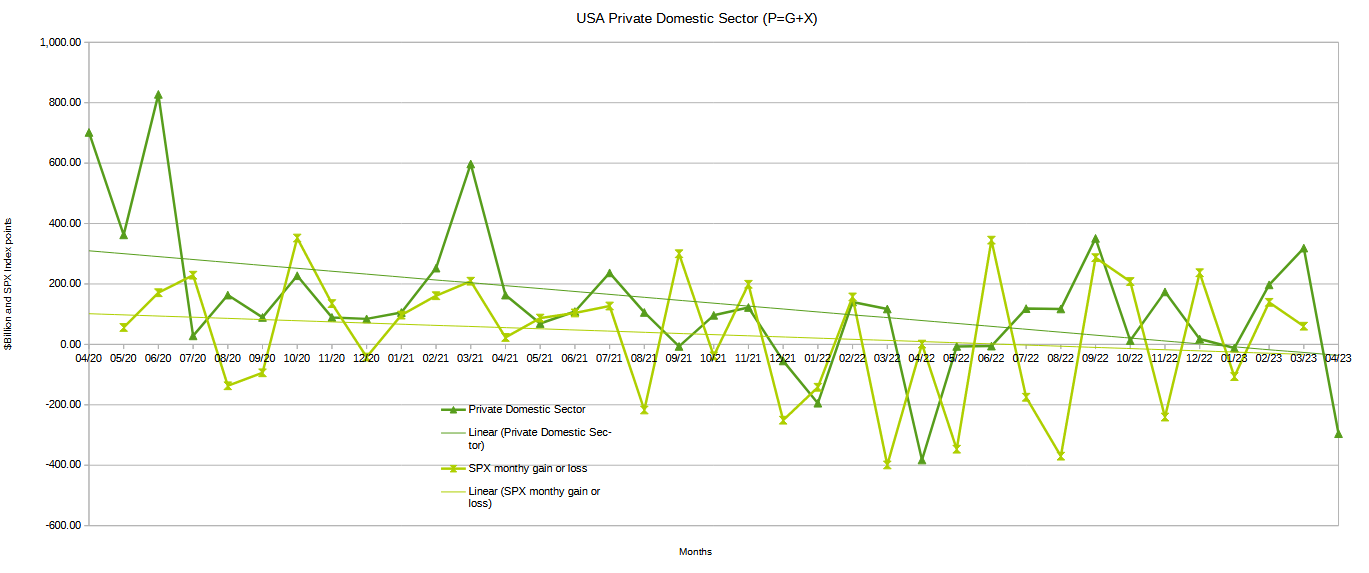
The chart below shows the sectoral balance data plotted in nominal terms. A trend line has been added to give an idea of the broad direction, which is downwards for both the private domestic sector (where asset markets are located) and the SPX. The calculation is Federal government spending or G plus the external sector (X and normally a negative factor) to leave that amount of money left to the private domestic sector or P by accounting identity true by definition.
The chart suggests that the SPX's next move would be downward following the downward move in the private domestic sector balance. You cannot extract $295B from the economy without there being a downside to asset markets of all types though the stock market being more liquid and leveraged than most will show the impact with the least lagged effect.
US Treasury and author calculations
The following chart emerges when one graphs the change rate of the information in the USA sectoral balances table above and adjusts for impact time lags. This is like a long-range market radar set.
US sectoral balance change rate basis
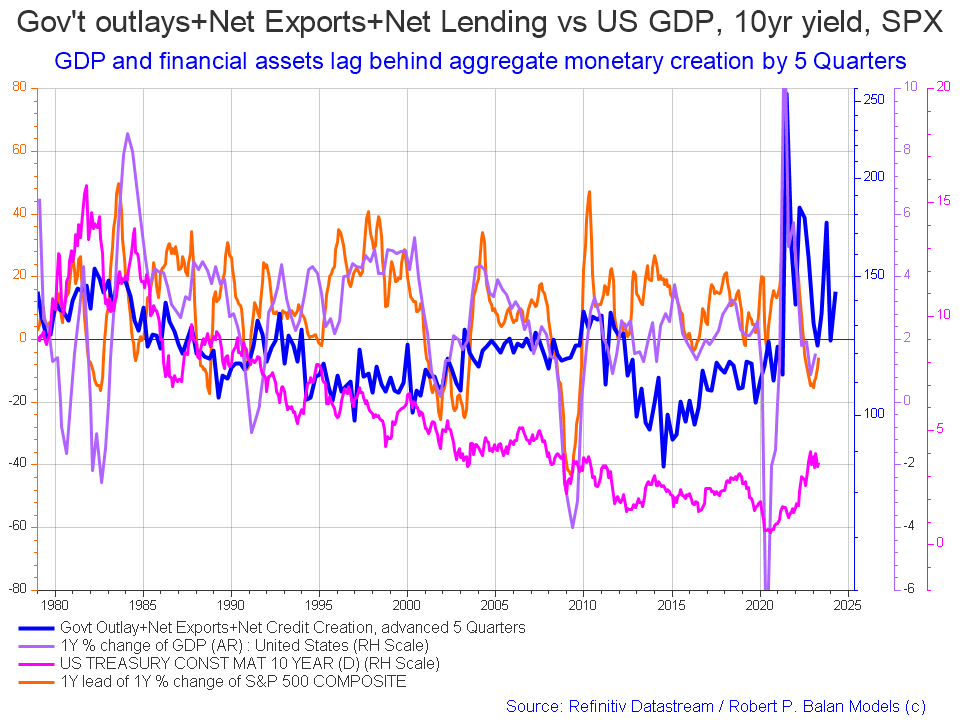
The blue line shows the fiscal impulse from federal government outlays plus bank credit creation and less the current account balance and leads by up to five quarters [a year and three months]. Short term, the orange SPX line appears to be trending back upwards to follow the leading blue line. Longer term the leading blue fiscal impulse line points to a major inflection downwards for markets in late 2024 or early 2025 and then a change of trend back upwards again, the uptick is the change from last month. Most likely the Fed-induced rate hike recession followed by a recovery once they have panicked and dropped rates down again.
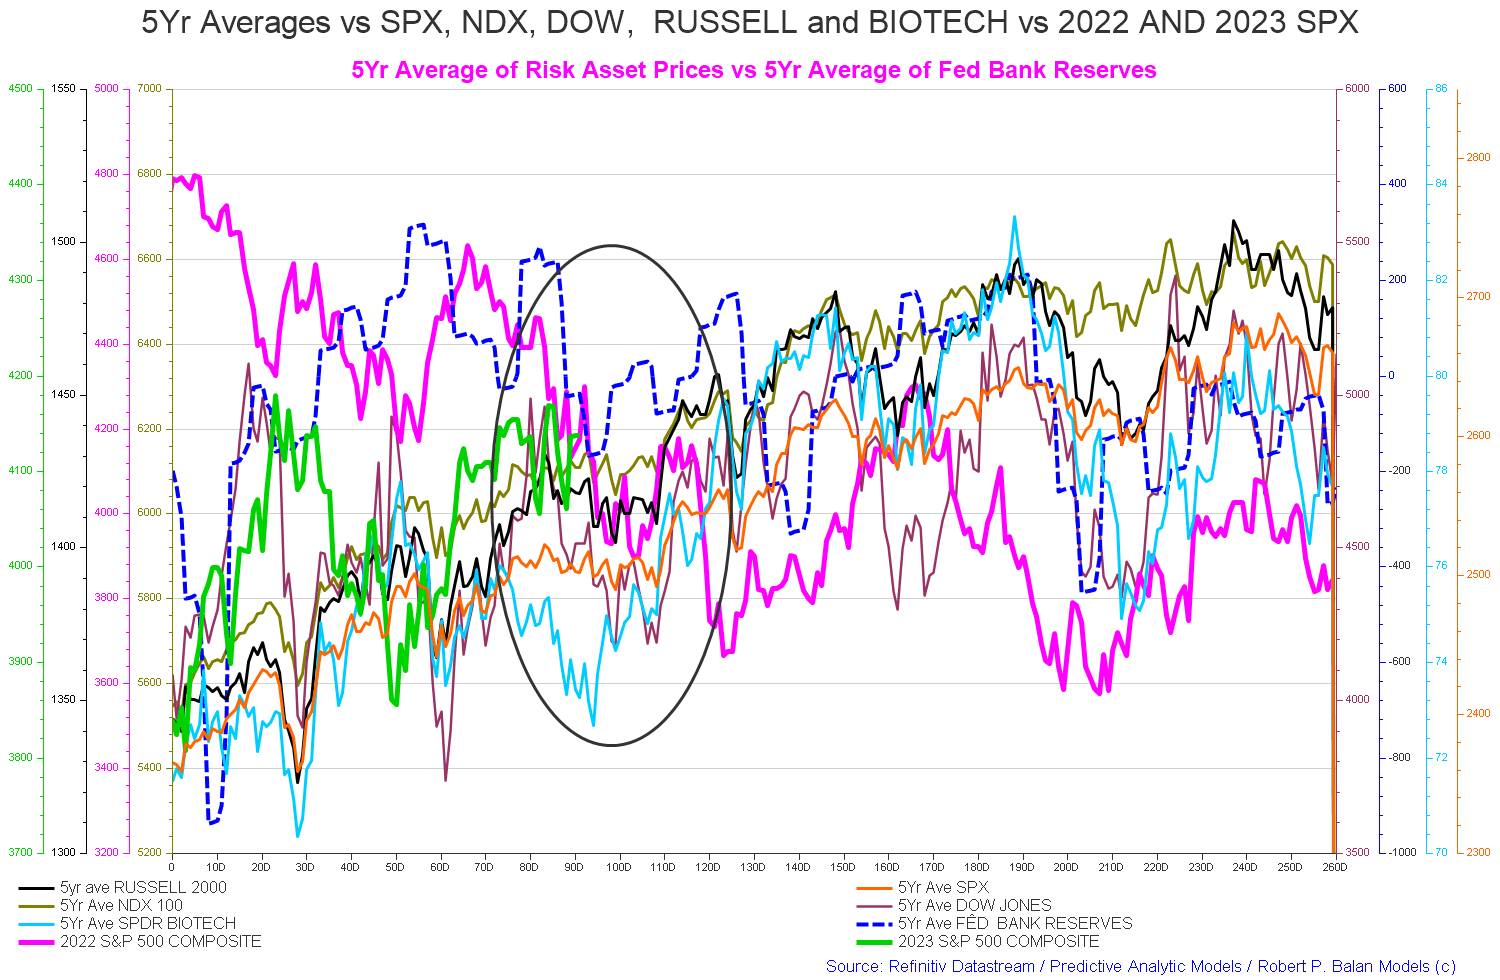
The chart below shows the five-year average of the seasonal stock market patterns for the SPX ( SPX ), NDX ( NDX ), Dow ( DIA ), Russell 2000 ( RTY ), and Biotech ( IBB ) market indexes. The black oval shows roughly where we are (trading day 93) at the time of writing and the end of the green line on the chart below.
The 5-year index averages call for a flat sideways movement falling into trading day 110 [Early June].
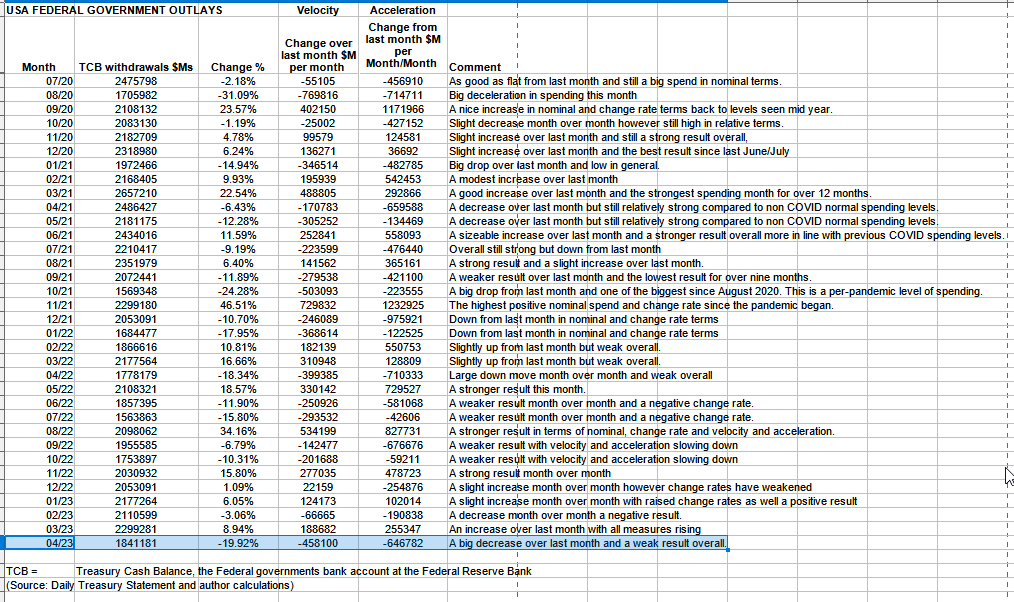
The table below shows the total federal government withdrawals from their account at the Federal Reserve Bank. A withdrawal by the federal government is a receipt/credit for the private sector and therefore a positive for asset markets.
US Treasury and author calculations
The table shows that total outlays were much lower than last month and that the monetary velocity and acceleration are negative.
The private-domestic sector balance took a big hit. There was a big tax take in April and a small overall spending way below replacement value and so the private domestic sector printed a big damaging deficit as the first table in this article shows.
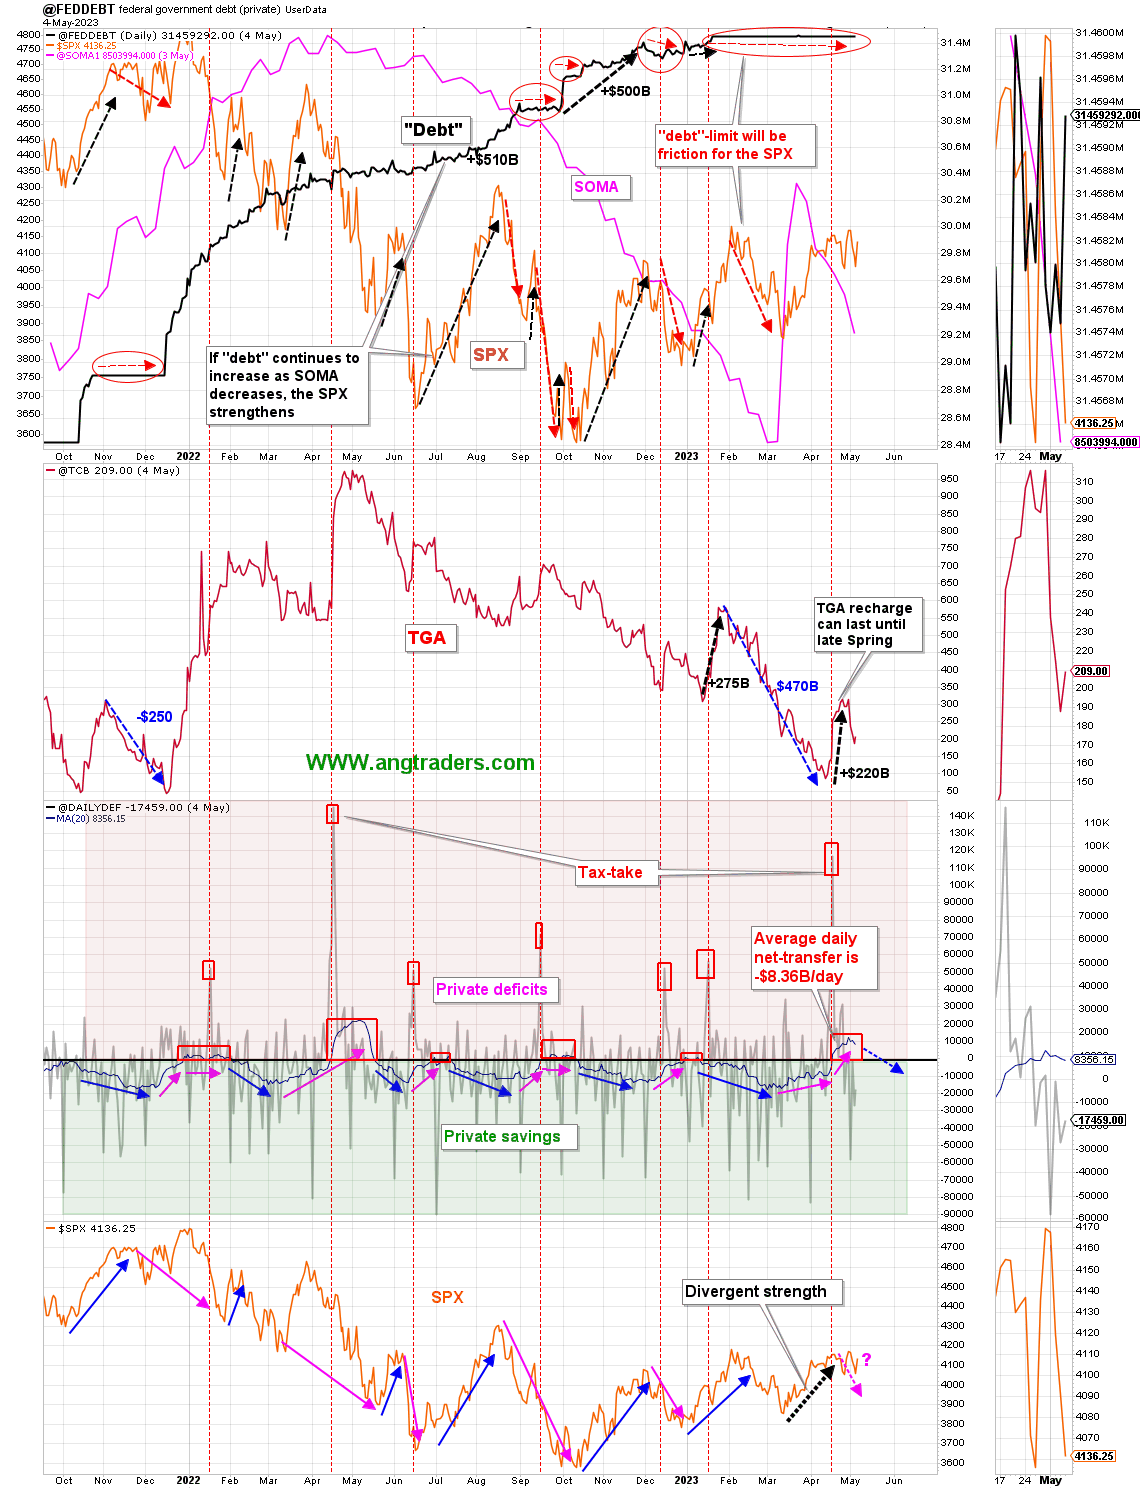
The chart below [bottom panel] shows graphically the relationship between the federal government (currency creator) and the private sector (currency user) and is from ANG Traders of the Away from the Herd SA Marketplace service. The bottom panel highlights in red and green the financial relationship between the currency creator and currency users. One's loss is the other's gain and vice versa.
- The 20-day MA of the daily net-transfers (from the Treasury to the private-sector economy) remains negative ( -$8.36B/day ) because of the Tax-take, but is starting to come back. The funds will now start to flow back into the private sector, but the average net-transfer will take a week or two before turning positive again. The May 15 interest payment will accelerate the positive net-transfers.
- The Fed continues to sell off its balance sheet, but thanks to the bank stabilization program it is being reduced from a significantly higher level.
- The tax-take recharged the TCB by ~$220B and now stands at $209B which will buy some time before the debt-ceiling potentially causes a Government shut-down (estimate is early June).
(Source: Mr. Nick Gomez, ANG Traders, Away from the Herd SA Market Service Weekly Report for Members).
The trend now is that the financial balance is moving in the direction of the red private sector deficit area and has been doing so since the end of February. That trend is about to exacerbate as a series of large federal tax collections are coming up over the next few months that give us the seasonal summer stock market low. Sell in May and go away. The April tax collection has come and gone and now the economy and markets will take another blow when the June tax collection occurs next month.
The above chart [top panel] shows the stock of T securities whose growth has flat-lined due to the debt limit crisis. Also shown in the lower panel is the SPX. The most striking line on the chart is the pink SOMA [Fed balance sheet] line. After months of destructive QT, about half of it was refunded to the banking sector as part of the recent bank-run rescue and now it has reversed the trend and is being drained out again.
At the White House in the last month, the debt limit impasse continues causing the Treasury to move ever deeper into its range of limited extraordinary measures to find money with which to fund the government instead of being able to create currency by issuing treasury securities of one form or another.
ANG Traders wrote a fine article all about the debt limit saga in this article where the comments section is as good a read as the main article itself whereby all the mainstream arguments are tabled, rehearsed, and then refuted by both ourselves and other readers.
The next Fed meeting on 14-15 June coincides with the same day as the next large federal tax collection where more bad news about rate rises and QT will compound the hit to asset markets from the drainage of liquidity that the tax extraction causes.
At the last Fed meeting the interest rate was raised again and one of the prime comments from the Chairman was as follows:
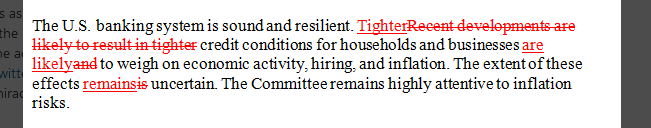
The red areas are the words used last time and highlight changes made since then. It is hard to reconcile that official FOMC statement with the following work by Professor Amit Seru from Stanford University.
Professor Amit Seru Stanford University
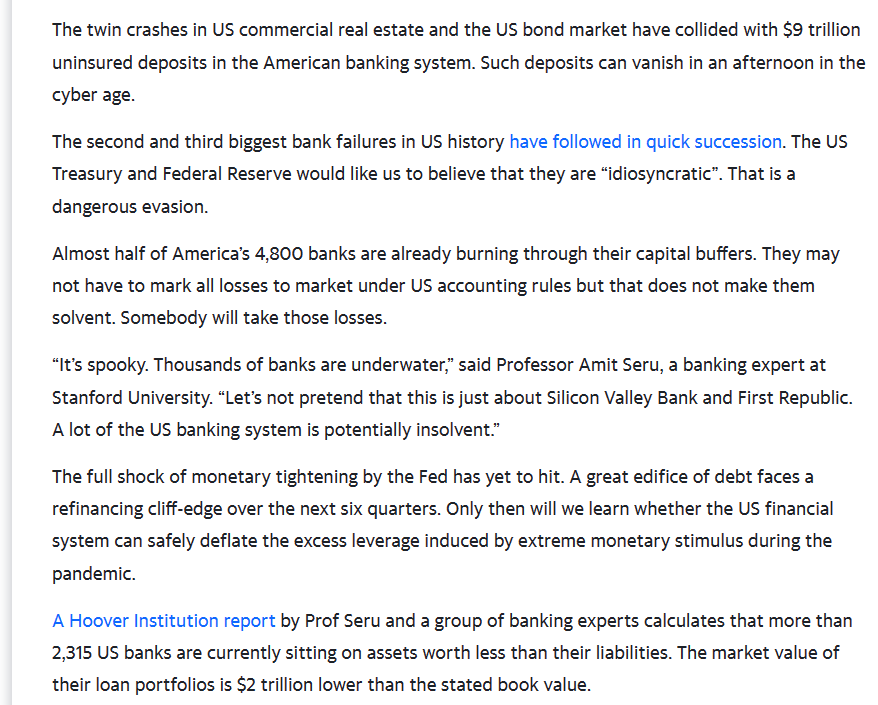
Federal Reserve Chairman Powell reminds me of Lord Admiral Nelson holding up his telescope to his blind eye and declaring
April 2nd, 1801. ‘I see no ships’
While before him lay the Danish fleet.Nelson won the day on that occasion whereas Powell is leading us into recession, unemployment, and bankruptcy, just like Fed Chairman Paul Volker did in the 70s and 80s.
And this crisis appears as though it is resolved by the Volcker shock. And essentially this is the point where in the late 1970s inflation is going out of control in the United States and Paul Volcker, who is regarded as a “sound money” man, is brought in as the new Federal Reserve chairman in order to deal with this problem.
And Volker does the only thing that capitalist country central banks know how to do — which is, the only way they know how to deal with inflation is to restrict money supply, and allow interest rates to rise as high as they want, a particularly rise above the rate of inflation, so that eventually by rising high enough they will create a recession and they will eventually — the recession will kill inflation, rather than any particularly deft monetary policy,
So this is what he did in 1978-79.
Well Volker was my old boss’s boss at Chase Manhattan, and I was the note taker on talks that he would give periodically to the banks. And when you say he was fighting inflation, he defined inflation as “what construction workers are paid.”
And he said, “I’m going to raise interest rates until I don’t see the wages of construction workers rising anymore.”
And they rose to a peak of twenty percent in 1980. And the important thing is that obviously with interest rates that high nobody could borrow to buy housing — you’re not going to pay a mortgage at twenty percent rate over thirty years. Companies couldn’t borrow.
But what this did was crash the stock market, the bond market, and the real estate market, by the interest rates.
(Source: Professor Michael Hudson 2023 )
Now there is a less-than-cheery prognosis for markets.
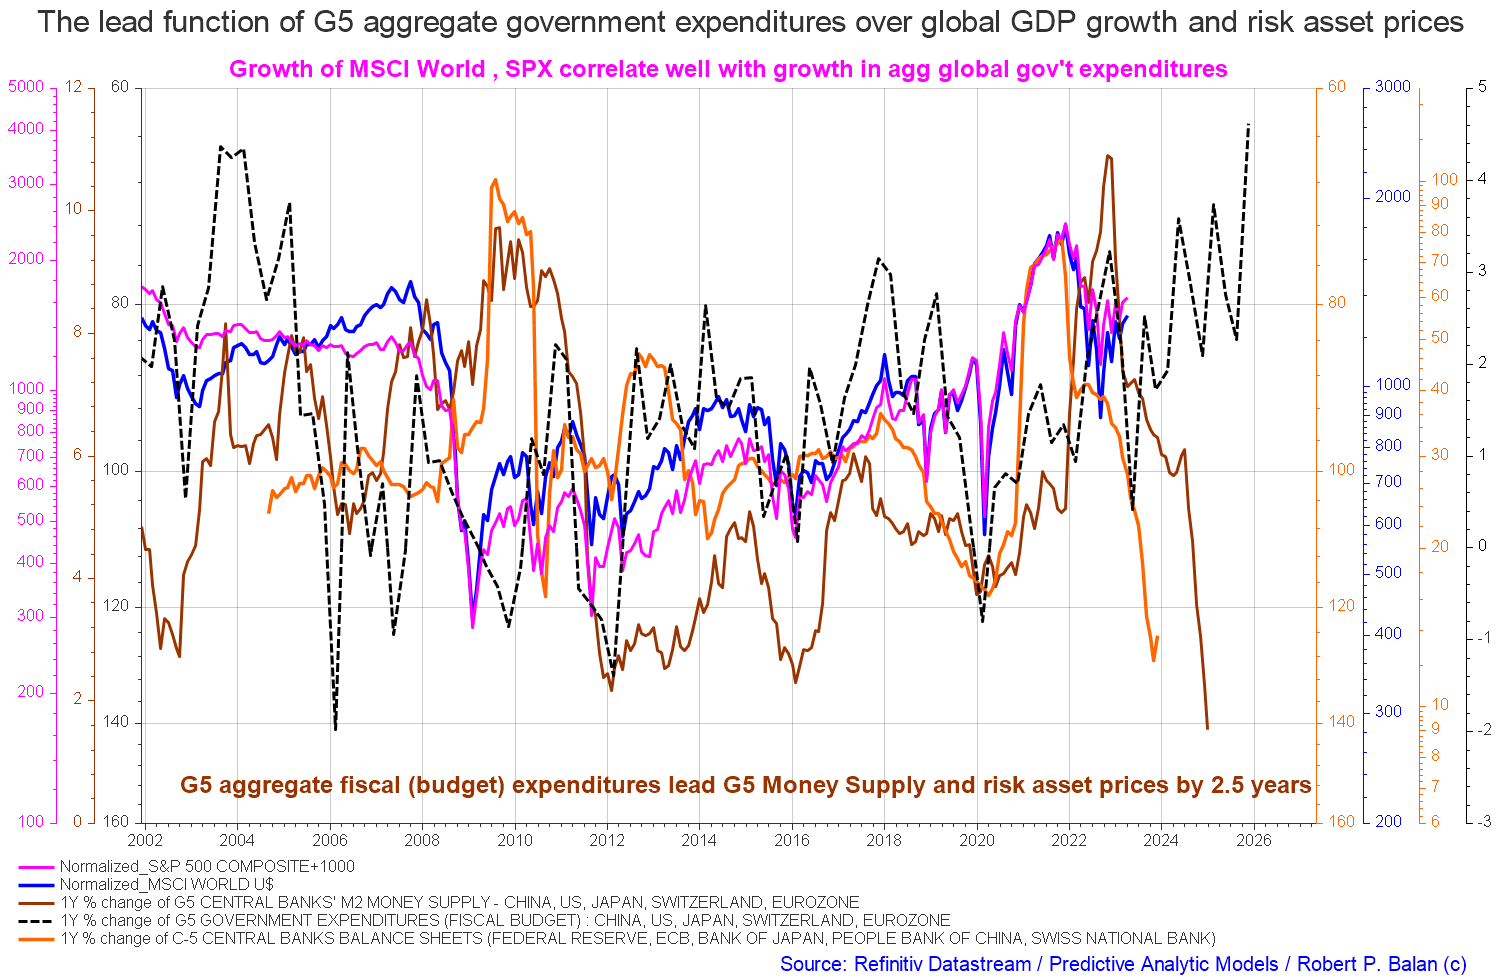
On the larger world macroeconomic side, we have the G5 chart below. The chart below comes from Mr. Robert P. Balan of Predictive Analytic Models. The chart shows the level of money creation by the top five world governments (the G5) in a change rate format, along with a host of other indexes. This chart gives a sense of important inflection points and direction.
The chart above shows that central bank balance sheets and M2 [orange and brown lines] are still falling hard. At the same time, total G5 expenditure is generally rising even though at present it is at a low and looks to rise strongly into the rest of the year [black dotted line]. For best investment market outcomes one wants to see all the co-variables rising and falling together and not in divergence as is the case at present.
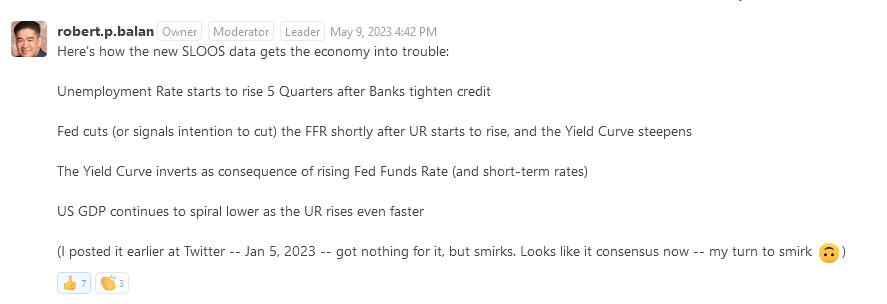
The major change over last month is the small uptick in central bank balance sheets [orange line] the result of what is probably the first round of QE being used to rescue failed banks with more to come as the situation worsens. On that note, those sage words from Mr. Robert P Balan from January 2023 are starting to look very valid, shown below from the PAM chat room extract.
Seeking Alpha chatroom Mr. Robert P Balan
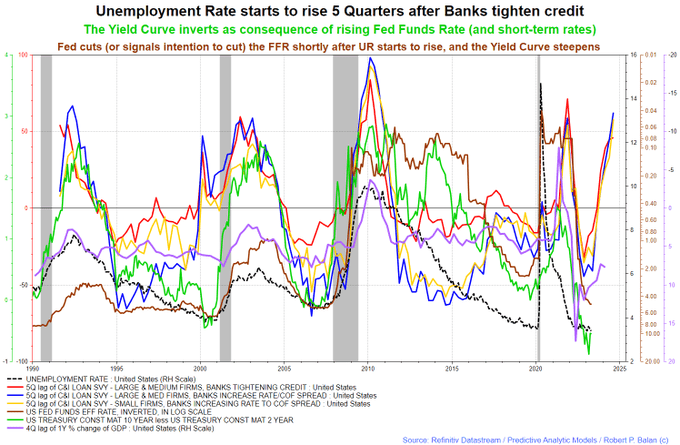
In the chart above the commercial loan data is the lead co-variable with the lagging co-variables such as unemployment, GDP, the FFR, and interest rates [inverted] sure to follow. The latest employment data may look OK now but it is about to change.
The first table in this article shows how bank credit has gone backward for the last four months. Banks are tightening credit and businesses and consumers are already voting with their feet and not demanding loans in any case. Who would want to take a loan out now in an economy being deflated by the Fed and heading for recession? There is no prospect of making money from the loan investment in a sinking market and it might not even be able to be serviced or paid back.
The macro direction is still downwards with local rallies that should be sold.
If you are looking to make a market entry, sometime in the last quarter of 2023, the first quarter of 2024 is likely to be a good time judging by the macro tidal forces that underpin the asset markets. Best to wait now until the recession has come and gone.
For further details see:
The Private Domestic Sector Prints A $295B Deficit In April Pointing To Down Markets In May