CA - The Retiree's Dividend Portfolio: John's April Update - 6 Dividend Increases
2023-05-20 09:00:00 ET
Summary
- John's retirement accounts generated a total of $2,215.32 of dividend income for April 2023 vs. $1,958.89 of dividend income for April 2022.
- John's Traditional IRA had a balance of $347.4K as of April 30, 2023, vs. $362.5K on April 30th, 2022. The estimated annualized yield is 5.13%.
- John's Roth IRA had a balance of $205.4K as of April 30, 2023, vs. $218.3K on April 30, 2022. The estimated annualized yield is 5.06%.
- There were a total of six companies that paid an increased dividend during the month of April.
We have recently covered a few stocks on our watchlist that are looking more attractive and the recent pop in natural gas due to lower-than-expected reserves. While oil prices have seen the price come down (we are still easily looking at $75/barrel) natural gas prices have plummeted over the last year.
Right now we see the most potential in Canadian oil stocks which are trading at lows compared to the premium price commanded by oil major Exxon Mobil (XOM). We have also added EOG Resources to the list of candidates as well (although we would only add to the position at closer to $100/share).
I found the article UNG: Why Natural Gas ETFs Could Disappoint (Technical Analysis) an interesting read that makes the argument for natural gas prices to come back strong over the next year.
Background
For those interested in John and Jane's full background, you can find at least three articles a month published for the last five years detailing the performance of their portfolio. I have continued to evolve the report over time by adding and removing information/images to make the updates more useful to the average investor. Here are the key details that should be understood when reading these updates.
- This is a real portfolio with actual shares being traded. This is not a practice portfolio which is why I include screenshots from Charles Schwab to document every change that is made.
- I am not a financial advisor and merely provide guidance based on a relationship that goes back several years.
- John retired in January 2018 and has collected Social Security income as his regular source of income. John also currently withdraws $1,000/month from his Traditional IRA.
- Jane retired at the beginning of 2021 and decided to begin collecting Social Security early and has not made any withdrawals from her retirement accounts yet.
- John and Jane began drawing funds from the Taxable Account in 2022 at $1,000/month. After speaking with them this amount has been increased to $1,700/month. This withdrawal is still covered entirely by dividend and interest income.
- John and Jane have other investments outside of what I manage. These investments primarily consist of minimal-risk bonds and low-yield certificates.
- John and Jane have no debt or monthly payments other than basic recurring bills such as water, power, property taxes, etc.
The reason why I started helping John and Jane with their retirement accounts is that I was infuriated by the fees they were being charged by their previous financial advisor. I do not charge John and Jane for anything that I do .
The only request I have made of John and Jane is that they allow me to publish their portfolio anonymously because I want to help as many people as I can while holding myself accountable and improving my thought process.
I started this series to address issues I have had when reading other authors with similar types of updates (I am not saying they are wrong, but I found myself questioning their actual performance because they never provided enough information to cover loose ends).
Here is My Promise to Readers:
- I aim to give as much information as needed so readers can feel confident that what I do is real.
- Even if you agree the results are real this does not mean I expect you to agree with me and I will always answer constructive criticism whenever possible. I will respond with the same genuine intent that the question was asked with.
- I am very transparent about the portfolio and consistency is a significant goal of mine. All of my data points (unless noted otherwise) are derived from month-end statements from Charles Schwab. Even when things aren't looking great (Spring 2020 for example) you will know because I provide enough information that it would be impossible for me to manipulate.
- This article is not intended to be advice or a call to action and is for informational purposes only (I am not a financial advisor and I don't claim to be one). My goal is to challenge conventional thinking and empower you to take control of your investments (if that's something you want to do).
While many authors require paid subscriptions to see their portfolio I do not want to go that route and will continue to publish this series for free as long as there is enough interest to make it worth my time (and I spend a lot of time on these articles).
Generating a stable and growing dividend income with an emphasis on capital preservation has become the primary focus of this portfolio. I am least concerned about capital appreciation which is why the decisions made will seem pretty conservative most of the time. I may measure the performance of the portfolio relative to indexes and ETFs but the key metric I am focused on is delivering a more stable source of cash flow to John and Jane over time that allows them to live a comfortable retirement that includes minimal stress related to finances.
Dividend Decreases
No companies in John's Traditional and Roth IRA accounts eliminated or reduced their dividend during the month of April.
Dividend Increases
Six companies paid increased dividends/distributions or a special dividend during the month of April.
- Essex ( ESS )
- Realty Income ( O )
- Occidental Petroleum ( OXY )
- Bank OZK ( OZK)
- Sun Communities ( SUI )
- W. P. Carey ( WPC )
ESS, O, and WPC were covered in the Taxable Account update or Jane's Retirement account update. I will only include information about the dividend increases associated with these. Those interested in reading the summary of these three companies can check the links at the end of the article.
Essex Property Trust - The dividend was increased from $2.20/share per quarter to $2.31/share per quarter. This represents an increase of 5% and a new full-year payout of $9.24/share compared with the previous $8.80/ share. This results in a current yield of 4.32% based on the current share price of $209.14.
Realty Income - The dividend was increased from $.2545/share per month to $.2550/share per month. This represents an increase of .2% and a new full-year payout of $3.06/share compared with the previous $3.054/ share. This results in a current yield of 4.94% based on the current share price of $60.29.
Occidental Petroleum - In one year, OXY has repurchased 47.7 million outstanding common stock shares, which represented just under 5% of the almost 1.02 billion outstanding shares at its peak in mid-2022. Part of these buybacks were possible because of exceptional pricing on crude oil and natural gas which generated $4.65/share in Q1-2022 vs $1.00/share in Q1-2023. OXY has announced that they have authorized another $3B buyback authorization which at current share prices represents a total of 51.6 million shares or approximately 5.3% of outstanding shares remaining.
I believe that OXY shares price will continue in this holding pattern for the time being with the CEO stating that excess cash flow will continue to be allocated towards share repurchases which reach their highest point after the acquisition of Anadarko Petroleum.
The dividend was increased from $.13/share per quarter to $.18/share per quarter. This represents an increase of 38.5% and a new full-year payout of $.72/share compared with the previous $.52/ share. This results in a current yield of 1.23% based on the current share price of $58.14.
Bank OZK - Even with the banking sector in turmoil OZK continues its impressive dividend growth even though it is taken a major blow when it comes to share price. OZK has seen healthy EPS growth over the last three years supported by healthy loan volume and benefitting from variable interest rates.
As a reminder, what makes the dividend growth record of OZK so impressive is that the company has a 24-year growth record (which is impressive for any financial institution to have maintained through the financial crisis of 2008) but many of these increases took place on a quarterly basis. OZK boasts a five-year dividend growth rate of 12.31%. OZK's recent price weakness is something that investors should pay attention to because the low pricing is primarily the result of the banking sector's weakness and not OZK's actual performance.
The dividend was increased from $.34/share per quarter to $.35/share per quarter. This represents an increase of 2.9% and a new full-year payout of $1.40/share compared with the previous $1.36/ share. This results in a current yield of 4.24% based on the current share price of $32.11.
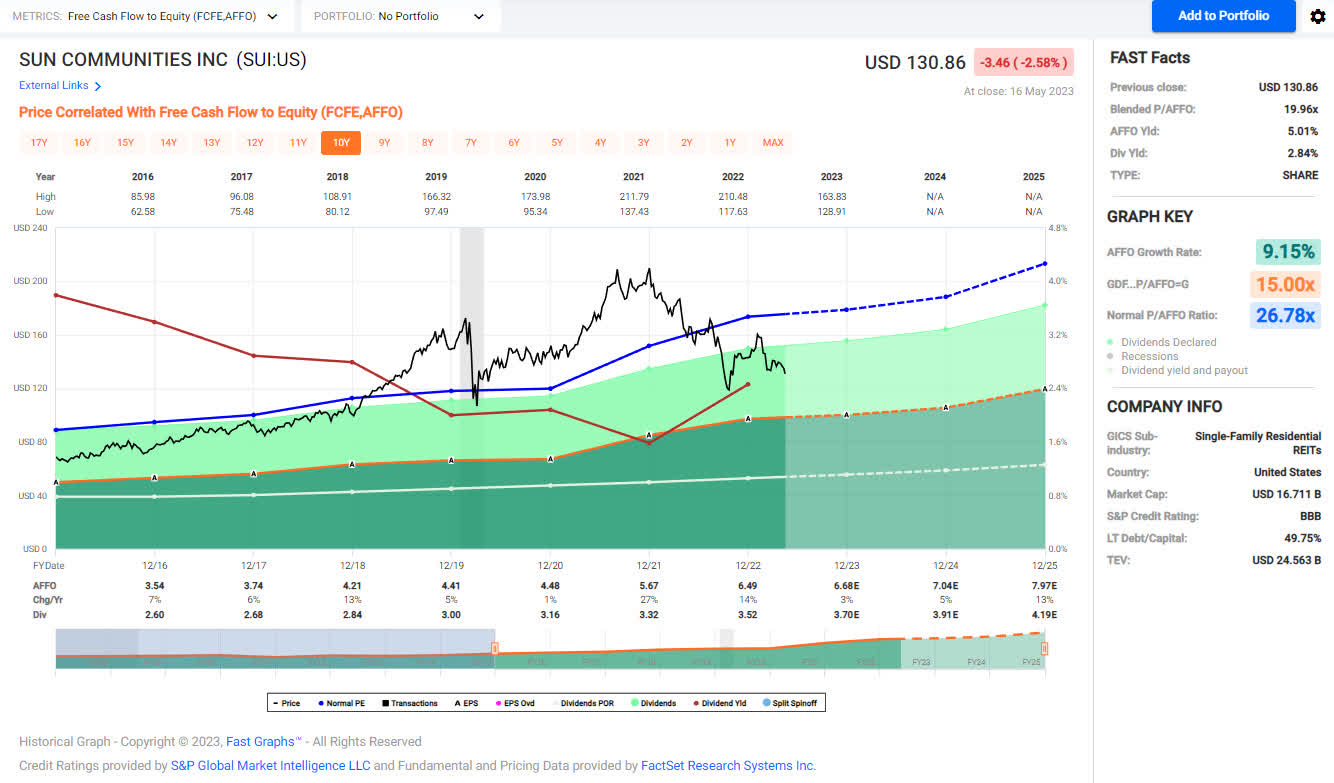
Sun Communities - In the most recent earning call transcripts I was particularly impressed with management's focus on long-term/annual leases vs short-term/transient leases. Core FFO exceeded the high end of guidance by $.03/share because there are fewer costs involved when turnover is lower and is a big contributor to the occupancy levels reaching 98.6%. SUI also has pricing power which is shown by NOI growth in all three segments -manufactured housing, RVs, and marinas.
I think it's worth noting that SUI's dividend yield has returned to levels not seen since the COVID lockdowns and the end of 2018. A yield of 2.75-3.00% seems to be a limiting factor, especially with the company performing well operationally. This would suggest that the current share price would be a great time to add additional shares. It is likely that we will add more shares of SUI in the next few days.
The dividend was increased from $.88/share per quarter to $.93/share per quarter. This represents an increase of 5.7% and a new full-year payout of $3.72/share compared with the previous $3.52/ share. This results in a current yield of 2.77% based on the current share price of $130.86.
W. P. Carey - The dividend was increased from $1.065/share per quarter to $1.067/share per quarter. This represents an increase of .2% and a new full-year payout of $4.26/share compared with the previous $4.268/ share. This results in a current yield of 6.00% based on the current share price of $69.46.
Retirement Account Positions
There are currently 37 different positions in John's Traditional IRA and 23 different positions in John's Roth IRA. While this may seem like a lot, it is important to remember that many of these stocks cross over in both accounts and are also held in the Taxable Portfolio.
Below is a list of the trades that took place in the Traditional IRA during the month of April.
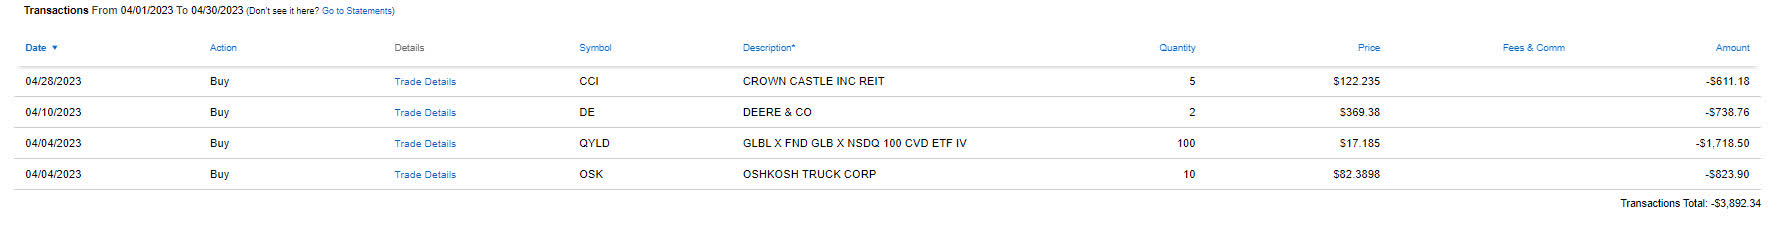
There were no trades that took place in the Roth IRA during the month of April.
April Income Tracker - 2022 Vs. 2023
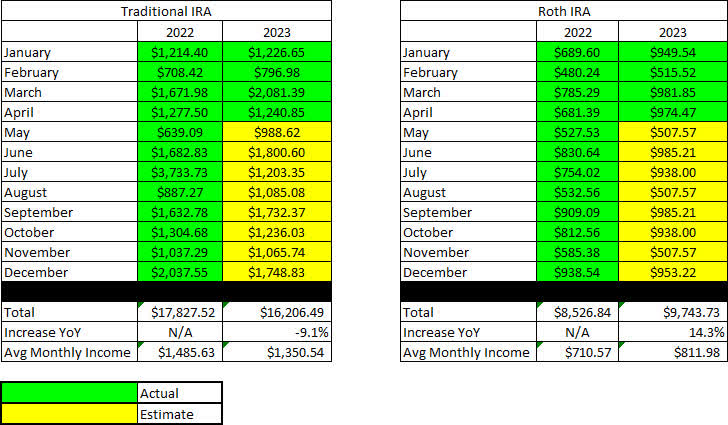
2023 dividend income performance was mixed with John's accounts set for a large decrease in the dividend income generated by the Traditional IRA and a large increase in the dividend income generated by the Roth IRA. The reason for the large decrease in the Traditional IRA was due to the special dividend paid by Healthcare Trust of America (HTA) when it was acquired by Healthcare Realty ( HR ) - This can also be seen in the huge growth in 2022 dividends which came in at a whopping 35.3%. If this dividend is removed then the growth year-over-year is trending as flat overall. While it's possible we could see more special dividends in 2023 I think it's more likely that management will focus on deleveraging or stock buybacks in most cases.
The Traditional IRA is expected to generate an average of $1,350.54/month of dividend income in 2023 compared to the average monthly income of $1,485.63 generated in FY-2022. The Roth IRA is expected to generate an average of $811.98/month of dividend income in 2023 compared to the average monthly income of $710.57 generated in FY-2022.
Once dividend increases are factored in and the additional interest income from CDs and SWVXX I expect we will see a very light increase in dividend income of 3-4%. (In this assumption I am also factoring out the large special dividend from the HTA acquisition but if I leave that in then I estimate we will see an overall negative combined dividend yield growth of 1-2%.)
John plans to continue collecting $1,000/month from his Traditional IRA which matches the amount he withdrew monthly in 2022.
SNLH = Stocks No Longer Held - Dividends in this row represent the dividends collected on stocks that are no longer held in that portfolio. We still count the dividend income from stocks no longer held in the portfolio, even though it is non-recurring. All images below come from Consistent Dividend Investor, LLC. (also referred to as CDI as the source below).
The tables below represent which companies paid dividends in March 2023 and how that income source has changed since March of the previous year.
Traditional IRA - April - 2022 V 2023 Dividend Breakdown (CDI)
Roth IRA - April - 2022 V 2023 Dividend Breakdown (CDI)
The table below represents all income generated in 2022 and collected/expected dividends in 2023.
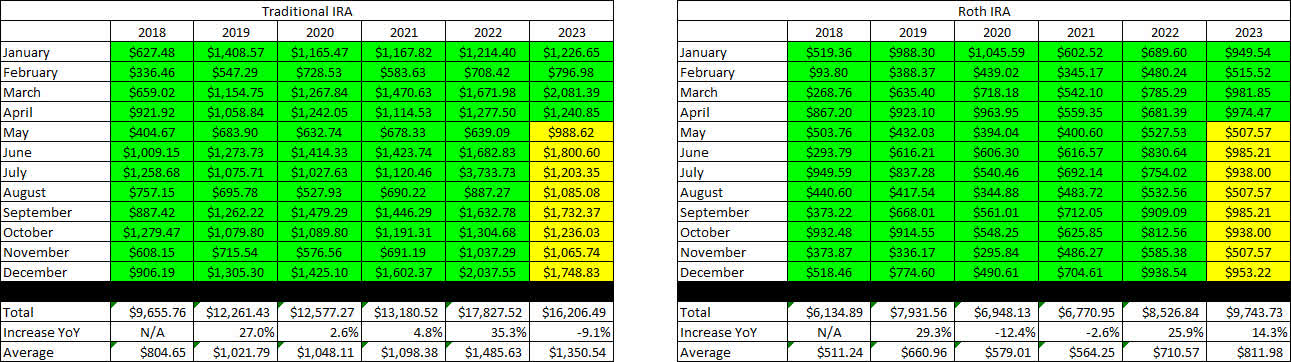
Below gives an extended look back at the dividend income generated when I first began writing these articles. I find this table to be most useful when comparing how dividend income has improved for a specific month over the course of six years.
Retirement Projections - April 2023 - Full Dividend History (CDI)
The balances below are from April 30, 2023, and all previous month's balances are taken from the end-of-month statement provided by Charles Schwab.
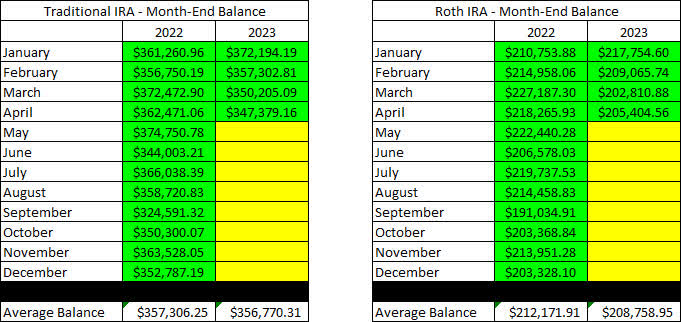
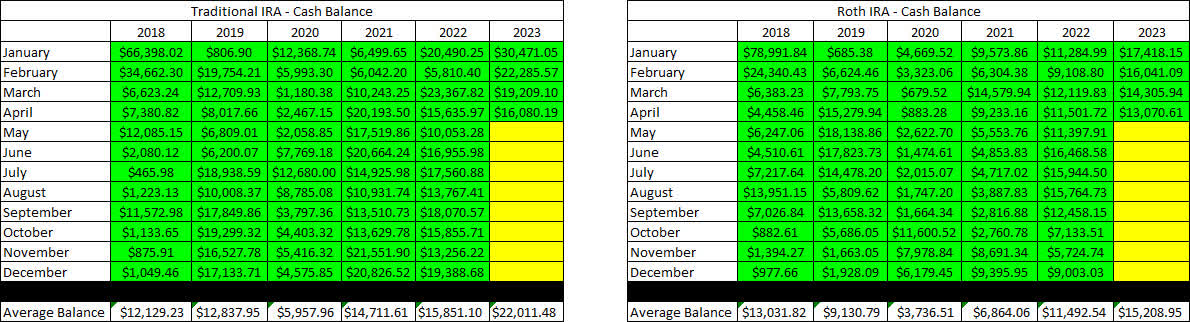
The next image is also pulled from the end-of-month statement provided by Charles Schwab which shows the cash balance of the account.
**Please note that cash balances may fluctuate based on CD renewal dates and the use of Schwab Value Advantage Money Fund ( SWVXX ) because I only count the cash that is 100% liquid. There were larger fluctuations in 2019 and 2020 that we the result of deposits and withdrawals being made. There will be no contributions made into either account in 2023 because John is no longer working.
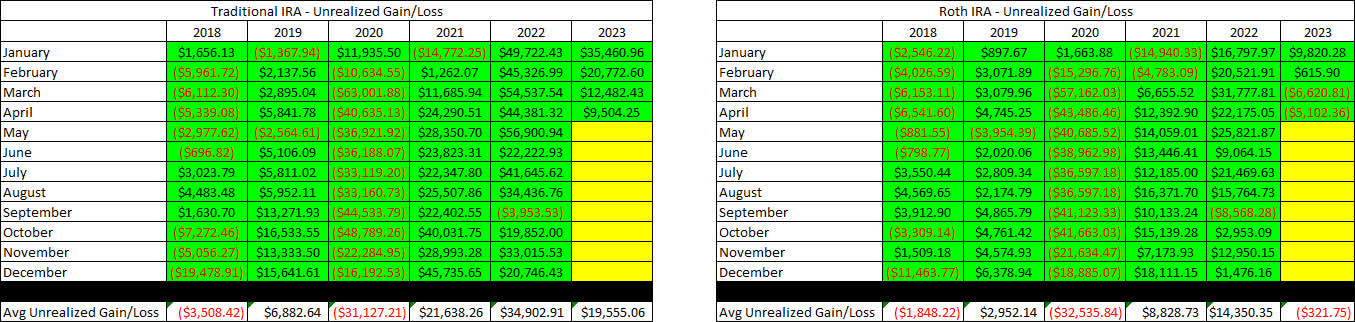
The next image provides a history of the unrealized gain/loss at the end of each month going back to the beginning of January 2018.
Retirement Accounts - April 2023 - Unrealized Gain-Loss (CDI)
I think the table above is one of the most important for readers to understand because it paints a story of volatile markets and why we employ the strategy of generating consistent cash flows to overcome the uncertainty of the market. If we were dependent on selling shares to generate income for John and Jane's retirement they would have to be much more considerate of when they withdraw and how much they choose to withdraw.
For example, a withdrawal in 2020 where shares must be sold would destroy more value by locking in losses or poor performance by stocks being sold compared to selling the same shares and withdrawing funds in 2021.
In an effort to be transparent about John's Account, I like to include an unrealized Gain/Loss summary. The numbers used are based on the closing prices from May 17, 2023.
Traditional IRA - April 2023 - Gain-Loss (CDI) Roth IRA - April 2023 - Gain-Loss (CDI)
It is worth noting in the table above that the yield column is most accurate at the start of the year, but if I reduce the size of positions it may inflate the yield because it is based on how much dividend income is collected. At the same time, it may report excessively low dividends for positions added or significantly increased at the end of the year.
The last image represents the withdrawals being made from John's Traditional IRA, as this is the only account he is currently withdrawing funds from. As mentioned before, he continues to withdraw $1,000/month.
Traditional IRA Withdrawals - April 2023 (CDI)
Conclusion
With the gain-loss tables for John's account both showing in the negatives I think it's important to reiterate the purpose of the dividend stock strategy because we are trying to create a level of certainty and consistency in an uncertain and inconsistent market that is negatively impacted by everything from energy price swings to the US government negotiating the debt ceiling.
Part of the reason for the cash build-up is to make sure that we can capitalize on opportunities when they arise and this is a little more challenging when we are balancing the use of cash with John's withdrawals from the account. It is also worth noting that the financial sector is where the largest impact on the account balances is coming from because John does have more exposure to FI's that were negatively impacted by the recent bank failures.
Year-to-date we have seen a significant impact on the financial holdings in John's portfolio.
We have decided to continue holding all of the companies listed with the only major risk of the four stocks held is PacWest Bancorp ( PACW ) and even then the share price has doubled off of its recent lows.
April Articles
I have provided the links to April Taxable and Jane's Retirement articles below.
The Retirees' Dividend Portfolio: John And Jane's April 2023 Taxable Account Update
The Retiree's Dividend Portfolio, Jane's April Update: Risk-Free Rates Are Looking Very Attractive
In John's Traditional and Roth IRAs, he is currently long the following mentioned in this article: AFC Gamma ( AFCG ), Aflac ( AFL ), Apple Hospitality REIT ( APLE ), Avista ( AVA ), BP plc ( BP ), Brixmor Property Group ( BRX ), Crown Castle ( CCI ), Canadian Utilities (CDUAF), Chatham Lodging Trust ( CLDT ), Columbia Banking System ( COLB ), Chevron ( CVX ), CSX ( CSX ), Dominion Energy ( D ), Deere ( DE ), Digital Realty Preferred Series J ( DLR.PJ ), Duke Energy ( DUK ), Eaton Vance Floating-Rate Advantage Fund ( EAFAX ), EPR Properties ( EPR ), EPR Properties Preferred Series G ( EPR.PG ), Healthcare Realty ( HR ), Intercontinental Exchange ( ICE ), Iron Mountain ( IRM ), Kinder Morgan ( KMI ), Kite Realty Group ( KRG ), Lowe's ( LOW ), Main Street Capital ( MAIN ), Altria ( MO ), New Residential Investment Corp. Preferred Series B (NRZ.PB), Realty Income ( O ), Oshkosh ( OSK ), Occidental Petroleum Corp. ( OXY ), Bank OZK ( OZK ), Bank OZK Preferred Series A ( OZKAP ), PacWest Bancorp ( PACW ), PepsiCo ( PEP ), iShares Preferred and Income Securities ETF ( PFF ), VanEck Vectors Preferred Securities ex Financials ETF ( PFXF ), Pinnacle West ( PNW ), PIMCO Income Fund Class A ( PONAX ), Nuveen Nasdaq 100 Dynamic Overwrite Fund ( QQQX ), Global X Funds Nasdaq 100 Covered Call ETF ( QYLD ), STAG Industrial ( STAG ), Sun Communities ( SUI ), Southwest Gas ( SWX ), AT&T ( T ), Toronto-Dominion Bank ( TD ), Truist Financial ( TFC ), T. Rowe Price ( TROW ), Cohen&Steers Infrastructure Fund ( UTF ), Valero ( VLO ), Ventas ( VTR ), WestRock ( WRK ), and W. P. Carey ( WPC ).
For further details see:
The Retiree's Dividend Portfolio: John's April Update - 6 Dividend Increases