IMCB - The S&P 500 Index In 2023 May Disappoint Investors
Summary
- The macroeconomic indicators in the US point a picture of doom and gloom.
- The Fed seems to be aggressive.
- More rate hikes may cause a recession.
- My base-case scenario is that it could be quite moderate.
There is always plenty of guesswork to be done when it comes to predicting the future of the US economy but most importantly the S&P 500 levels, profits, and valuations. After all, there are plenty of economic but most importantly geopolitical factors that matter a lot. And yet, I would like to give it a try. I will try to forecast the S&P 500's behavior in 2023.
US economy indicators
I will talk about some of the most common macroeconomic indicators used to judge the health of the US economy. These indicators are the inflation rate, the unemployment rate, the Treasury yield spread, PMI manufacturing and non-manufacturing published by the Institute of Supply Management ((ISM)), and Shiller's P/E ratio. In addition, I will also analyze the S&P 500's historical numbers as well as its profit and valuation indicators. The geopolitical factors also matter here a lot.
So, to start with, the biggest risk, in many analysts' view, is the Fed's action against inflation. Jerome Powell has previously stressed the Fed's inflation target of 2% and admitted that the current CPI of about 7% is indeed a long way to go. Analysts massively expect some more hikes next year.
FOMC's summary of economic projections
Source: Charles Schwab , Federal Reserve, as of 12/14/2022
The current federal funds rate is standing at 4.25% to 4.50%. But in 2023 the Federal Reserve expects the federal funds rate to average 5.1%, an increase of more than 0.50%. On December 14, the Federal Reserve's summary of economic projections included a prediction that rates for 2023 would be between 4.75% and 5.75%. Given the current rates, there is at least one more hike to happen in 2023. Even several rate rises are possible, provided the Fed would hike by 0.25%. According to CME's FedWatch tool, the Fed would raise the rates by 0.25% at both its February 1 and March 22 meetings. According to the projection , the rates would stay steady after that.
That depends, of course, on inflation and other economic indicators. The Fed can, indeed, correct its plans if the US economy enters a serious recession by then. And yet, everything seems to be in favor of the rate hikes. In fact, Powell was unwilling to discuss the possibility that the US economy would enter recession and that the rates would have to be decreased. Instead, he stressed a " still-tight labor market " and high services inflation . But let us talk about inflation first.
First of all, there are plenty of inflation indicators published on a regular basis, including services inflation mentioned by the Fed. But the most common indicators by which inflation is judged are the general inflation rate, the consumer price index and producer price inflation.
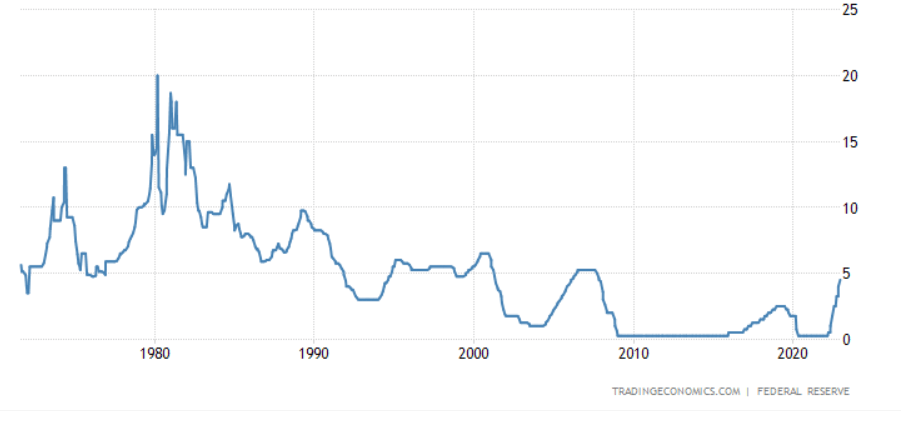
In order to give you a better idea of the Fed's future actions, I decided to compare the inflation indicators to the Fed funds rate history. Right now the interest rates are near the 2007-2008 highs. But they are nowhere near the levels seen in 1980. The maximum level reached at the time was 20%.
Fed funds rate history
Now let us consider the current and historical inflation numbers.
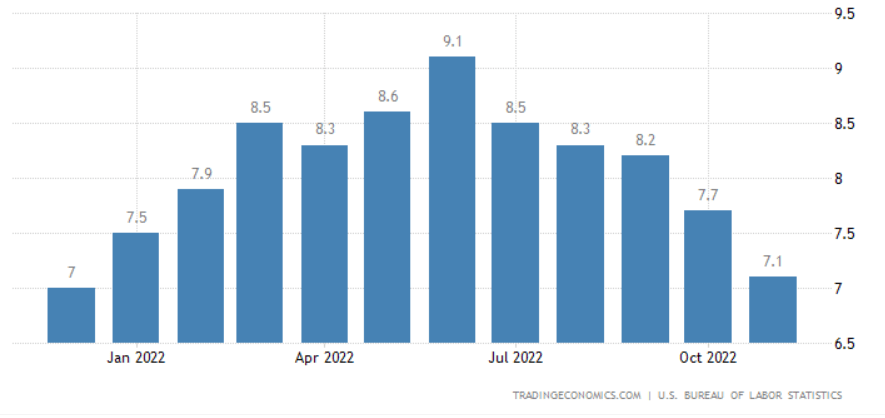
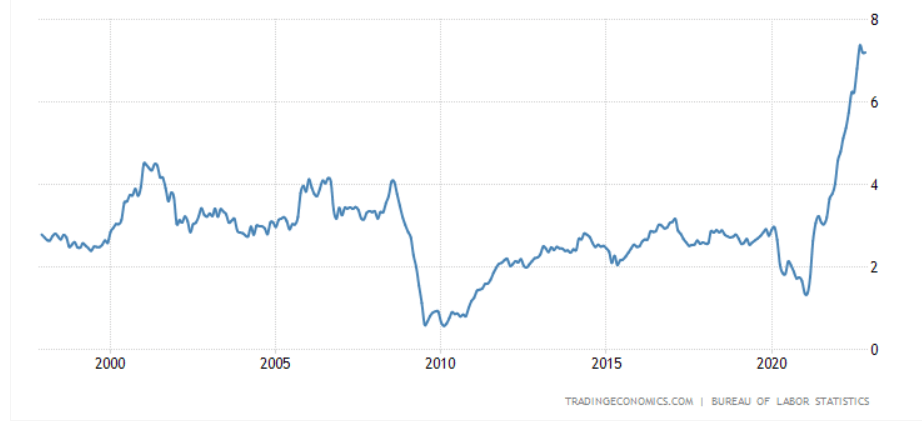
First, let us look at the general inflation rate history. The first graph below shows the inflationary numbers for 1 year's time. The highest number was in June 2022, which now seems to be the peak. The current readings are near the December 2021 levels. So, it looks like everything is better than it was several months ago.
General Inflation Rate
Yet, if we have a look at the diagram below, we will see that the current inflation readings are near the levels seen in 1980. So, it looks like the rates are far too low, given the current inflation readings.
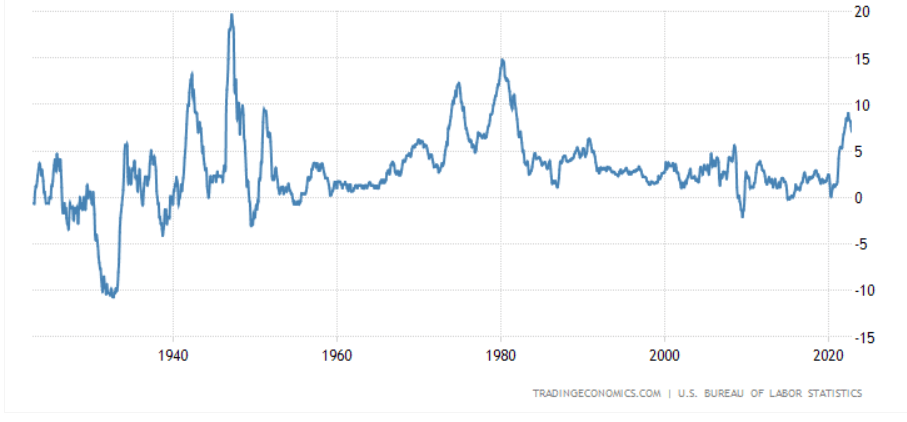
On the positive side, the inflation rate is much lower now than it used to be just a few months ago.
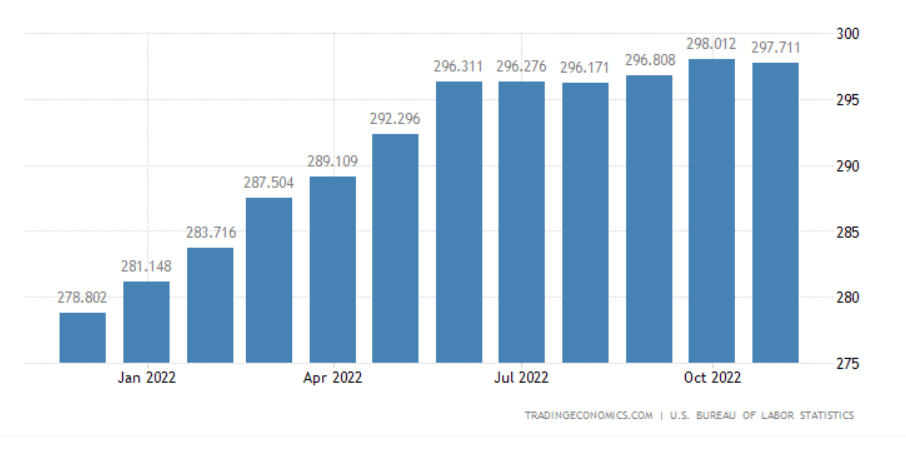
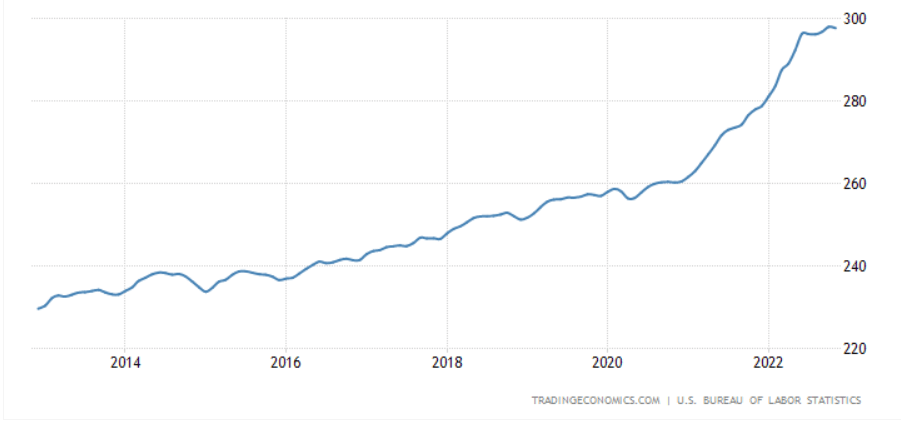
Let us have a look at the CPI index history. The graph below shows the inflation index, not the inflation percentages. We can see that consumer price inflation stabilized somewhat in the recent several months, having peaked in June.
Consumer Price Index
The CPI rate rose substantially since 2020 when a lot of cash was pumped into the economy by the Fed.
Producer Price Inflation
The producer price inflation ((PPI)), it seems, has passed its June peak of 11.7% and is now at 7.4%.
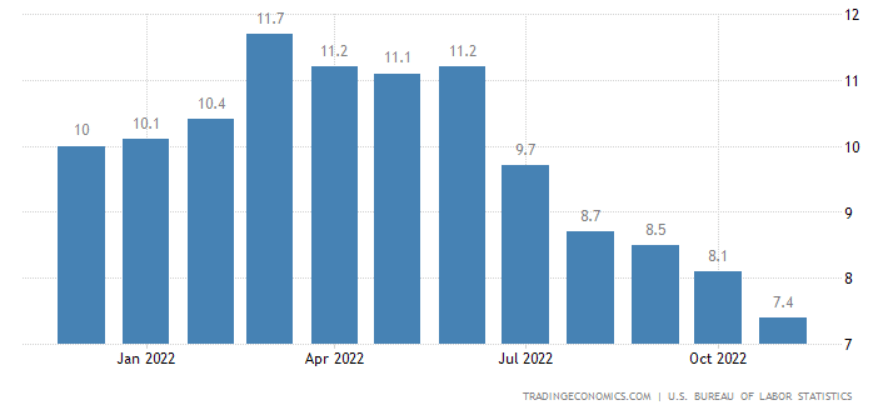
But it seems to be good news only on the surface. In fact, it is lingering close to the pre-2008 crisis.
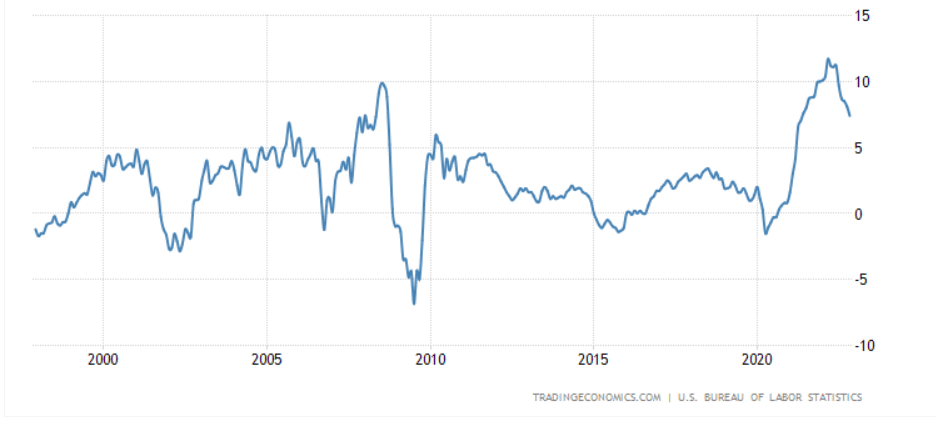
Services inflation
The most interesting indicator the Fed referred to, is the services inflation. On the 1-year diagram, it seems, it stopped growing but is not falling either.
The current rate is also at multi-decade highs. This indicator is also important because the services sector makes up almost 85% of the US economy. Currently, the services inflation does not seem to be slowing down, which is worrying for the Fed and also investors. There are still signs of substantial economic overheating.
But let us talk about unemployment which is also of great importance. When we talk about employment, we speak about many indicators. I will explain the unemployment rate, the non-farm payrolls, and the average hourly earnings.
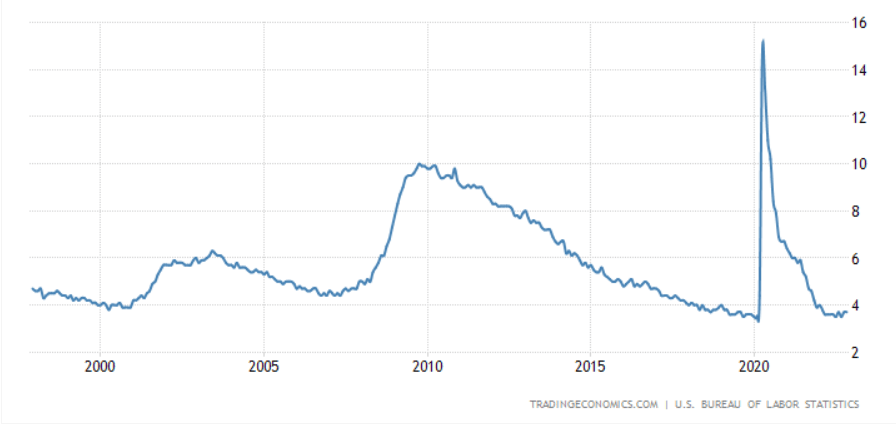
Unemployment rate
The unemployment rate has not changed much during the whole of 2022.
In fact, we can even say it is now relatively low and near the levels seen in 2019, just before the pandemic.
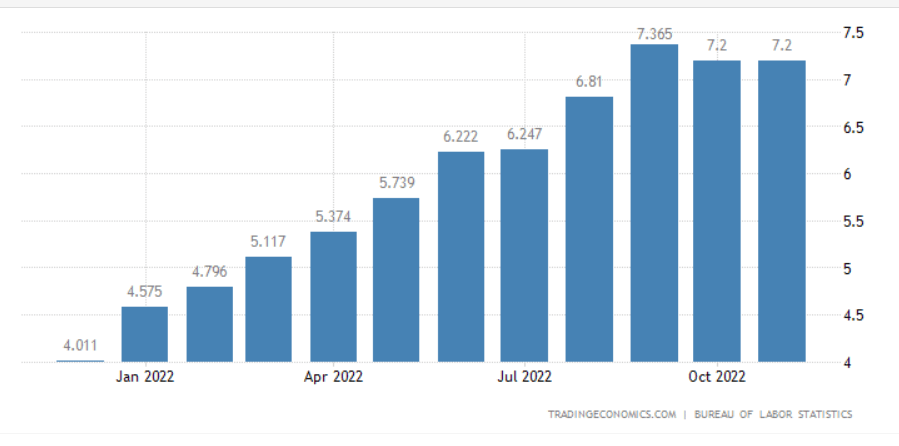
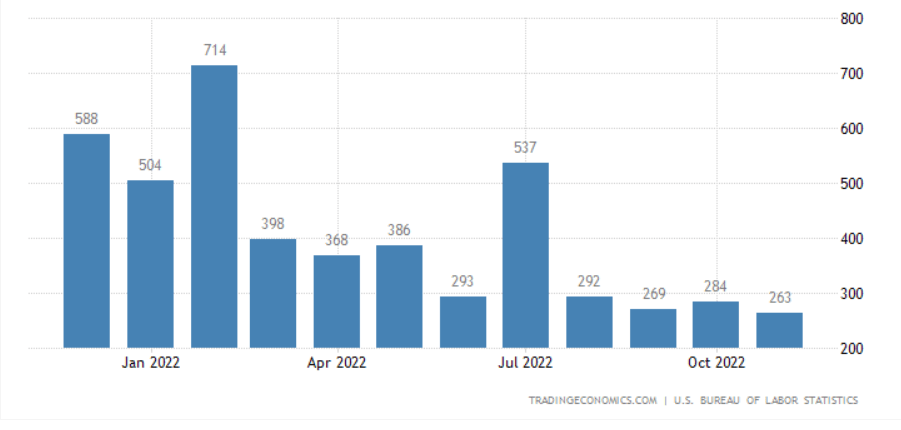
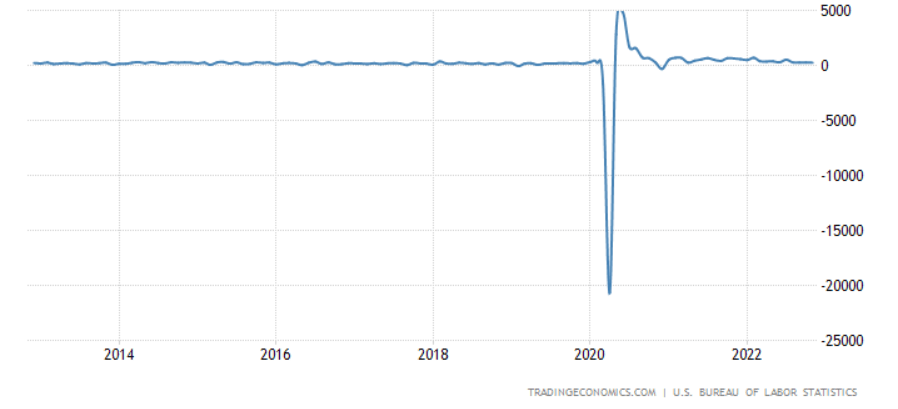
Non-farm payrolls
The non-farm payrolls, the monthly new jobs in the non-farm sector of the US economy, have decreased somewhat compared to the levels observed at the beginning of 2022. But it looks like the indicator is close to the pre-pandemic levels.
Average hourly earnings
The average hourly earnings (percentage change) can be seen in the two graphs below.
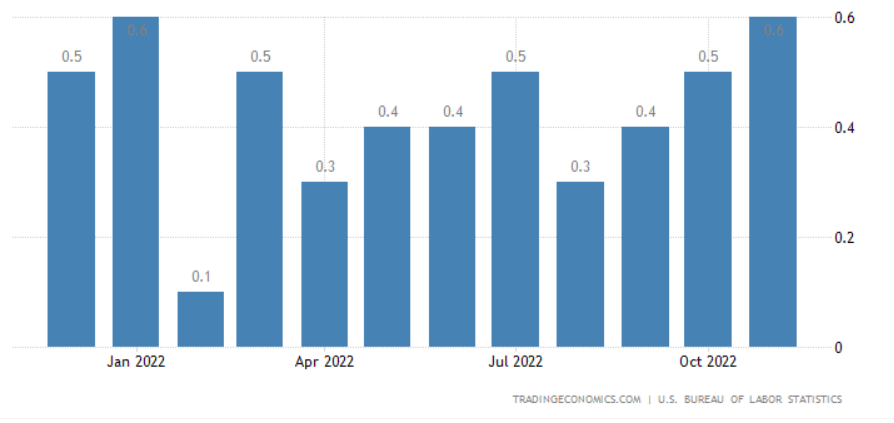
Whilst the first graph shows slight fluctuations, the second graph shows that employees' earnings have returned to the pre-Covid-19 levels.
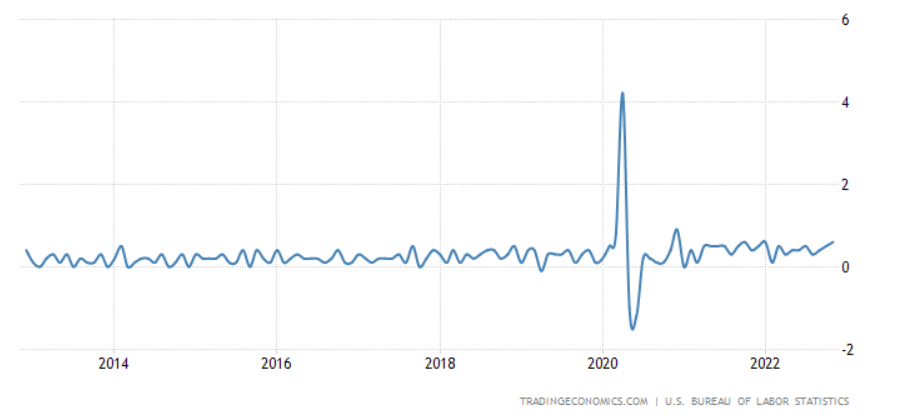
So, overall, it looks like the labor market is not suffering at all and may even look overheated.
PMI, the data published by the Institute of Supply Management, are also important. We look at manufacturing and non-manufacturing PMI. These are used as a very good alternative to GDP (Gross Domestic Product) statistics because PMI does not get published with such a delay, unlike GDP. And yet, PMI information also gives us an idea of the goods and services produced in the US economy.
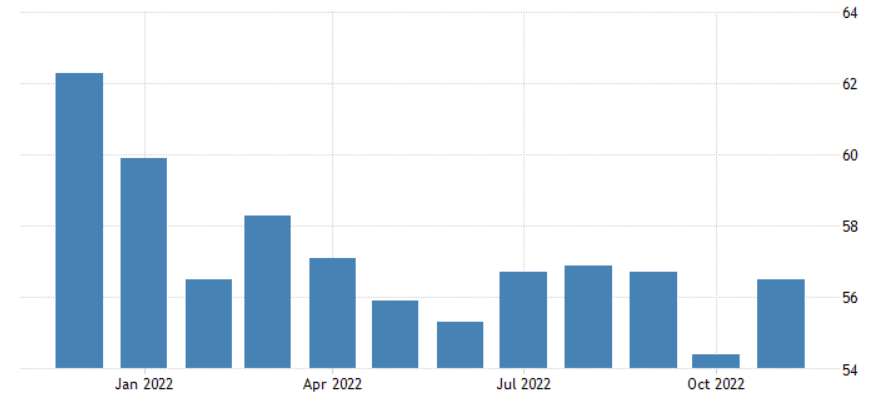
Non-manufacturing PMI is an index , calculated as an indicator of the general economic condition for the non-manufacturing sector.
Non-Manufacturing PMI
The services sector in the US still seems to be quite strong. A number above 50 shows growth, whilst an indicator below 50 shows contraction. The number reported for November was over 56, quite a good result.
And yet, it seems that the brilliant growth that happened during the post-pandemic recovery is over right now. In 2021 the ISM's non-manufacturing was almost 70, whereas now it is substantially lower than that.
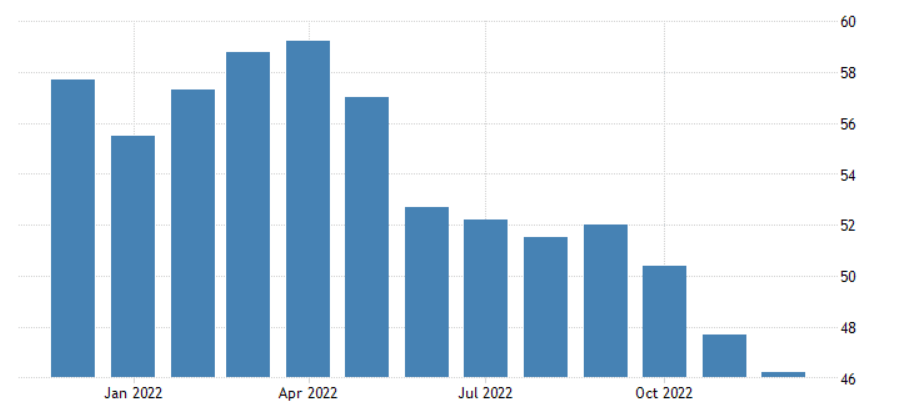
Manufacturing PMI
Manufacturing PMI shows the health of U.S. manufacturers. It is composed of the data given by purchasing managers. November's manufacturing PMI totaled 46. This suggests contraction.
But even more worrying is the long-term manufacturing graph. In the last 10 years, such a contraction was only observed during the pandemic.
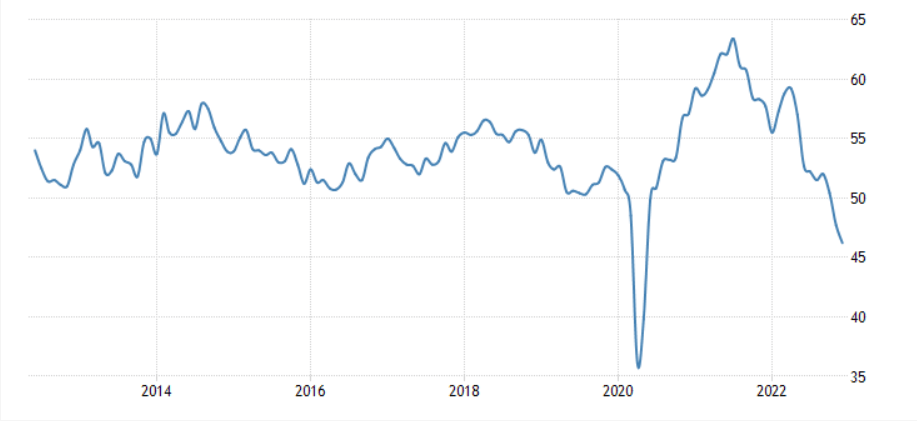
The PMI data might look worrying. But the current PMI indicator suggests that the US economy is not overheated, unlike the labor market.
Treasury Yield Spread
The spread between the 10-year and 2-year treasury yields is a good way to predict future recessions. As you can see from the diagram below showing the last 50 years, yield curve inversions have preceded recessions (marked in grey).
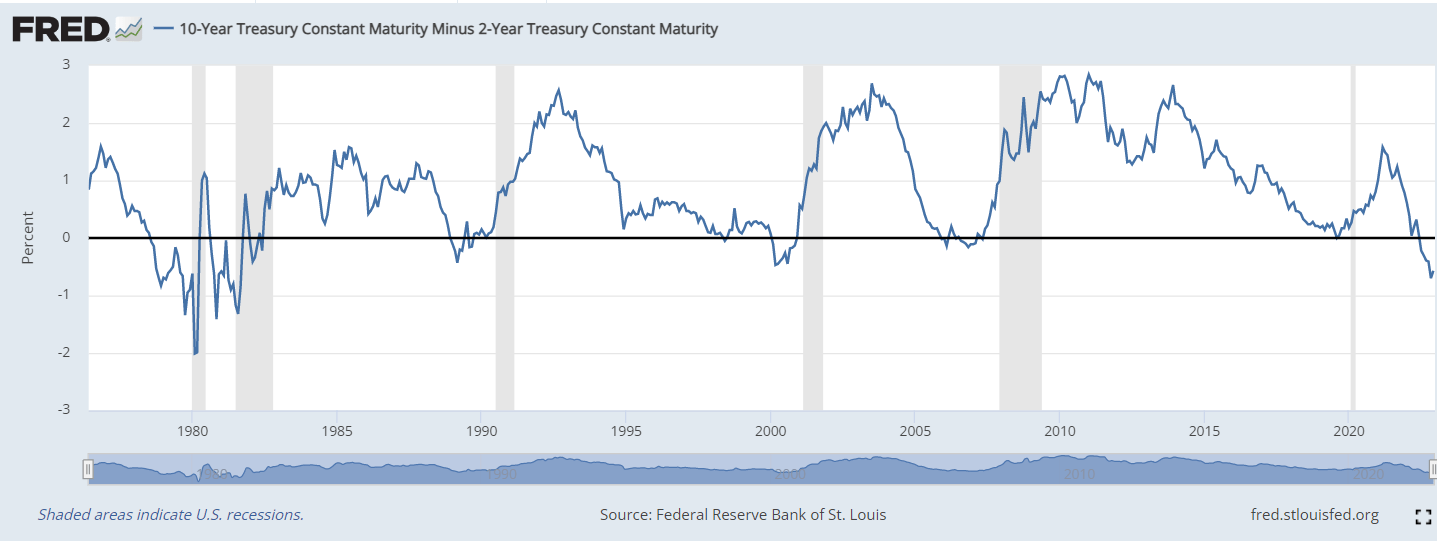
The current inversion is quite long and deep compared to the previous ones, especially the one happening in 2019, just before the coronavirus crisis, which is a worrying sign.
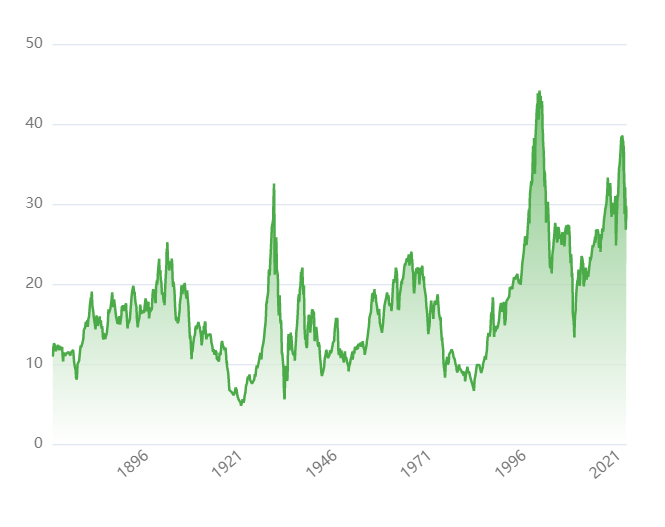
Shiller's price-to-earnings (P/E) ratio measures the current price of a stock or index that is trading over its inflation-adjusted, 10-year average earnings. It shows how overvalued or undervalued the index is.
Right now, as can be seen from the diagram below, Shiller's P/E is not at its all-time high when it was in 2000 during the Dot.com bubble. Shiller's P/E seems to have corrected from its 2021 levels as well but it has not reached the bottom just yet.
Shiller's P/E ratio history
Overall, we can say that the current S&P 500's Shiller's P/E ratio is below all-time highs but still does not suggest undervaluation.
In general, I would say many macroeconomic indicators suggest the economy is somewhat overheated.
Historical S&P 500 values and multiples
Given that a recession is likely, let us understand by how much S&P 500 will fall and so will the corporate profits and valuation multiples.
Let us first talk about the S&P 500 index's history, its profits, and revenue growth.
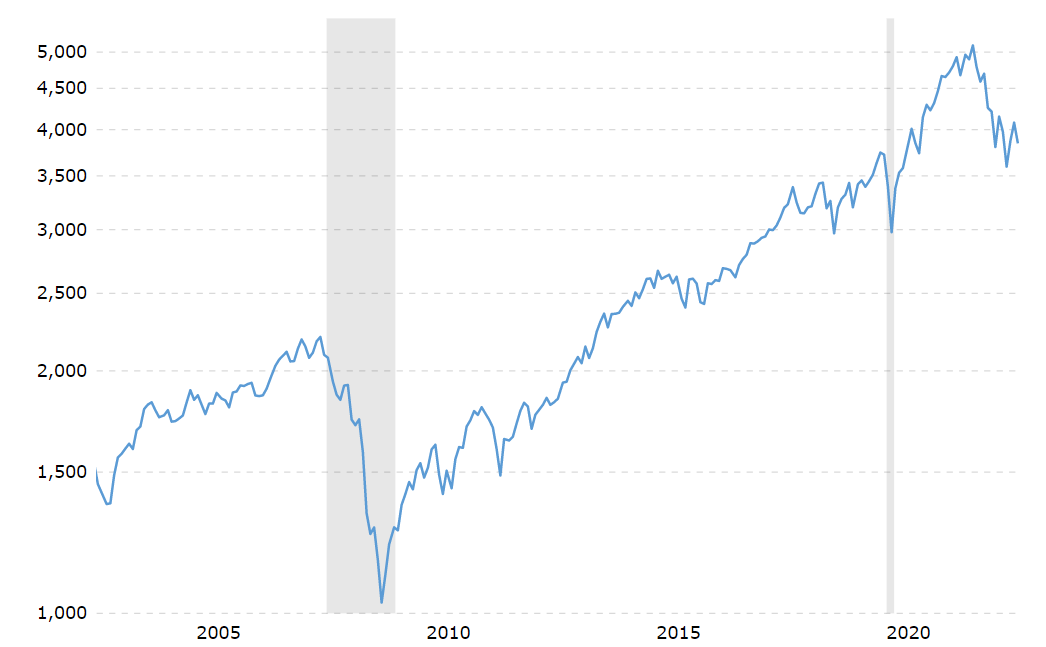
Right now S&P 500 is below the 4000 mark. As I am writing this, the index is 3844, quite a correction from the 5000 mark.
S&P 500's index history
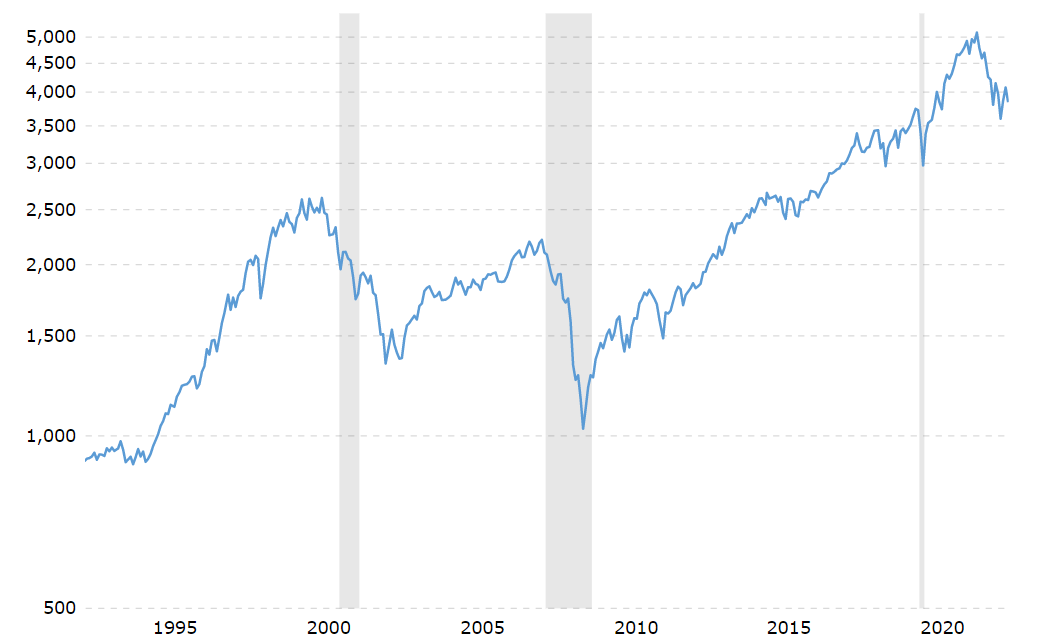
But I believe that S&P 500 may fall further since a recession is quite likely due to the macroeconomic indicators but most importantly the Fed. At the same time, the index has already corrected somewhat since the beginning of 2022. So, I do not think the correction I predict would be dramatic.
But let me consider the future S&P 500 earnings. It is based on the corporate earnings that one should try to predict the index value.
S&P 500's earnings history
My most optimistic earnings forecast would be 150, the level these were in 2019 before the pandemic. The corporate earnings rise was mostly due to the extra liquidity printed by the Fed. It did not just get invested into the stock market. Some extra cash was also distributed among US citizens to improve the aggregate demand in the economy. Obviously, the extremely low interest rates also reduced the corporate debt expenses, which also had a positive effect on business earnings. In 2019 the economy was doing quite well but there was no such support from the Fed and the US government. So, the extra-tight monetary policies would highly likely erase all the gains. Again, I am assuming the next recession would be quite moderate.
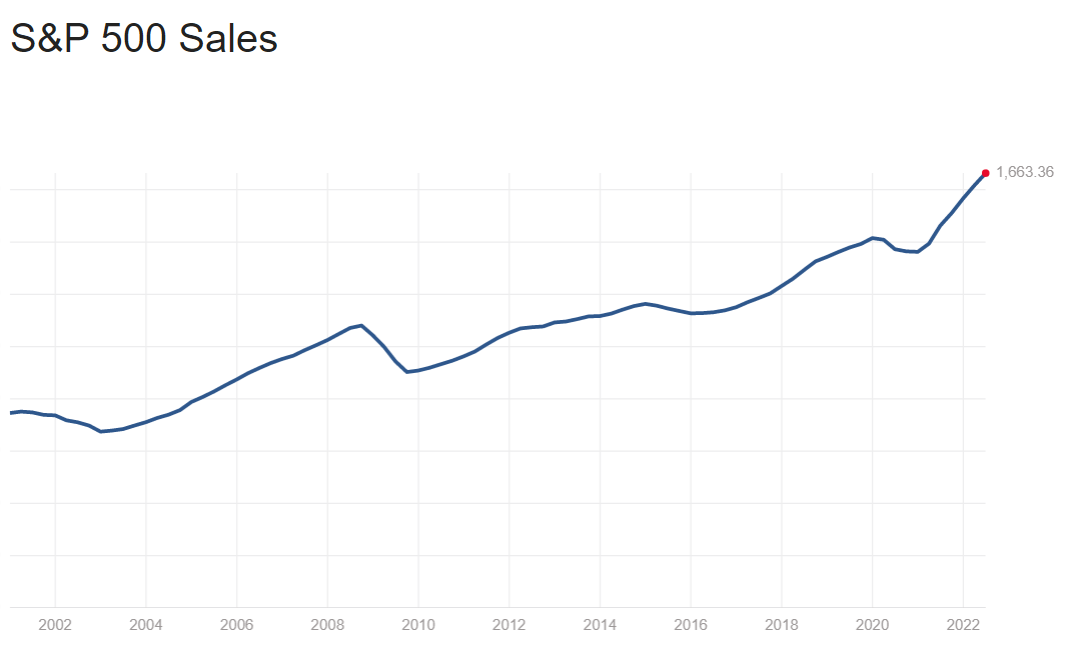
S&P 500's corporate sales do not react too much to recessions. They normally correct by about 5-10% and stop growing for a short period of time. A similar situation might happen now.
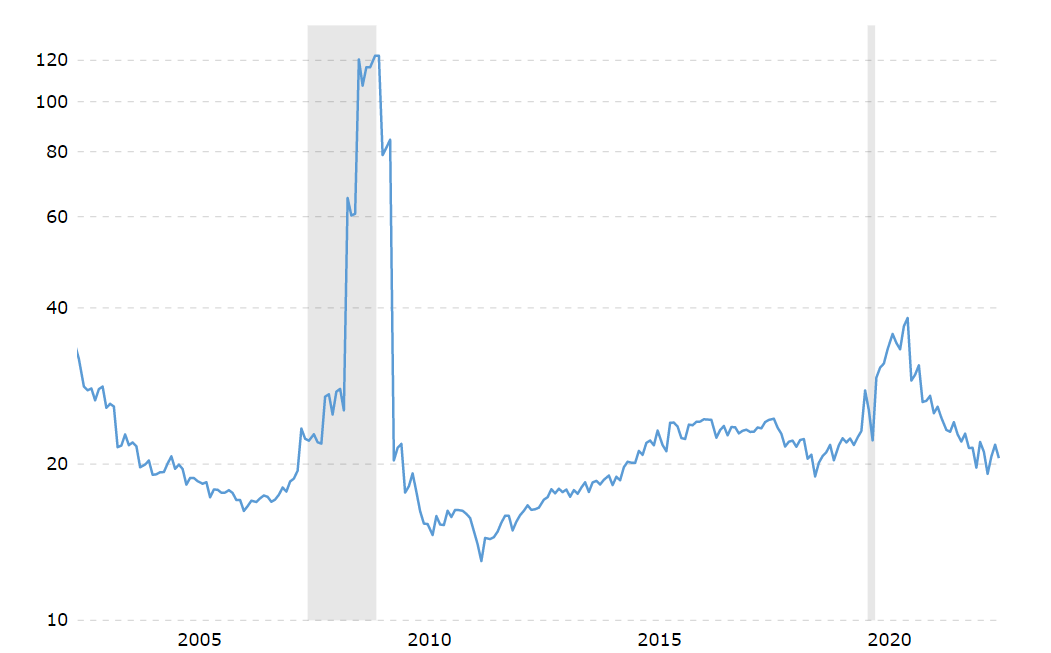
S&P 500's P/E ratio history
S&P 500's P/E ratio right now is not at its all-time high, currently lingering around the 20 mark. In fact, it suggests more undervaluation than Shiller's P/E. But it may fall slightly further, totaling about 19 or even less , if there is a recession. The reason why I am saying this is because I do not expect the next recession will be similar to the one in 2008-2009. At least, this is not my base-case scenario. In 2018 when the Fed scared the markets by hiking the interest rates, S&P 500's P/E ratio totaled 19. It looks like something similar would happen now when the Fed is getting more and more hawkish.
So, based on my earnings estimate of 150 and the P/E ratio of 19 for 2023, S&P 500 should total 2850. 150 x 19 = 2850.
This is almost a 33% fall from the time of writing. In 2020 it took the S&P 500 just more than a month to lose about 45% of its value. It is likely the slump would not be as dramatic since the index is already off its peaks. But the Fed is hawkish and the market will carefully monitor the macroeconomic indicators and anything the Fed has to say. Most of the index corrections, in my view, would be in the first half of the year, when most macroeconomists predict interest rate hikes.
Risks
The risks to my thesis are the following:
- Most importantly, the sanctions against Russia and the tensions around Ukraine . There is obviously a risk the conflict might escalate further. The geopolitical and economic consequences could be serious.
- Relations between China and the US and I do not mean the pre-pandemic trade war. I am mostly concerned with Taiwan, one of the topics that dominated the headlines in 2022. But other conflicts may arise as well.
- The Covid-19 in China and the related lockdowns
- Deteriorating indicators of the US economy - one of the most important factors.
- Another black-swan event - anything positive or negative can happen at any time.
Conclusion
In the case of the US economy and most importantly the stock market, it is very hard to predict the future. Anything can happen. A lot of analysts back at the end of 2019 believed that the year 2020 would be a good one. It was almost impossible to predict the Covid-19 crisis back then. I am giving my ideas on the market assuming that the past data could give us some key to what the future has in store. As an investor, I remain cautious for 2023 but I wish I am wrong. I predict a moderate recession and S&P 500 correction. Most of the losses will probably happen in the first half of 2023.
Editor's Note : This article was submitted as part of Seeking Alpha’s 2023 Market Prediction contest. Do you have a conviction view for the S&P 500 next year? If so, click here to find out more and submit your article today!
For further details see:
The S&P 500 Index In 2023 May Disappoint Investors