QVMM - The S&P 500 Reverts Toward The Mean
2023-11-09 19:50:00 ET
Summary
- Since bottoming on 27 October 2023, the S&P 500 (Index: SPX) has gone on a winning streak. The index has closed up on each of the last eight trading sessions.
- It has gone from being one and a half percent away from crossing the threshold signaling a breakdown of order in the U.S. stock market to now being within one and a half percent of the mean trend.
- Whenever you hear about stock prices "reverting to the mean," this is the mean that matters. It only exists during periods of relative order in the stock market.
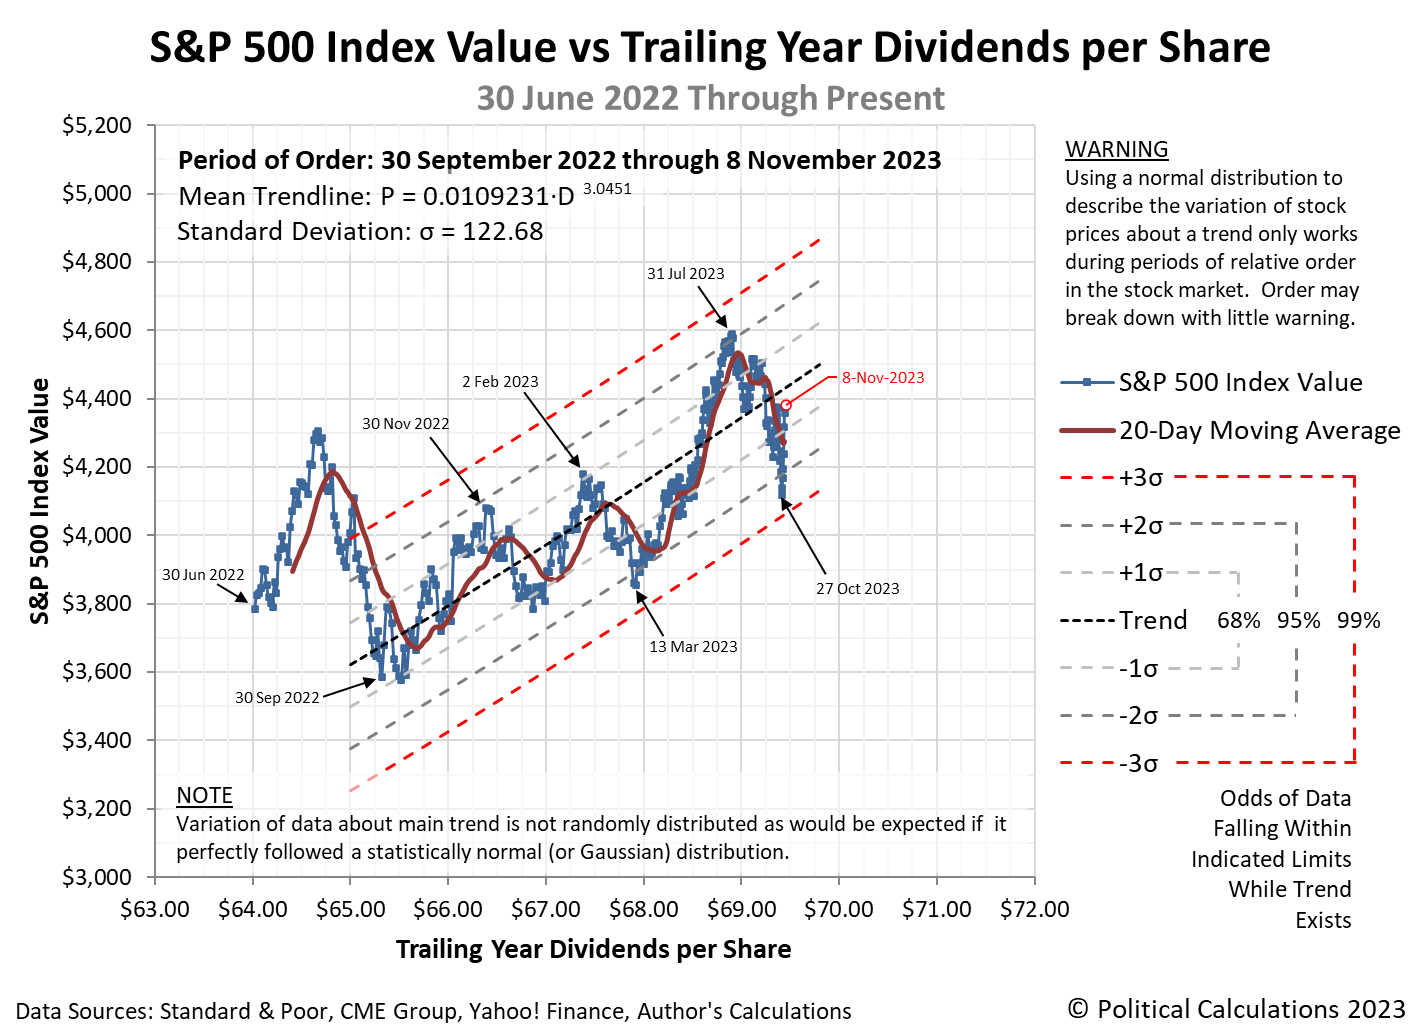
Since bottoming on 27 October 2023, the S&P 500 (Index: SPX ) has gone on a winning streak. The index has closed up on each of the last eight trading sessions.
Along the way, it has gone from being one and a half percent away from crossing the threshold signaling a breakdown of order in the U.S. stock market to now being within one and a half percent of the mean trend it has established since order returned to the market after 30 September 2022.
Whenever you hear about stock prices "reverting to the mean," this is the mean that matters. It only exists during periods of relative order in the stock market.
We should also caution that these periods of order are not described by a normal distribution, as suggested by the dotted curves shown on the chart. It's better described as a Lévy stable distribution , of which the normal distribution is a special case.
We've borrowed the statistical tools developed for analyzing normal distributions because they're useful, within certain limits. In the case of stock prices, those useful limits fall between two and three standard deviations of the central trend, where these types of stable distributions overlap.
What makes the relationship between stock prices and their underlying dividends per share different is that the trajectory of stock prices will fall within one standard deviation of the mean more frequently than would be predicted by a normal distribution during relative periods of order.
They'll also appear more frequently than would be expected when stock prices move more than three standard deviations from the central trend while that order holds.
That latter characteristic is what is meant when you hear that stock prices have " fat tails ". In practice, the longer stock prices stay outside these thresholds, the more likely it is that relative order in the market has broken down.
When that happens, the trajectory of stock prices becomes more chaotic, which will continue until a new period of relative order is established within the market.
The million-dollar questions left unanswered are how long will the current period of order last, and how will it break down when it does?
Editor's Note: The summary bullets for this article were chosen by Seeking Alpha editors.
For further details see:
The S&P 500 Reverts Toward The Mean